Many corporate pension plans have already taken several de-risking steps, including extending the duration of their fixed income, reducing the allocation to return-seeking assets, offering term-vested lump sum payouts, etc. As plan sponsors approach the end of their de-risking glidepath and begin to think about the structure of their end-state/hibernation portfolio, a logical next step is to customize their fixed income assets to more precisely match the exposures of the liability. Naturally, this step can introduce challenges and complexity. Utilizing a completion manager can address many of these challenges. In this paper we discuss the role of a completion manager, NISA’s approach to completion portfolio management, and some particular implementation considerations.
The Role of a Completion Manager
Fundamentally, the completion manager seeks to protect funded status against changes in the level of interest rates and changes in the shape of the yield curve. In so doing, the completion portfolio is constructed to fill in the differences between the liability and the traditional fixed income assets in other portfolios in order to:
- maintain the desired interest rate hedge versus the liability;
- minimize yield curve mismatch; and
- potentially align with the plan’s and liability’s spread exposure.
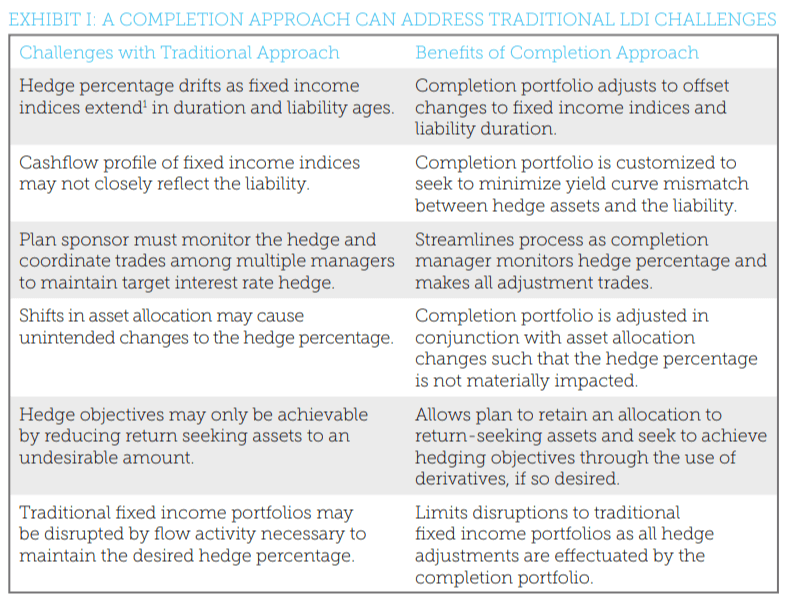
On a regular basis, the completion manager will adjust the portfolio’s interest rate exposure such that the plan’s overall fixed income assets closely match the liability (hence, “completing” the hedge versus the liability). Exhibit I, below, highlights some of the challenges plans may face when managing a liability hedging strategy using traditional fixed income benchmarks and how a completion approach can address these challenges.
Plans for which a completion strategy may be appropriate generally fall into one (or more) of the following categories:
- Plans that are approaching the end of their de-risking glidepath and have reduced return seeking assets to a modest amount (e.g., <=25%). At this allocation, hedge drift and yield curve mismatch versus the liability will have a material impact on funded status volatility.
- Plans that could not otherwise achieve their hedge objectives with the amount of assets allocated to fixed income. For example, plans that seek a 90% hedge of their liability’s interest rate risk, but are either underfunded or maintain a significant allocation to return seeking assets, can use a completion portfolio that includes the use of derivatives to achieve their hedging objectives. We further explore considerations surrounding the use of derivatives in completion portfolios later in this paper.
- Plans that have a policy-driven liability hedge target and report performance accordingly. For these plans, drift in the liability hedge percentage can lead to unacceptable tracking error from the policy objective. This is particularly important if the LDI strategy is being evaluated versus a fixed slice of the liability as a measure of success of the strategy and the feasibility of the strategy as an end-state portfolio. In both cases, the result is that a certain amount of funded status volatility is simply un-hedgeable or ill-advisable to hedge with a diversified bond portfolio.
NISA’s Approach to Completion Portfolio Management
Unlike a traditional active fixed-income manager, a completion manager needs to account for information beyond the assets for which they are responsible. The key elements of a NISA completion portfolio include the following:
Liability analysis: The client’s liability is generally the most influential factor in specifying the benchmark, and, consequently, constructing the portfolio. NISA’s process begins with a detailed review of actuarial data (e.g., liability cash flows, actuarial valuation reports, plan provisions, etc.) in an effort to gain a deeper understanding of the interest rate sensitivity of the liability. This can require obtaining data specific to certain plan design features (e.g., cash balance provisions, lump sum options, etc.) as interest rate sensitivity can be impacted by such features and often in ways not captured by the simple nominal cashflows produced by the actuary.
Benchmark analysis for non-completion portfolios: The allocation between credit and Treasuries is a key consideration in the design of an effective liability hedging strategy. NISA provides detailed analysis to help clients determine the appropriate benchmarks for the fixed income portfolios based on the goal of managing the interest rate, credit spread, and yield curve risks of the liability, while recognizing the need for the assets’ return to keep pace with the liability growth rate. Although the completion portfolio itself typically does not directly target a precise credit spread hedge, understanding the effective spread hedge of the credit assets, and maintaining appropriate plan-wide rebalancing boundaries are important parts of any completion engagement.
Completion portfolio design and implementation: During the design phase, NISA will help clients make decisions regarding the appropriate discount curve for valuing the liability, what instruments to use in the completion portfolio, the target hedge percentage, the benchmark methodology, etc.
The following data are necessary to determine trades for the completion portfolio:
- Liability cashflow projections: Typically, liability cashflows are updated once a year in conjunction with the annual valuation, although more frequent updates may be warranted if there are changes to the liability related to corporate activity, lump sum payouts, etc. NISA evaluates the assumptions underlying the liability cashflow projections to make sure they best represent the interest rate sensitivity of the liability and we may suggest cashflows to be projected under revised assumptions. For example, for a traditional final average pay plan, cashflows that assume all participants elect an annuity generally better reflect the interest rate sensitivity of the liability even if an optional lump sum form of payment is available to, and often chosen by, participants. NISA may adjust the liability cashflow projections intra-year — (between annual updates from the actuary) — for material amounts such as service cost and the difference between projected benefit payments and actual benefit payments.
- Discount curve: Most plan sponsors value their liability for accounting purposes based on a discount curve derived from a universe of AA-average quality corporate bonds. Typically, completion calculations will use that discount curve assuming the data can be provided with a reasonable frequency from the actuary or can be reasonably approximated.
- Market value of other fixed income portfolios: Updated market values are needed on a monthly basis in order to recalibrate the completion portfolio. When our processes identify a reported portfolio market value that is significantly different from the prior month market value adjusted for market returns, we seek to confirm the reported value with the client/custodian.
Trades are calculated based on benchmark exposures, as opposed to actual portfolio holdings, to avoid offsetting active alpha-seeking positions of other fixed income managers. For example, consider a manager that chooses to be underweight duration versus the portfolio benchmark based on a view that interest rates are going to rise. If that exposure was considered when managing the completion engagement, trades would occur in the completion portfolio that would neutralize the underweight position and therefore, denigrate the value of the active manager.
Ongoing completion portfolio management: NISA values the liability on a monthly basis (consistent with the publishing of monthly discount curves) and executes trades required to maintain the target hedge percentage. In addition to monthly rebalancing trades, NISA monitors the portfolio daily to verify that the appropriate interest rate hedge is maintained. Adjustments may occur intra-month to account for large movements in interest rates and flows between fixed income accounts. For accounts that use derivatives, the portfolio may be adjusted intra-month for changes in relative costs considerations among available instruments, to manage cash margin, and to roll futures contracts.
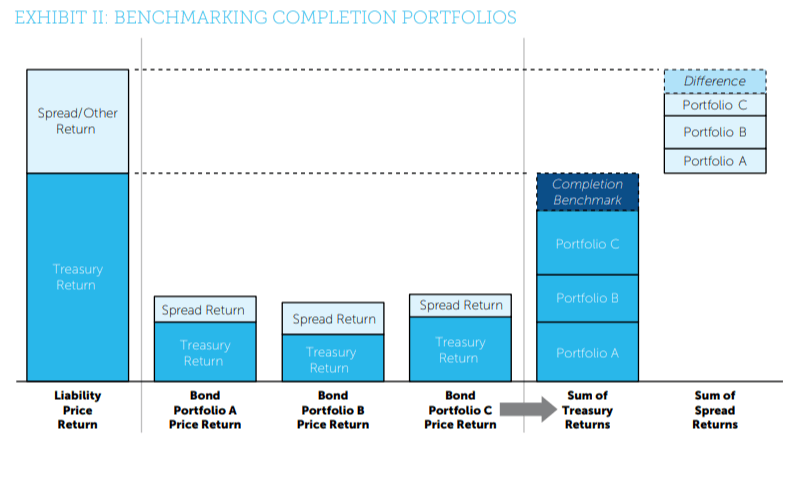
Ex-post evaluation: The ultimate benchmark for a completion portfolio is the change in the value of liability. The liability-based benchmark and associated formulas are clearly defined in the completion portfolio guidelines.
Liability and fixed income indices’ returns can be decomposed into 1) a yield accrual (return due to the passage of time), 2) returns from unexpected changes in Treasury yields, and 3) returns from changes in credit spreads. The completion portfolio benchmark can be identified in the context of the Treasury return of the liability. Specifically, the benchmark for the completion portfolio is the difference between the Treasury return of the liability and the aggregated Treasury returns of the fixed income portfolios, as illustrated in Exhibit II.
In addition to performance reporting for the completion portfolio, NISA provides a planlevel Pension Asset Liability Monitor (“PALM”) report on a quarterly basis. The PALM report includes funded status attribution and liability hedge analytics as well as surplus Value-atRisk (“VaR”) analysis to help plan sponsors measure, evaluate and monitor risks embedded in their plans.
Additional Considerations
Derivatives: NISA recommends the use of derivatives when liability hedging objectives cannot be met with available fixed income, or if the efficacy of the hedge can be improved with derivatives. This can occur with a combination of the following:
- Fixed income assets that are substantially less than the portion of the liability being hedged
- A material allocation to growth-seeking assets
- A lower plan funded status
- A liability duration that is longer than typical benchmarks
Derivatives used by NISA in completion programs include Treasury futures, total return swaps on Treasury indices or single CUSIPs, and Treasury repurchase agreements (“repo”). For clients that are less familiar/comfortable with derivatives, Treasury futures are commonly the first derivative type to be added to the available toolkit of derivatives given their exchange traded and cleared format.
NISA evaluates tracking error versus cost when deploying capital to build the portfolio. For example, when derivatives are available in a completion program, NISA may choose to purchase long maturity STRIPS with the available capital to match liability exposures on the long end of the yield curve and fill in short-intermediate exposures with Treasury futures. NISA monitors the relative costs of available alternatives and may shift exposures as market
dynamics change.
Hedging the liability spread risk: Liability discount rates are typically based on the yields of corporate bonds. As a result, liability risk can be attributed to three principal factors: 1) general interest rate risk, 2) credit spread risk, and 3) yield curve risk2 . The contribution of these factors to overall funded status volatility changes over time and with market conditions, and the right blend of corporate bonds and Treasuries to hedge the liability is dynamic3 . Historically, general interest rate risk has been the largest driver of liability volatility, but spread risk can also be significant and should be monitored and managed.
While general rate risk and yield curve risk can be estimated and hedged with a high degree of precision, spread risk is more challenging4 due to: 1) differences between the universe of bonds used to construct the liability discount curve and diversified investment grade corporate bond portfolios, 2) discount curve construction techniques, and 3) downgrades and defaults. It is important to note that other assets in the pension plan (e.g., public equity, private equity, high yield, etc.) likely contribute to a hedge of the spread component of the liability. With that said, in our opinion, these same asset classes do not contribute to the general interest rate hedge in a reliable manner.
NISA provides analysis to evaluate the appropriate allocation to credit within the hedge assets and monitors spread risk’s contribution to funded status volatility. When NISA manages both a completion portfolio and a credit portfolio, the program typically allows for adjustments to both the general interest rate hedge and the spread hedge when a change to the spread component of the strategy is warranted.
Conclusion
Regardless of what the ultimate end game is for a plan – hibernation or annuitization – a completion approach can go a long way to addressing challenges along the way. Every plan is unique, and as plan sponsors begin to think about their structure in the end state, the one-size-fits-all design of traditional benchmarks likely falls short of meeting a plan’s unique characteristics and objectives. NISA works with clients and their advisors to design and implement custom completion portfolios. We follow a holistic approach that incorporates a detailed analysis of the liability,
an evaluation of alternatives based on the plan’s goals and objectives, ongoing efforts to seek to optimize the efficiency of the hedge, and an ex-post evaluation of performance versus the plan’s objectives.
Appendix: Illustrative Example
Description of illustrative plan: The plan has a traditional defined benefit formula based on final average pay and years of service, makes payments to retirees and their beneficiaries in the form of a life annuity, and is frozen (i.e., there are no future benefit accruals). Recent de-risking actions include a one-time voluntary lump sum payout offering to terminated vested participants, reduction of the return-seeking assets’ allocation to 35%, and adoption of an asset-allocation glidepath based on funded status. Fixed income is allocated to a blend of long corporate bonds and STRIPS chosen to approximate the spread volatility of the liability. The plan is currently 90% funded. At 95% funded, the next de-risking glidepath trigger, the plan intends to reduce return-seeking assets by an additional 10% and implement a custom completion portfolio tailored to the liability, targeting a 90% hedge of the liability interest rate risk.
An understanding of the interest rate sensitivity of the liability is foundational to the design of an effective hedging strategy. For this illustrative plan, the projected cashflows are static (ignoring differences between benefit payment experience and actuarial assumptions) because it is frozen, doesn’t pay lump sums, and is an annuity-based benefit. Therefore, the actuarial expected benefit payments, represented as annual cashflows, are a good representation of the interest rate sensitivity of the liability. In other cases, the cashflows themselves may change in response to interest rate movements and adjustments may be required.
As illustrated in Exhibit III, this liability will increase (decrease) in present value by approximately $140mm for a 1% decrease (increase) in the discount rate.
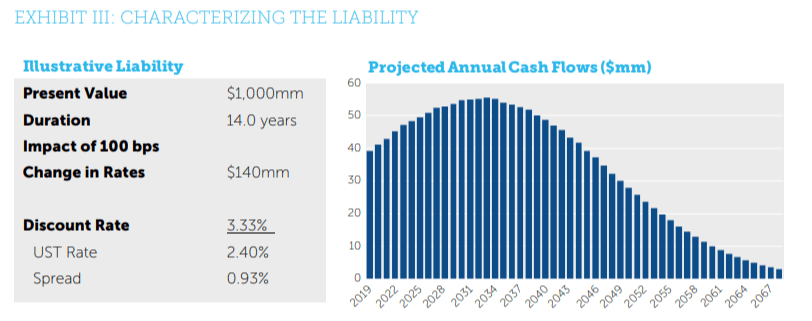
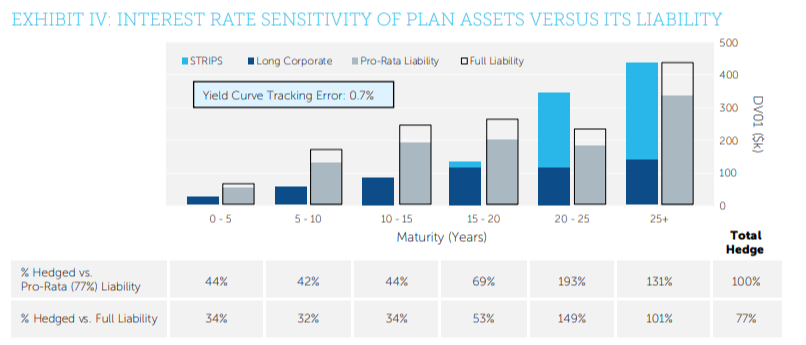
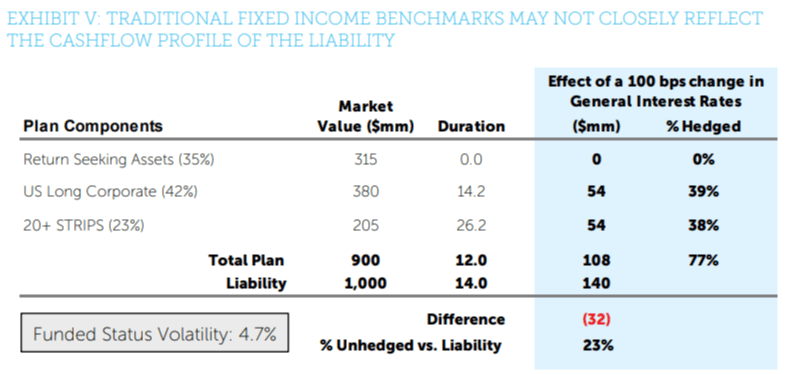
Exhibit IV compares the general (i.e., Treasury) interest rate sensitivity of the plan’s assets to the liability. The long corporate and STRIPS portfolios have combined sensitivity to a 1% change in rates of $108mm, which offsets (i.e., hedges) 77% of the liability’s interest rate exposure. Importantly, the hedge percentage will drift over time as durations change for the fixed income and liability. The funded status volatility of the plan is 4.7% 5.
Source: NISA calculations based on data from Bloomberg Barclays and FTSE as of 6/30/2019.
Source: NISA calculations based on data from Bloomberg Barclays and FTSE as of 6/30/2019.
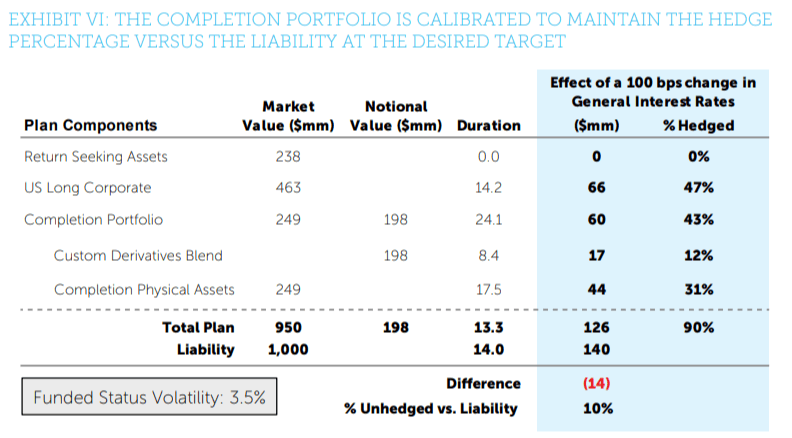
After the 95% funded status glidepath trigger is reached, the STRIPS component of the hedge assets is reallocated to a completion portfolio that includes STRIPS, Treasury whole bonds,
Treasury futures, and total return swaps on Treasuries. The completion portfolio is calibrated to hedge 90% of the liability’s general interest rate risk, as illustrated in Exhibit VI.7 In this example, the hedge assets’ blend of Treasuries and credit is unchanged from the current allocation. Funded status volatility has been reduced by about 25%, from 4.7% to 3.5%.
Source: NISA calculations based on data from Bloomberg Barclays and FTSE as of 6/30/2019.
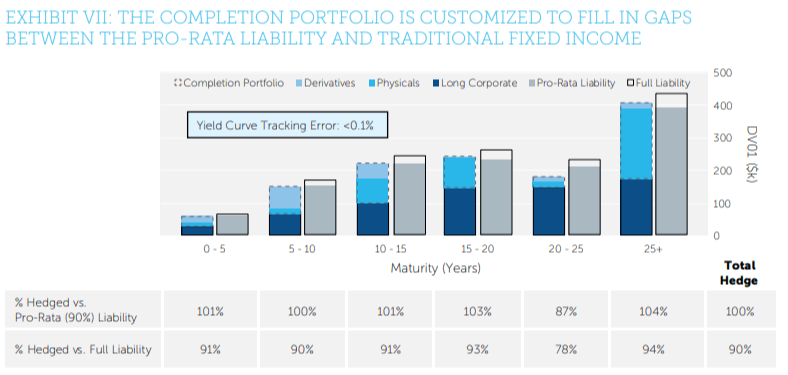
As compared to the current allocation, the liability hedging strategy that incorporates a completion portfolio provides a much closer match of the liability (see Exhibit VII). Total DV01 of the hedge assets was increased to target 90% of the liability and was redistributed across the curve. The completion portfolio neutralized the overweight to the long end of the curve filled in the underweight at the short and intermediate part of the curve. Yield curve tracking error was reduced from approximately 70 basis points to less than 10 basis points.
NISA evaluates costs versus tracking error to choose among the instruments available to construct the portfolio. This portfolio deploys the available capital to purchase exposure primarily in the 10 – 20 years and 25+ years part of the curve. Other gaps versus the liability are filled in with derivative exposure. A modest amount of 2-year and 5-year Treasury futures are utilized, while the remaining derivative exposure is obtained via total return swaps.
The completion portfolio is adjusted on a monthly basis to stay at the 90% hedge target and yield curve neutral versus the liability.
Source: NISA calculations based on data from Bloomberg Barclays and FTSE as of 6/30/2019.
Selected NISA Papers
Our papers can be found on the Resources section of our website:
- A Strategy That Pays Dividends (December 2016)
- NISA’s Target Date Glidepath (March 2016)
- The Full Picture on Partial Buyouts (November 2015)
- Regulators Pave the Road to Retirement Income (May 2015)
- Credit Where It’s Due (March 2015)
- Pension Buyout Reality Check (December 2014)
- The Beauty of the Bundle (December 2014)
- Long Live Longevity Annuities (September 2014)
- Refocusing on Retirement Income Risk (April 2014)
- Cash on the Barrelhead (February 2014)
- At the Crossroads (August 2013)
- Putting Longevity Risk in its Place (April 2013)
- Defining the Pension De-Risking Spectrum (January 2013)
- The Credit Rating Impact of Pension De-Risking (January 2013)
- Efficient Tax Management in Taxable VEBA Portfolios (November 2012)
- PSRX Overview and PSRX Guide (September 2012)
- Corporate Bond Scarcity? The Case for Separating Interest Rate and Spread Risks (August 2012)
- Break-even Yield Curve (August 2011)
- Dynamic Liability Driven Investing (July 2011)
- Interest Rate Hedges (May 2009)
- Considerations Surrounding Corporate Bonds in Pensions (December 2008)
1 Most fixed income indices are reconstituted on a monthly basis. Bonds that have less than the minimum years remaining to maturity, per the index inclusion rules, are removed from the index, and bonds that have been newly issued over the previous month are added to the index. This activity causes most fixed income indices to extend in duration, on average, on monthly reconstitutions.
2 This excludes actuarial risks, such as mortality.
3 See NISA whitepaper, Credit Where It’s Due, Finding the Right Corporate Bond Allocation with LDI Hibernation for more details. https://nisa.com/wp-content/uploads/2015/03/NISA-Credit-Where-Its-Due.pdf
4 For clients who wish to reduce liability spread risk as much as possible, other solutions, such as a “custom credit” portfolio, may be appropriate. As a manager of custom credit portfolios, NISA works with plan sponsors, actuaries and consultants to analyze the liability discount methodology and constructs a unique portfolio of mostly corporate bonds that reflects the characteristics of the liability. This includes matching the credit quality and overall spread of the liability to the extent possible. See NISA Perspectives post titled Two Alternatives in the End-State (https://www.nisa.com/perspectives/two-alternatives-in-the-end-state/) for a comparison of completion
and custom credit.
5 Funded status volatility represents a one standard deviation range. Liability is assumed to be discounted at the FTSE Pension Discount Curve. Return seeking assets are assumed to be allocated 50% Russell 3000, 30% MSCI EAFE, and 20% Hedge Funds. All data are as of 6/30/2019.
6 Please note, we are not implying that this hedging strategy is inappropriate in any way. In fact, for many plans it makes sense to implement a hedge in this manner. Allocating assets to fixed income benchmarks that are longer in duration than the liability allows the plan to hedge more of their interest rate risk, but at the sacrifice of a yield curve mismatch versus the liability. Additionally, while the hedge assets may be overweight on the long end of the curve when compared to the pro-rata liability, they are less overweight when compared to the full liability. In this illustrative example, the DV01 of the hedge assets nearly matches that of the full liability for cashflows beyond 25 years. If, alternatively, this plan had invested the fixed income at the duration of the liability (14 years) the hedge percentage would be 58% (as opposed to 77%) and funded status volatility would be higher. Stated differently, duration is a more material risk factor than yield curve, and therefore should be hedged first. Importantly, derivatives can allow a plan to hedge both risks at the same time.
7 This example includes the use of derivatives to achieve a 90% hedge and refine the yield curve to match versus the liability. In order to achieve the 90% hedge target, this plan needs 24 years of duration from the completion target. While this exposure could be obtained using physical securities only, it would result in a significant yield curve mismatch versus the liability. Including derivatives allows the plan to achieve the target hedge percentage and reduce yield curve risk.