Increased funded status, newly legislated funding relief and historical contribution credit balances have created clearer skies and calmer waters for plan sponsors as we look forward over the next several years – from a contribution perspective.
What a difference a year makes. On March 31, 2020, the average corporate pension plan’s funded status stood at 85%.[1] One year later, the average plan’s funded status has risen to 95%. This radical improvement in fortune, fueled by a combination of large rate increases and robust equity performance, would normally be reason enough for plans to take de-risking steps. And given the near ubiquity of glidepaths among our clients, we have witnessed exactly that, particularly in the last six months.
But combining this funded status improvement with 1.) the additional contribution relief provided in the American Rescue Plan Act of 2021 (ARPA) and 2.) the preponderance of large credit balances among plans (many of which stem from voluntary contributions in 2017 and 2018 due to tax code changes), has led to drastic reductions in expected future contributions for the typical plan. So much so that we believe there is a strong argument to accelerate the de-risking moves dictated by one’s glidepath. In particular, for plans that are greater than 95% funded[2], we see a compelling case to move to a hibernation portfolio – now.
What a year. Really.
Much could be said about the past 12 months, most of which is not fit to print. But one unequivocal positive has been the marked increase in funded status. After quickly losing 8 percentage points from December of 2019 through April 2020, funded status for the average plan has swelled by approximately 12 percentage points since.
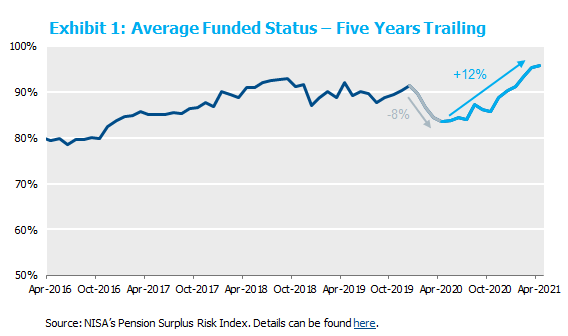
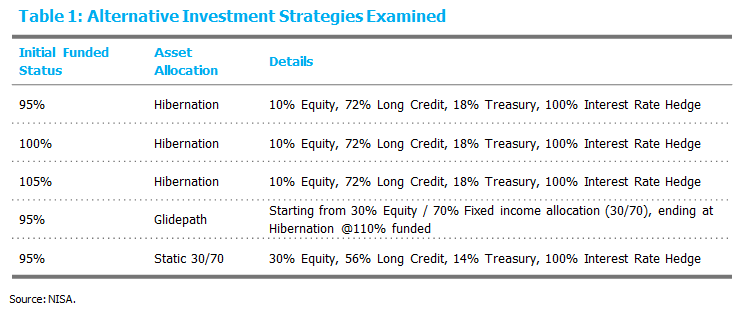
The rebound during this period in both interest rates and equity markets has led to the strongest funded status since just before the global financial crisis. There are many reasons this recession is unlike any other, but for pension plans to have both higher funded status and funding relief is really quite extraordinary. To demonstrate the magnitude of this one-two punch, we explore the potential for future contributions, measured as a percent of today’s value of the liability, for five hypothetical plans[3]:
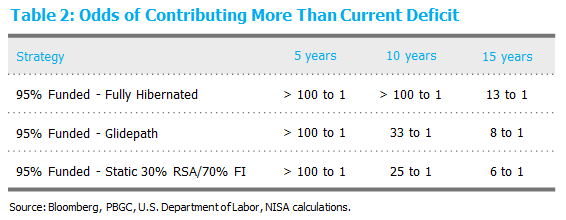
Looking first at the hibernation scenarios presented in Exhibit 2, it is quickly evident that there is limited potential for contributions – in all cases. It is perhaps not surprising that the 105% funded plan has essentially no potential contributions (as measured at a 95% confidence level) given the 5% overfunded-ness, the limited funded status volatility of hibernation strategies and the extremely long contribution amortization period[4]. What is perhaps surprising is that there is less than a 5% chance that contributions will exceed 0.5% over the next 5 years even for the 95% funded plan in hibernation. Even over 10 years, the results are quite compelling. A plan that is 5% underfunded today could hibernate immediately, and have a mere 5% chance of contributing more than 2% over the next 10 years. This is as strong of an incentive to hibernate as it is a disincentive to contribute.
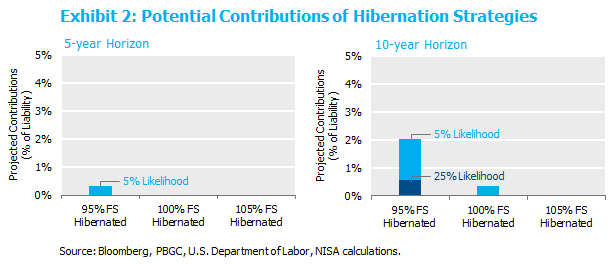
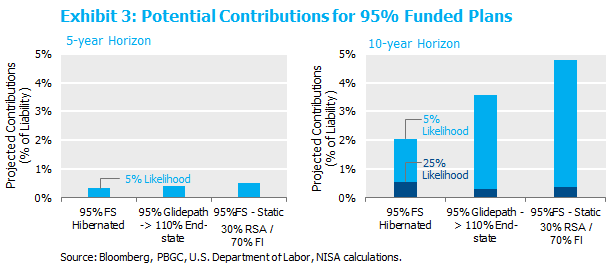
So, there is a compelling case for this 95% plan to move to hibernation now. But this is not a conclusive case until we compare the hibernation strategy to other alternatives – specifically, remaining on a glidepath or a static allocation of 30/70. The figures below provide a comparison of these strategies. Curiously, both the glidepath and the 30/70 strategies provide very little, if any, advantage over an early hibernation plan. In fact, in the more extreme outcomes (95th percentile), they perform appreciably worse. These data present a strong case for accelerating along one’s glidepath at 95% funded.
But that is not the whole story.
Remember when taxes were going down? Way back in ’18.
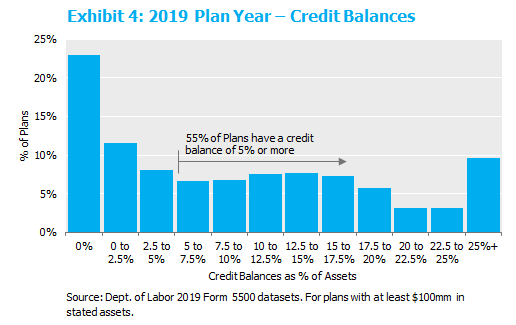
Taxes? Why are they relevant for this discussion? When corporate tax rates dropped in 2018, it gave plan sponsors an opportunity to contribute to the plan in the prior tax year, and therefore, at the higher tax rate. So, if a company contributed in the 2017 tax year[5], the same dollars went into the plan, but the tax benefit was much greater than if they contributed in subsequent years. So many plans did indeed pull contributions forward and made large voluntary contributions. These voluntary contributions result in credit balances[6]. Pulling data from Form 5500s does in fact show the preponderance of plans have significant credit balances currently. For example, the median plan has a credit balance representing approximately 7% of the liability[7]. The figure below provides an estimate of the distribution of credit balances for plans with assets greater than $100mm.
Since credit balances provide a great deal of contribution flexibility (read deferrals), it is important to incorporate this facet of the real world into the analysis above. Re-running the analysis using a 5% starting credit balance (55% of plans have a 5% balance or higher) yields, well, very boring pictures.
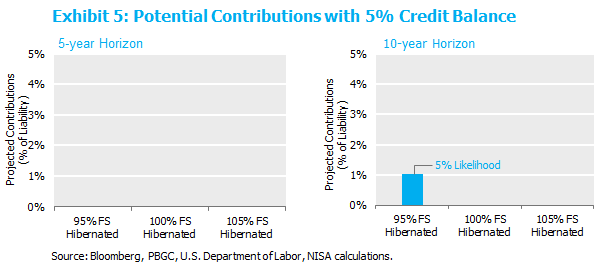
For all intents and purposes, the 95% funded plan now has no appreciable chance of meaningful required contributions over 10 years – specifically, there is a 5% chance the plan would need to contribute 1% or more.
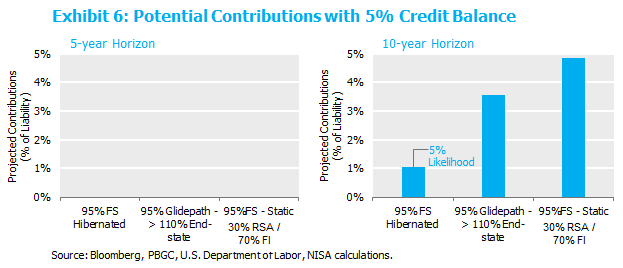
Similarly, comparing an immediate hibernation strategy at 95% versus the glidepath and 30/70 strategies results in a resounding argument to de-risk sooner rather than later.
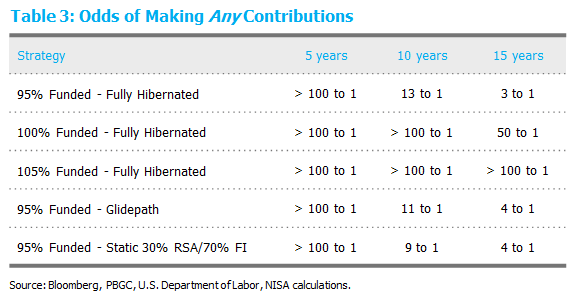
“Never tell me the odds.” That is, unless they’re really good.
I will violate Han Solo’s mantra, and tell you the odds. Specifically, re-cutting the data above we calculate the odds of any contributions at all and the odds of required contributions exceeding the starting 5% deficit in each of the relevant scenarios above. Given the limited precision of any analysis for the extreme tails, we capped the odds ratio at 100 to 1 in the table below.
Conclusion
This trifecta of effects — improved funded status, legislated contribution relief and large credit balances — have placed pension plans in the best shape of recent memory with respect to limiting potential contributions. Plans that are nearly fully funded or overfunded should consider accelerating their de-risking decisions to protect this elevated funded status and limit the potential for future contributions.
[1] All references to plan averages are based on data from NISA’s Pension Surplus Risk Index. Details can be found here.
[2] Throughout this paper, the analysis ignores any possible future service cost. For fully frozen plans, this analysis is directly applicable as drafted. For partially frozen plans with some remaining service accruals, the analysis can be interpreted as drafted if 1) the sponsor plans to contribute service cost annually and those contributions are ignored for this purpose or 2) the definition of funded status used throughout is adjusted to include the present value of all future service.
[3] All plans are modeled with the same underlying liability profile and contribution policy. The initial liability has a 12-year duration, and there are no service cost accruals. Contributions are modeled to be the greater of the Minimum Required Contribution and the amount necessary to maintain a minimum 80% Adjusted Funding Target Attainment Percentage (AFTAP). Plan administration costs are included in all scenarios. Simulations are based on NISA’s capital market assumptions. NISA’s capital market assumptions are available upon request.
[4] ARPA increased the period over which contributions are intended to reduce funding deficits from 7 years to 15 years.
[5] Sponsors with a calendar year Plan Year generally have until September 15 of the following year to make contributions in the prior tax year, in this case, the higher tax rate 2017 year.
[6] Historical excess contributions built up the Funding Standard Carryover Balance; with the Pension Protection Act of 2006, they instead can be added to the Prefunding Balance beginning in 2008.
[7] Given the difficulty in measuring a comparable (marked-to-market) liability from Form 5500s, we actually collected credit balances as a percent of the reported asset values. For our purposes here, with think those to be a reasonable proxy for credit balances as a percent of the liability.