
Economic and Market Overview
June 2025
Equities and credit spreads retained their momentum, and Treasuries joined the rally as officials indicated progress towards multiple trade deals, armed conflict in the Middle East came and went, Congress continued working towards passing a reconciliation bill and the Fed signaled the need for continued patience.
Markets
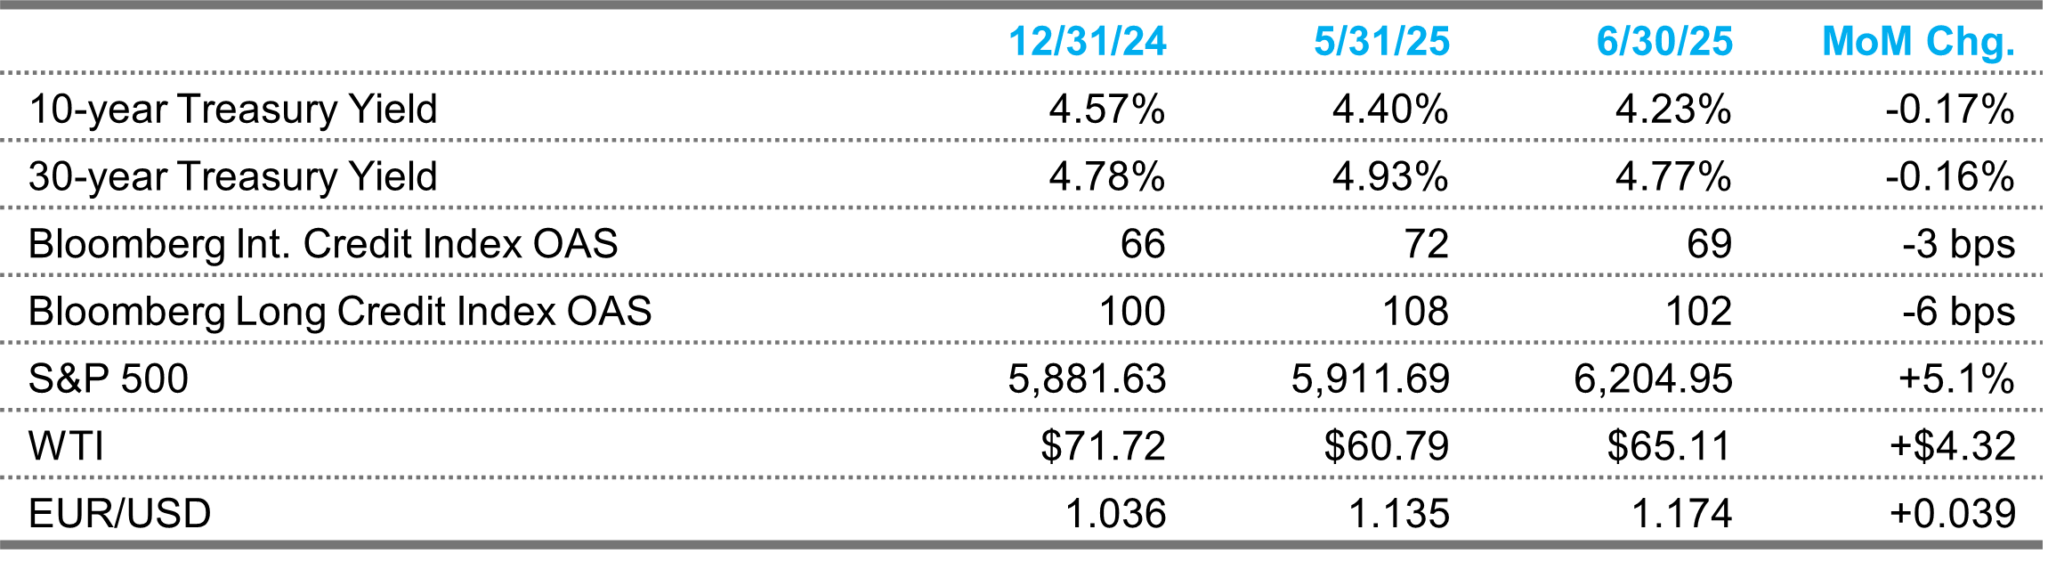
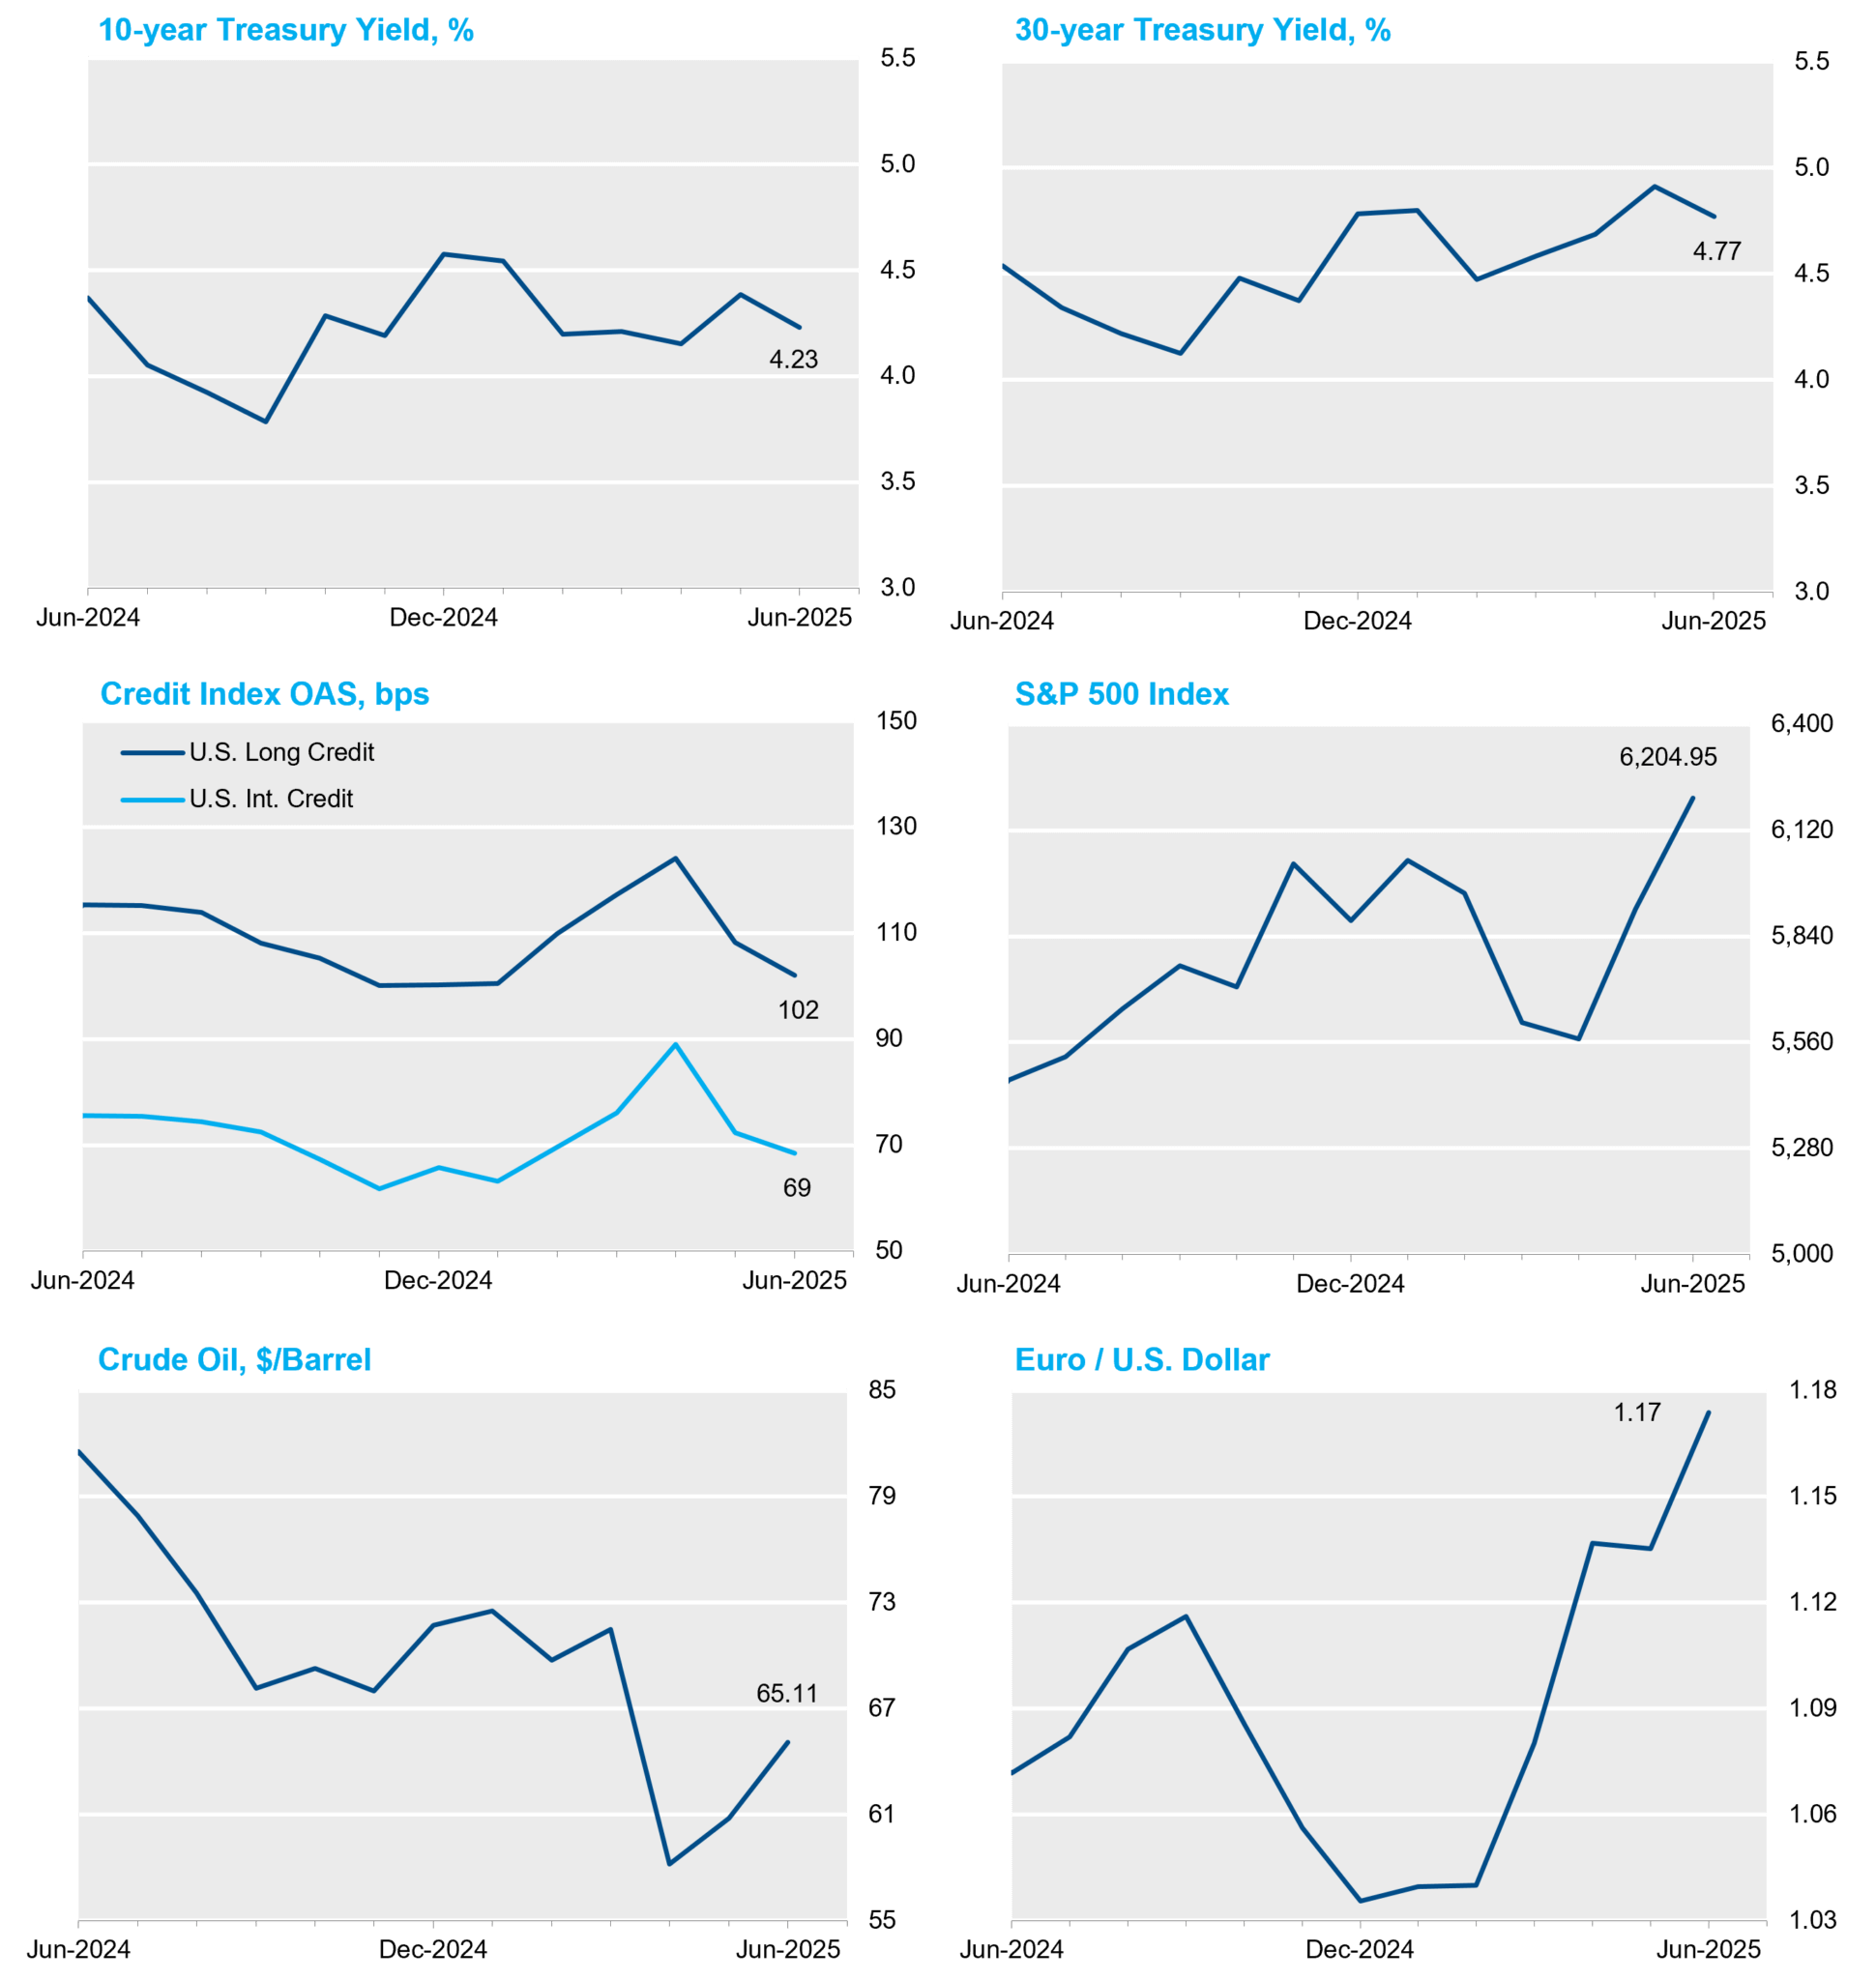
The S&P 500 returned 5.1% in June to finish up just under 25% from its early April low as market participants grew increasingly optimistic regarding progress towards trade deals and a significant, yet brief, conflict in the Middle East. Treasury yields retraced much of the ground lost in May, rallying by 15-20 bps across the curve. Credit spreads ended tighter, but spent much of the month in a very tight range. Supply remained fairly robust even with summer under way; J.P. Morgan reported $111 billion in total investment grade issuance for the month, 18% over the average of the prior four Junes. The price of oil was volatile throughout the month as WTI futures traded near $76/bbl after U.S. bombers struck Iranian nuclear facilities, before falling into the mid-$60s after the response was relatively muted and possibly scripted. Crude ultimately rose by 7.1% over the month. The Dollar Index extended its monthly losing streak to six and the 10.8% decline over that period marked its worst first half performance since 1973.
Economic Data
While nonfarm payrolls grew at a 139k pace in May, topping expectations by 13k, the release also continued the recent trend of including a much larger net downward revision to the prior two months, which was 95k this time around. Even though the unemployment rate held steady at 4.2%, the participation rate surprised with a 0.2% decline to 62.4%. Looking ahead, economists surveyed expect a 110k pace of NFP growth and a 0.1% increase in the unemployment rate when data are released a day earlier than usual on July 3. Retail sales fell by 0.9% MoM in May—0.3% more than expected, while consumer sentiment indices contradicted each other again as tariff concerns weighed on the Conference Board’s figure for June, which fell by 5.4 points versus consensus for a 1.4-point gain. The University of Michigan, meanwhile, reported a surprise 8.5-point increase in its index as respondents were less concerned about trade policy. U.S. GDP fell at a 0.5% rate in the first quarter as the third release was revised down by 0.3%. The underlying details weakened again as personal consumption was revised down a further 0.7% to 0.5%—1.2% lower than the advance release. GDP was distorted by tariff frontrunning and is expected to return to positive territory in Q2.
Inflation
Inflation data for May were once again softer than expected as economists were forced to wait another month for tariff costs to show up in higher consumer prices. Headline and core CPI rose by just 0.1% each MoM—0.1% and 0.2%, respectively—cooler than surveys, while PPI readings were muted on balance. Core PCE was the lone outlier exceeding forecasts by 0.1% MoM, though was still a fairly benign 0.2% pace. Near-term inflation expectations fell as 2 and 5-year breakevens finished 17 and 8 bps lower at 2.45% and 2.31%. Longer breaks fell by just 4-5 bps.
Federal Reserve
The FOMC left the policy rate unchanged at their 6/18 meeting as expected. Chairman Powell reiterated the wait-and-see posture the Fed has embraced as they watch inflation data for signs of tariff effects. He suggested that the Fed would have cut rates given benign backward-looking inflation data if not for the uncertainty surrounding tariffs and consumer prices. The Summary of Economic Projections showed a slower growth forecast and higher inflation forecast relative to March. The dot plot shifted slightly in a hawkish direction, but not enough to change the closely watched 2025 median. The 2025 dots now reflect a fairly divided Committee with nine (and the median) projecting two cuts this year and seven projecting no cuts. Some cracks appeared in this posture later in the month, most notably from Governors Waller and Bowman who advocated for a rate cut as soon as July. They were the exception, however, as most other Fed speakers signaled September as the earliest possible meeting for a cut, by which time the Fed will have three more CPI prints in hand. As the month came to a close, short rate markets were pricing about 2.5 cuts this year.
Sources: Bloomberg Index Services Ltd., Bloomberg.
This overview is for informational purposes only. The information has been obtained from sources considered to be reliable, but the accuracy and completeness are not guaranteed. There is no assurance that any economic trends mentioned will continue or that any forecasts will occur. Economic data are as of the dates noted.
Disclosure Information
By accepting this material, you acknowledge, understand and accept the following:
This material has been prepared by NISA Investment Advisors, LLC (“NISA”). This material is subject to change without notice. This document is for information and illustrative purposes only. It is not, and should not be regarded as “investment advice” or as a “recommendation” regarding a course of action, including without limitation as those terms are used in any applicable law or regulation. This information is provided with the understanding that with respect to the material provided herein (i) NISA is not acting in a fiduciary or advisory capacity under any contract with you, or any applicable law or regulation, (ii) that you will make your own independent decision with respect to any course of action in connection herewith, as to whether such course of action is appropriate or proper based on your own judgment and your specific circumstances and objectives, (iii) that you are capable of understanding and assessing the merits of a course of action and evaluating investment risks independently, and (iv) to the extent you are acting with respect to an ERISA plan, you are deemed to represent to NISA that you qualify and shall be treated as an independent fiduciary for purposes of applicable regulation. NISA does not purport to and does not, in any fashion, provide tax, accounting, actuarial, recordkeeping, legal, broker/dealer or any related services. You should consult your advisors with respect to these areas and the material presented herein. You may not rely on the material contained herein. NISA shall not have any liability for any damages of any kind whatsoever relating to this material. No part of this document may be reproduced in any manner, in whole or in part, without the written permission of NISA except for your internal use. This material is being provided to you at no cost and any fees paid by you to NISA are solely for the provision of investment management services pursuant to a written agreement. All of the foregoing statements apply regardless of (i) whether you now currently or may in the future become a client of NISA and (ii) the terms contained in any applicable investment management agreement or similar contract between you and NISA.