



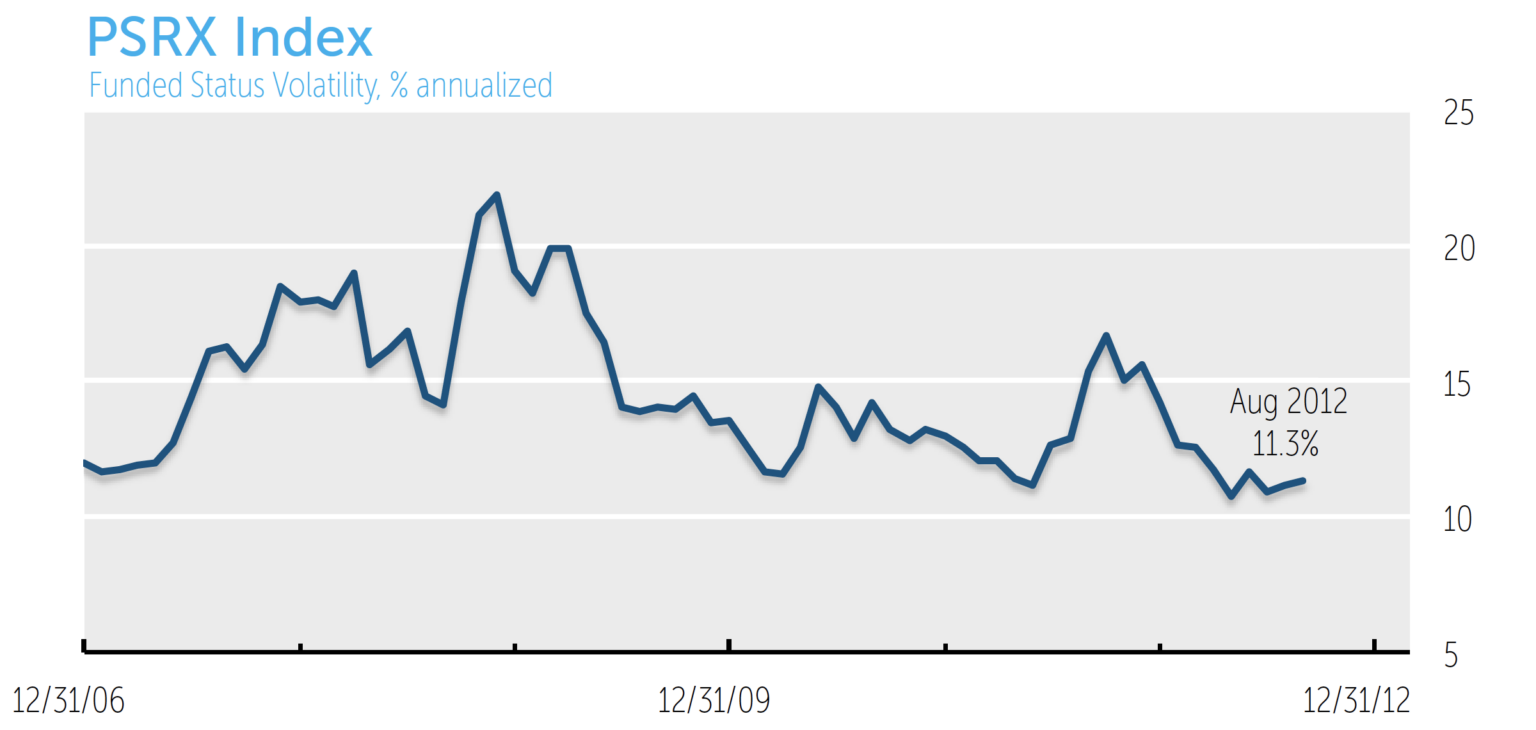
NISA Investment Advisors, LLC (NISA) is pleased to introduce the Pension Surplus Risk Index, or PSRX*, a forward-looking estimate of the funded status volatility of US corporate defined benefit pension plans. The index level represents a one standard deviation change in funded status over a one year horizon, based on the average of the 100 largest pension plans.1 For example, an index value of 15% suggests approximately a one in three chance that a $1 billion plan could lose or gain more than 15%, or $150 million, in funded status in one year.2
We believe the PSRX and its accompanying sub-indices will provide a useful risk measure for CFOs, Treasurers and plan fiduciaries to gauge their pension risk’s influence on enterprise risk, implications for capital structure, and level of beneficiary security, respectively. It is our hope the index, a dynamic measure of surplus risk, offers an additional dimension of context that proves meaningful in framing decisions.
Introduction
Plan sponsors need look no further than recent experience to recognize the potential for significant funded status volatility. The last decade has been an unpleasant roller coaster ride for many plans. Fiduciaries have witnessed improvements in funding levels during periods of market stability and growth, and through sponsor contributions, only to watch those surpluses quickly erode to deficits as equity markets and interest rates turned against them. Three such cycles have occurred since 2000.
While there is no crystal ball to predict the specific direction markets will take, plan fiduciaries and industry analysts may be comforted by the fact that future volatility in pension plans may indeed be forecasted based on available data. By integrating equity and interest rate option implied volatilities with a plan’s blend of assets and its liability, a forward-looking estimate of the potential changes in funded status, or “pension surplus risk,” can be derived.
The PSRX is a measure of this risk, reporting the prospective annual volatility for the average of the 100 largest US corporate defined benefit plans, as determined by NISA. We hope the PSRX will serve both to raise awareness about the level of risk inherent in corporate plans, and to provide a market-responsive indicator of how that risk changes over time.
Rationale for a New Type of Index
Market indices provide investors a critical tool to evaluate strategies. Price indices that aggregate the value of financial assets have been available for over 100 years. More recently, market participants have developed volatility indices to measure market risks.
While lesser known, indices that track the average funded status of pension funds are useful in benchmarking pension plans. Their primary shortcoming is that they are backward-looking in nature – the current measures merely convey where the average fund has migrated over time.
While these data are useful to pension fund fiduciaries, we believe a forward-looking pension-centric index is needed. In particular, we believe an index that reflects both the past, as measured by average funded status, and the future, as measured by funded status volatility, provides a more useful, multi-dimensional metric.
Index Interpretation and Sub-Indices
The PSRX attempts to measure the annualized funded status volatility of pension plans on a prospective basis. The index level as of August 31, 2012 of 11.3% implies that an annual gain or loss in plan funded status of 11.3% is anticipated with the likelihood associated with a one standard deviation move.
In addition to the primary index, NISA provides a matrix of risk estimates for various combinations of risk asset allocations, liability durations and funded status levels, to allow individual plans to determine a volatility level that more closely corresponds to their circumstances. These sub-indices assume hypothetical plans with static funded status, liability durations and risk asset allocations over time, for example, 85% funded, 12.5 duration and a 60% allocation to risk assets.
NISA can also provide a customized analysis based on plan-specific data. Please contact a NISA client service representative to discuss such an analysis.
Methodology Overview
The PSRX reflects the average of the individual funded status volatilities for the index-constituent plans. Constituent plans are:
- US defined benefit corporate pension plans;
- Publicly-traded; and
- The 100 largest plans based on pension liability present value (PBO), as determined by NISA from publicly available documents, and re-constituted annually.
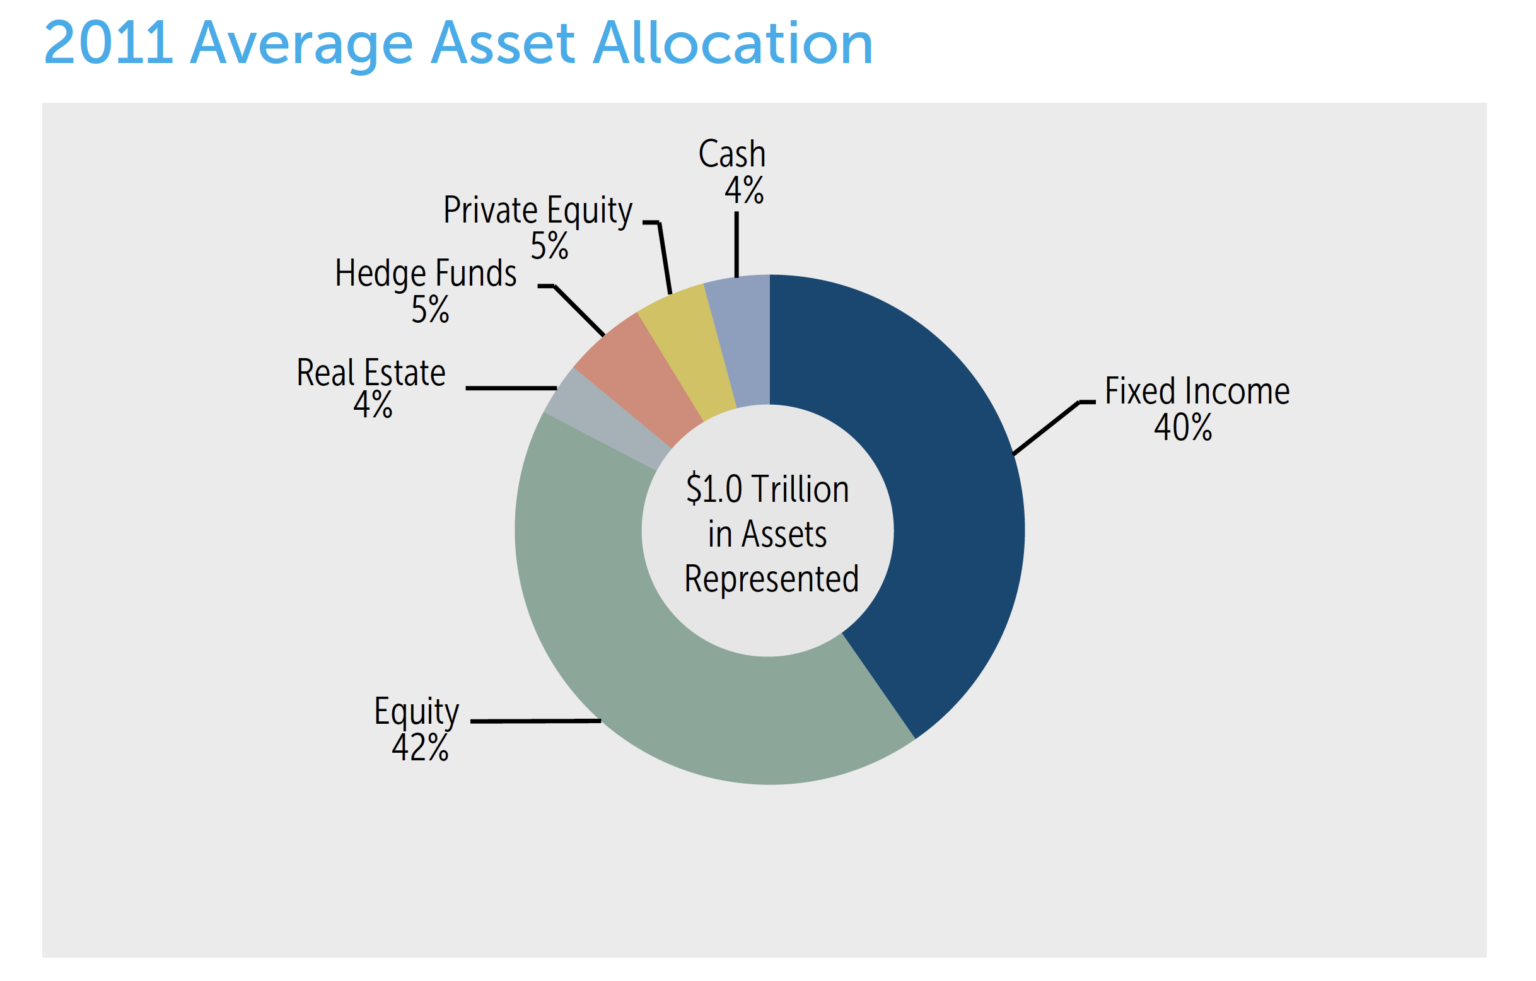
The constituent plans represent approximately $1.0 trillion in assets and $1.3 trillion of liabilities in aggregate as of 12/31/11.
The PSRX asset allocation changes annually based on data provided in firms’ 10-Ks. The chart below shows allocations for the 2011 plan year as determined by NISA.
Deriving individual plan volatilities involves three main components:
- Plan-specific asset allocation and liability data, derived from publicly available sources;
- Implied volatilities for various markets from traded options; and
- Correlations between the various asset classes and liability components from historical data.
These three components provide the necessary inputs for a traditional portfolio volatility calculation; in this case the “portfolio” is the combination of both the assets and liabilities of the plan.
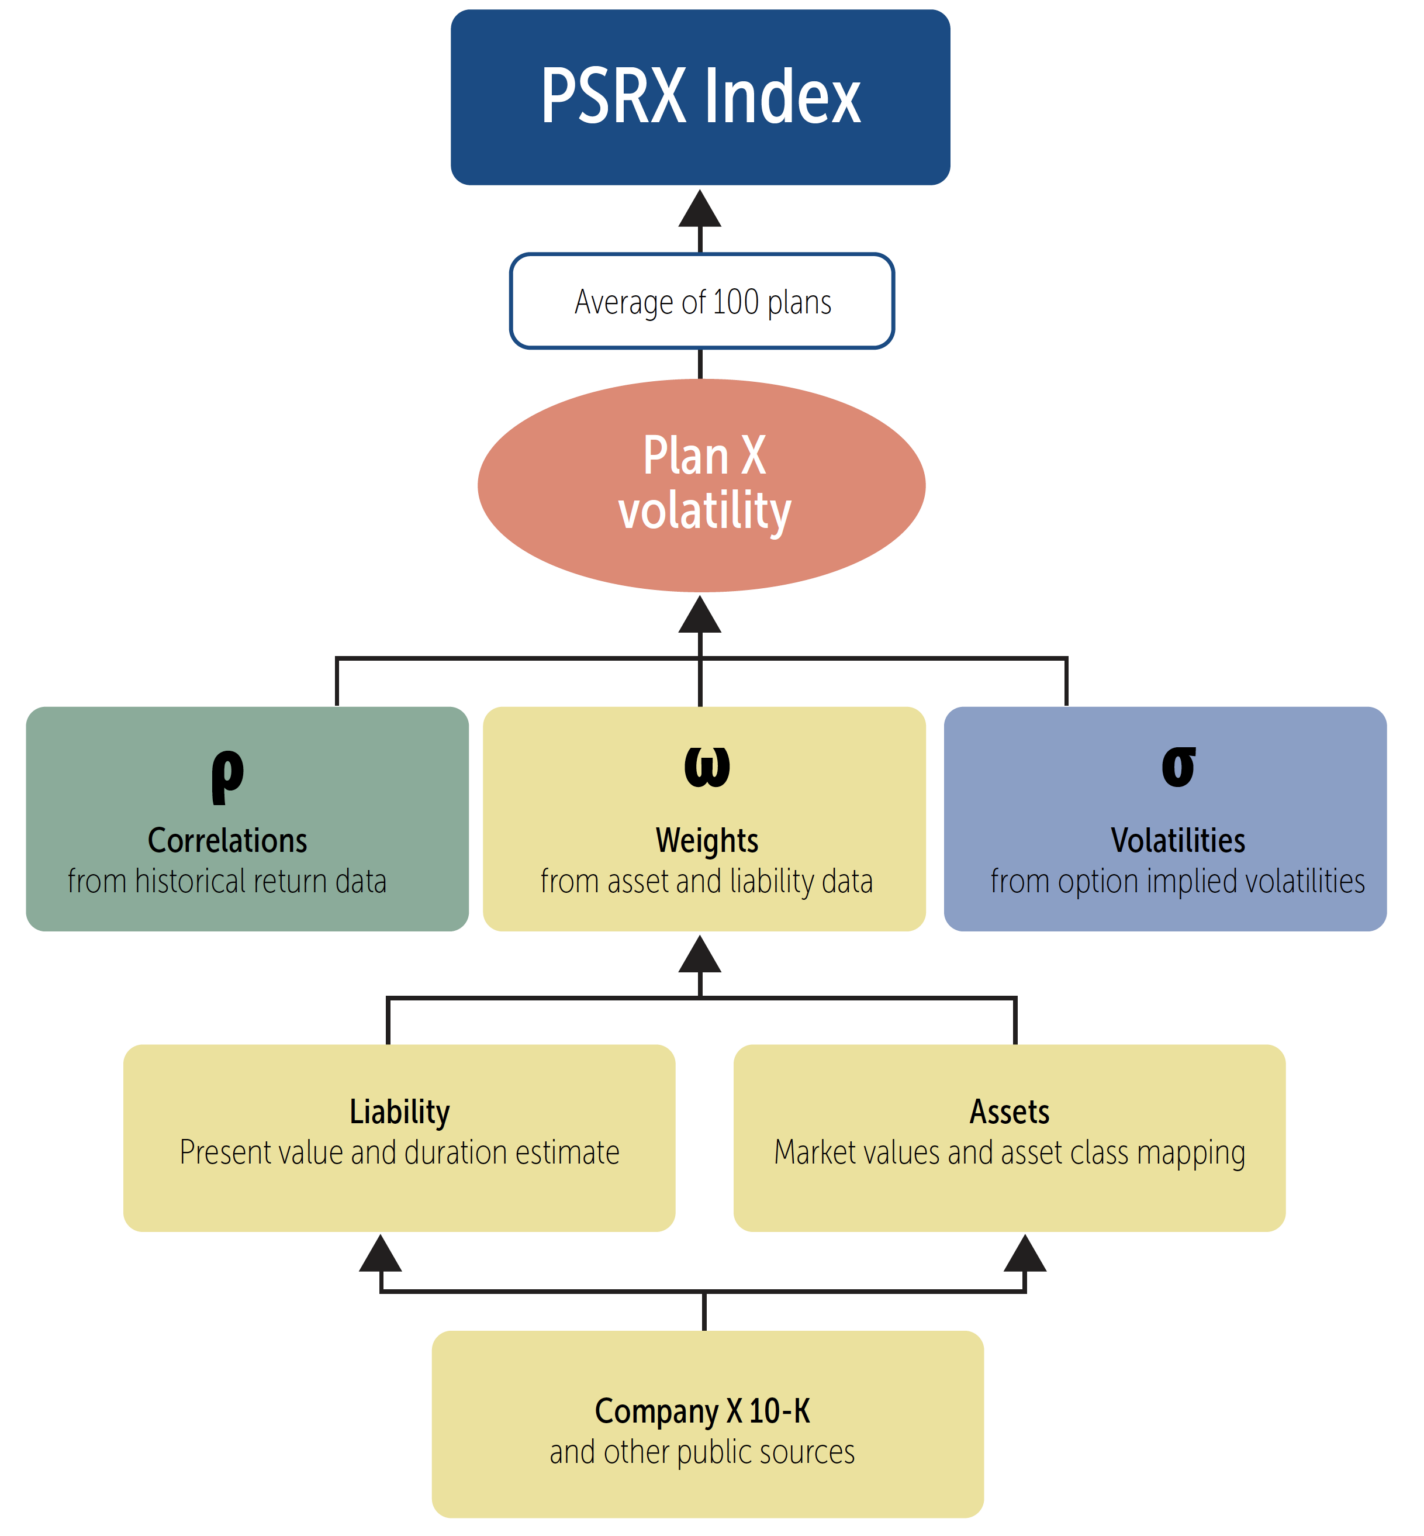
Index constituents are determined annually by NISA and updated with the April 30th index release. Plans with poor data quality are removed from the index. Each monthly index update reflects current implied volatility data from option markets, a “roll forward” of asset and liability figures to reflect market movements year to date, and updated correlation calculations.
Additional details regarding the calculation of the index can be found in the PSRX Guide available on our website.
Relevance of Index
Based on the availability of reliable data, the PSRX inception date is 12/31/2006. The history provides a compelling case for the value of this metric. Over this 5+ year history, the index has ranged from a low of 10.8% (4/30/12) to a high of 21.8% (11/30/08). Remarkably, this history suggests the average surplus volatility of the constituent plans, which doubled during the financial crisis, fell by half in the subsequent year. In 2011 alone, the index saw as much as a 50% increase during a 4 month period (5/31/11-9/30/11).
While asset allocations have changed modestly over the past 5 years, nearly all of this volatility reflected in the PSRX can be attributed to changing market conditions.
The PSRX provides plan sponsors with a useful barometer of the changes in their risk profile, even absent a change in their asset allocation. For example, the increase in the PSRX from 11.2% on May 31 to 16.7% on September 30 in 2011 was caused solely by changes in the market’s estimates of risk. To demonstrate the significance of this change, a plan sponsor would need to have increased their risk asset exposure by 33% on May 31, 2011 to have had a similar change in funded status risk.3
Conclusion
With the introduction of the PSRX, it is NISA’s intent to offer pension stake holders a pension-centric resource derived from multiple market dynamics to illuminate the environment pension plans must navigate. More risk compass than road map, our hope is that the PSRX will assist fiduciaries to act on behalf of their plan with informed foresight rather than react in response to market fluctuations. As plans increasingly align the performance of their assets to that of their liability, taking control of funded status volatility is proving to be a foundation for judicious plan management.
Additional Resources
Additional information is available on our website at www.nisa.com.
Appendix
The chart below shows the history of the PSRX since inception. The 10th & 90th percentile bands help provide a range of pension plan funded status volatility.
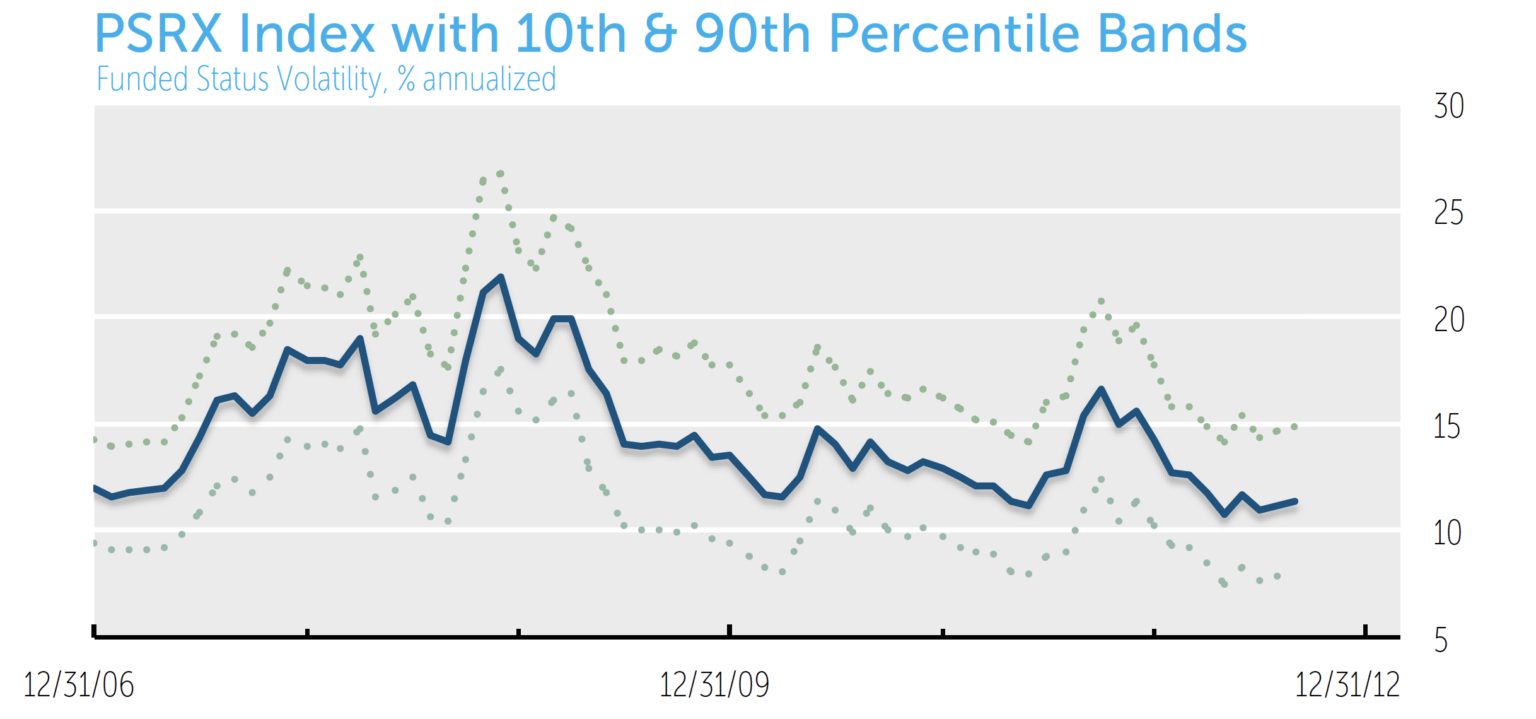
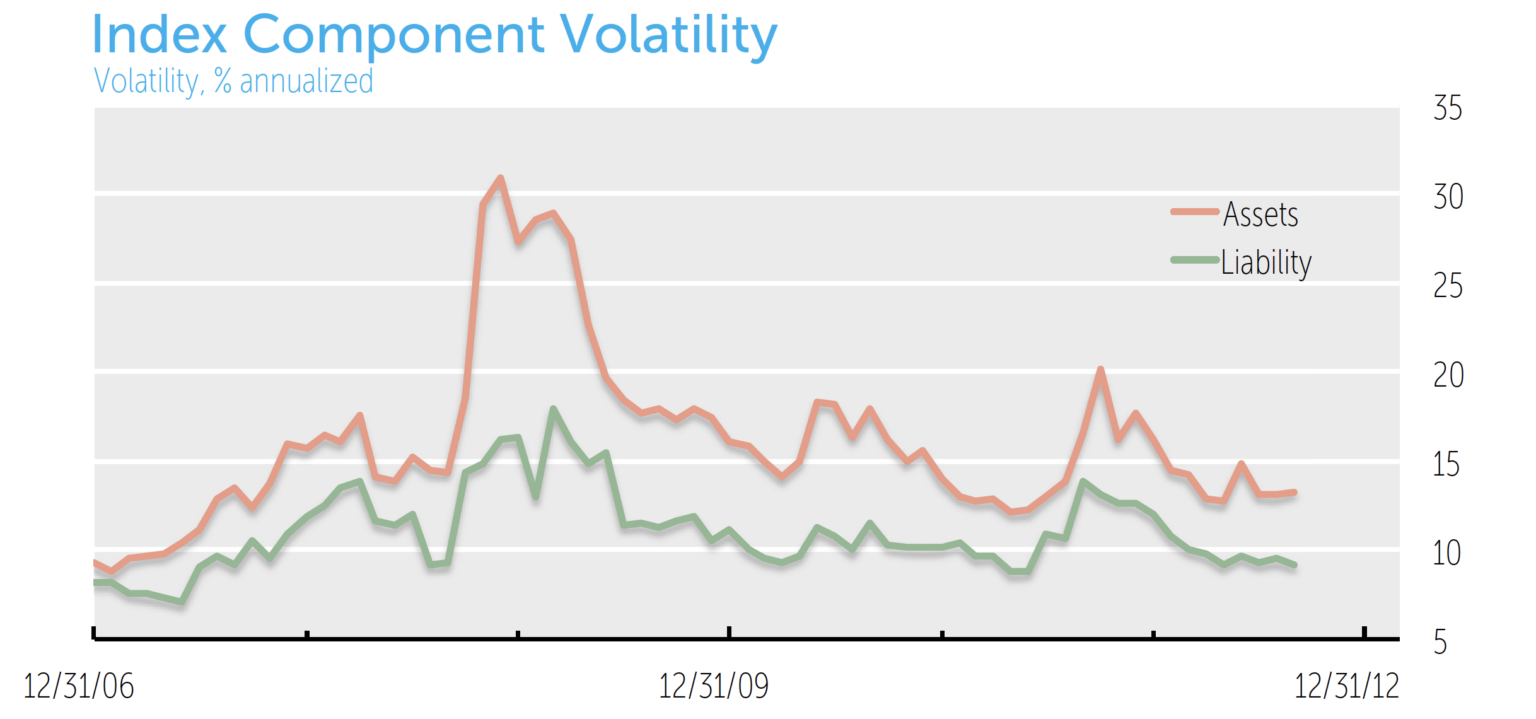
The asset portfolio and the liability volatility are key determinants of the PSRX. The relative level of those components has varied considerably since inception.
* Regarding historical index levels throughout this document, the levels for the PSRX include data for periods prior to when the index was in live production. Historical levels for the index prior to live production in September 2012 are calculated using the same methodology. Past market experience is not necessarily indicative of future market experience.
1. As determined by NISA based on publicly available information.
2. Based on common simplifying assumptions, including normal distributions, approximately zero expected surplus return, etc. Please see the PSRX Guide and www.nisa.com for more detailed descriptions.
3. For a more detailed explanation of evaluating market driven changes in funded status risk, please see “Prospective Funded Status Volatility” available in the Insights section on nisa.com.