Pension de-risking need not be an all-or-nothing decision. In fact, plan fiduciaries may be surprised by the degree to which pension risk profiles can be changed – marginally or materially – through asset allocation decisions and liability-driven investment (LDI) techniques. While annuity buyouts define the end point of the so-called de-risking spectrum, fiduciaries should compare them to other “hibernation” approaches that do not require paying insurance provider premiums, terminating the plan or relinquishing the flexibility to adjust the plan risk profile in the future.
While corporate plan sponsors and plan fiduciaries have lately expressed a common desire to de-risk their pension plans, their definitions of de-risking may vary widely. In some cases, it can simply mean a reduction in risky asset allocations to express a lower risk tolerance and excess return objective. In other contexts, it can mean a prioritization of liability hedging to achieve a systematic reduction in risk and, potentially, a long term goal of divorcing the company fully from the pension plan by means of an insurance product alternative. Given that the average plan’s funded status has fallen to below 80%1, the desire to reduce pension risk is hardly surprising.2
The key question facing a plan fiduciary or sponsor eager to de-risk is how to do it, given the variety of options available. In this paper we attempt to organize these various options and calibrate expectations for risk reduction by placing them on the de-risking spectrum.
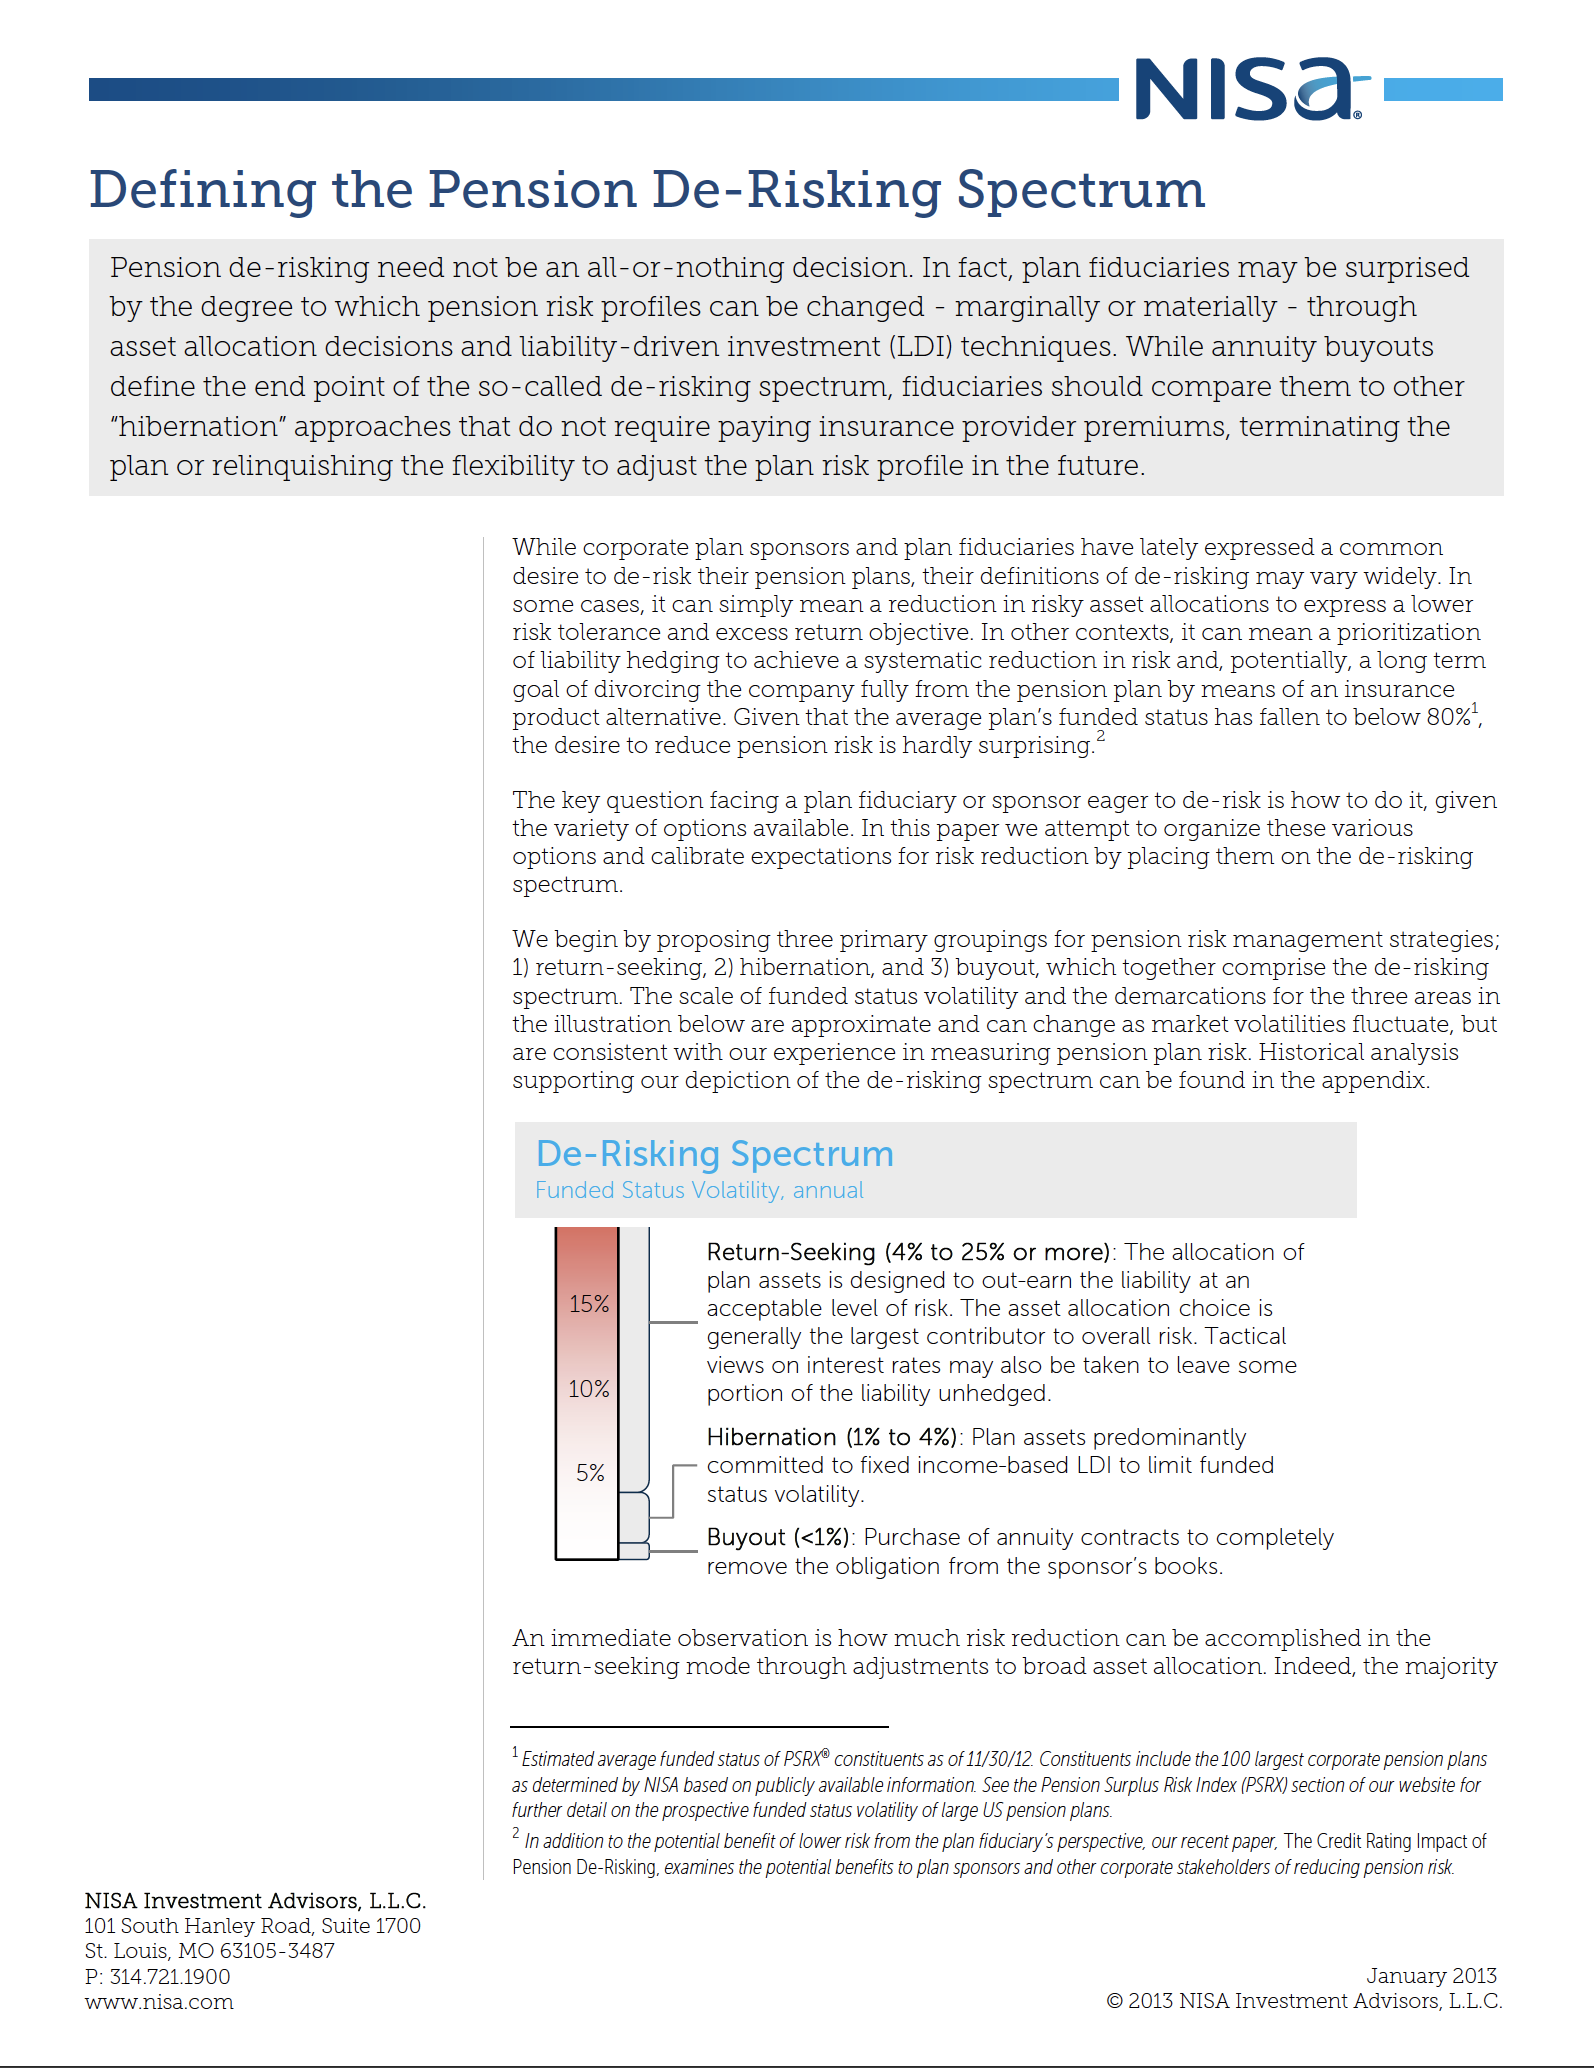
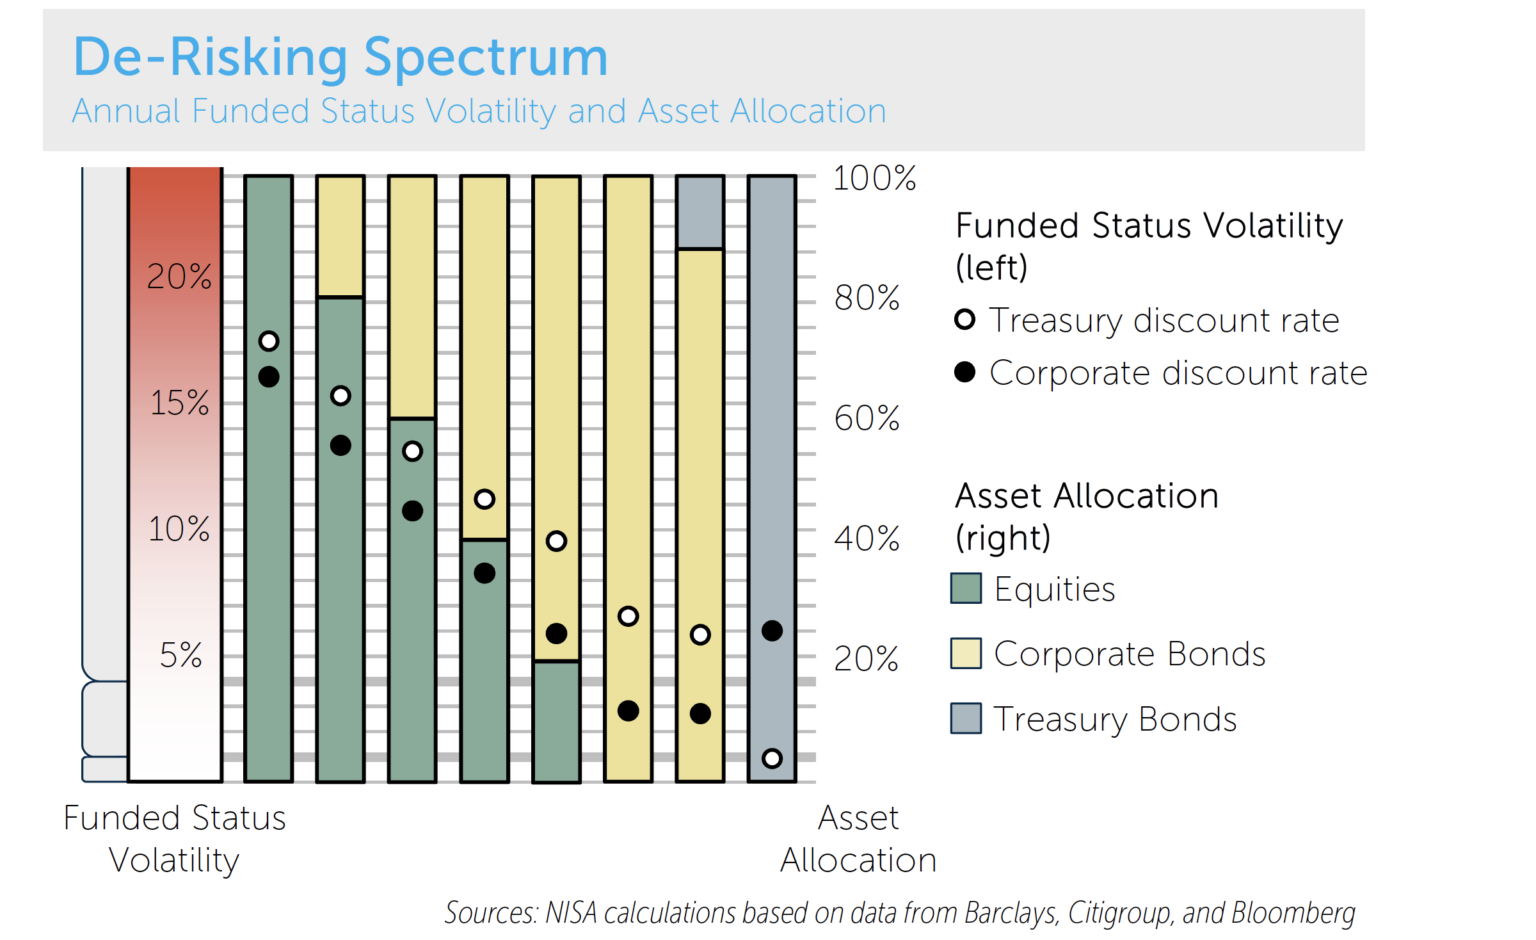
We begin by proposing three primary groupings for pension risk management strategies; 1) return-seeking, 2) hibernation, and 3) buyout, which together comprise the de-risking spectrum. The scale of funded status volatility and the demarcations for the three areas in the illustration below are approximate and can change as market volatilities fluctuate, but are consistent with our experience in measuring pension plan risk. Historical analysis supporting our depiction of the de-risking spectrum can be found in the appendix.
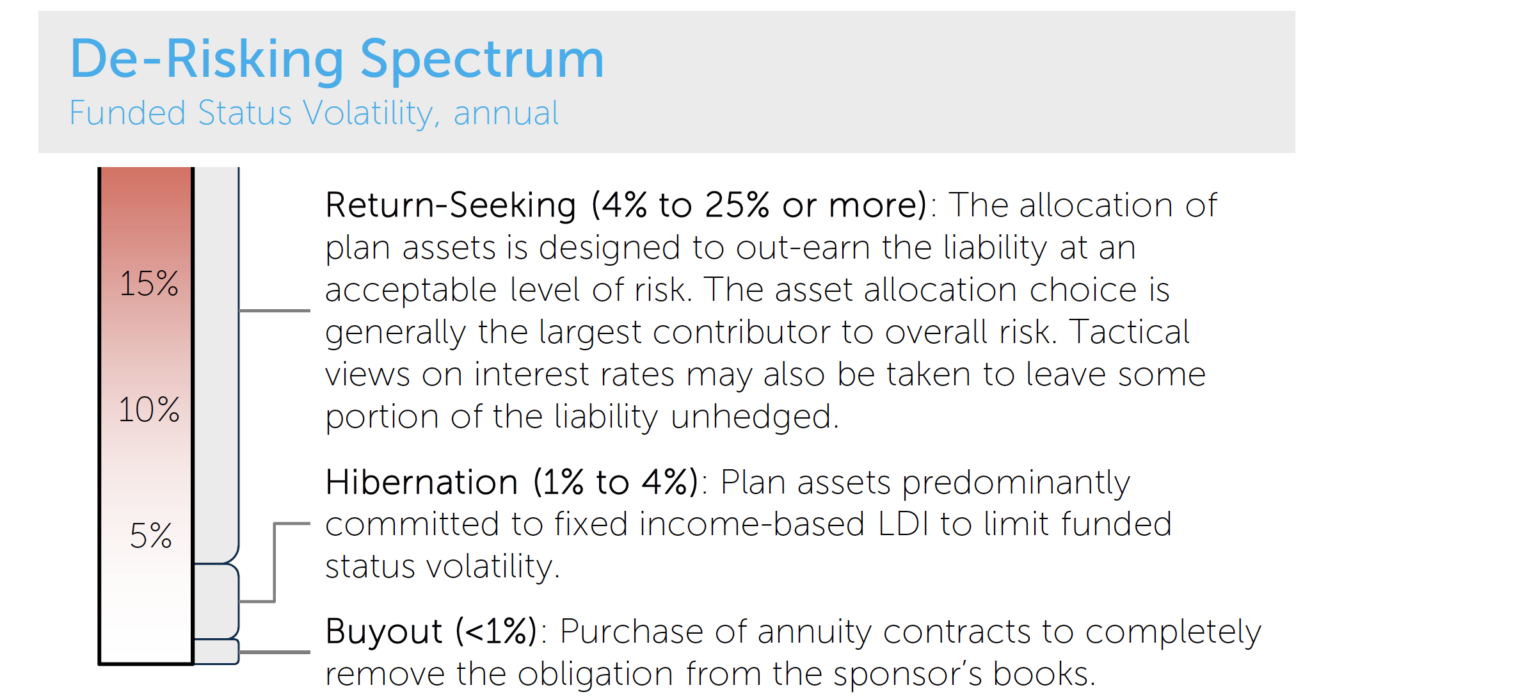
An immediate observation is how much risk reduction can be accomplished in the return-seeking mode through adjustments to broad asset allocation. Indeed, the majority of the spectrum can be targeted through simple reallocation among published benchmarks. As a reference point, we estimate that the ‘typical’ plan has borne a funded status volatility averaging approximately 14% since 2006.3 At the low end of the return-seeking mode, this risk can be reduced to less than 5% by shifting towards liability hedging assets even while retaining a small allocation seeking excess returns.
We now turn to examine each range on the spectrum in some detail.
Return-Seeking
Of the three divisions on the spectrum, the return-seeking mode covers the widest range of risk profiles, demonstrating the power of asset allocation decisions to drive changes to the risk of the plan.
Fiduciaries seeking to make changes to the risk profile of their plan while maintaining a focus on out-earning the liability can do so within the return-seeking mode. The breadth of this range has led some plans to adopt dynamic de-risking (glide path) strategies based on an opportunistic and/or objective-oriented approach to selling risk assets – that is, risk assets are sold as funded status improves.4 The lower end of this range can currently provide a prospective volatility level of roughly 4% annually.
A note of caution: Those plans choosing the return-seeking mode should be aware that changing market conditions – specifically, changes in the market’s expectations of volatility in interest rates or equities – can knock the plan’s prospective risk up or down materially, even assuming the same asset allocation.5
Hibernation
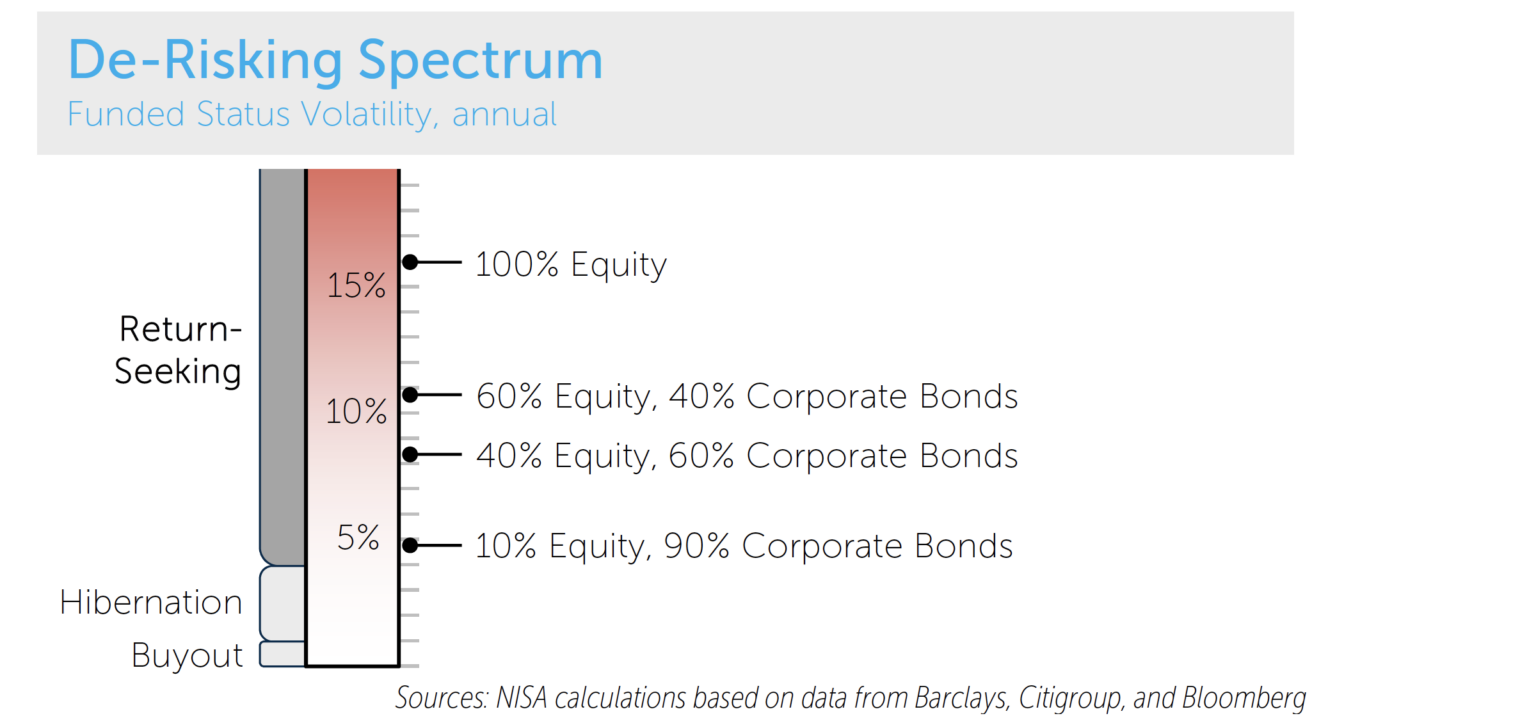
Pushing prospective volatility further into the low single digits can be accomplished with customized fixed income end-game strategies and the commitment of nearly all plan assets towards liability hedging. This “hibernation” mode provides a risk profile that approaches that of a plan termination, without the upfront cost of annuity premiums or other potential negative aspects of a plan termination (e.g., employee relations concerns, loss of flexibility on retirement benefits, etc.). Moreover, large contributions to fully fund the plan are not required. The hibernation illustrations shown below assume the plan remains at 80% funded on a corporate-discount basis.
Reaching the hibernation range of the spectrum requires two key refinements. First, the fixed income portfolio must increasingly mirror the characteristics of the liability. This can be accomplished with customized blends of published fixed income indices that closely match the duration, convexity and yield curve profile of the liability. Alternatively, a direct liability benchmark can be used in an effort to reduce potential inefficiencies or inadequacies of published benchmarks vis-à-vis the liability.
Second, as the strategy approaches the buyout region of the spectrum, the plan must adjust to target a more economic measurement of the liability than is captured by a purely corporate discount curve. In fact, much of the reported tracking error associated with fixed income end-game strategies is due to the non-economic idiosyncrasies of the spread component of common discounting methodologies (e.g., PPA spot or segment curve, Citigroup AA pension discount curve, etc.). Moving to a higher quality discount curve, for example a corporate/Treasury blend, also allows for a fairer comparison to buyout solutions, which are generally assumed to be offered at rates between common corporate discount curves and Treasury curves.
Focusing on the hibernation range of the spectrum above, we see annual volatilities as low as 1%-2% can be targeted with customized fixed income strategies, particularly when shifting to view the liability on a more economic basis. Longevity swaps could allow plans to reach even lower risk levels, though the market for those instruments is still in its infancy in the US.
Choosing a hibernation strategy does not prohibit a future transition to a buyout. In hibernation mode, the modest remaining volatility greatly limits the potential for deterioration in funded status that would make an eventual annuity buyout more costly. In addition, the composition of the hibernation portfolio – investment grade fixed income securities that mirror characteristics of the liability/buyout value – is likely to be a very attractive ”in-kind” portfolio for any eventual insurer that sells annuities to the plan sponsor, potentially improving pricing. Consequently, the hibernation mode can provide a useful staging area because its low risk allows time for 1) a sponsor to consider the merits of and make the necessary contributions for an annuity buyout, and/or 2) the fiduciaries to aggressively shop pricing among insurance providers.
Buyout
For plans wishing to completely eliminate investment and longevity risk, an annuity buyout is likely the only available option. In a buyout, the pension plan contracts with an insurance company to purchase annuities to settle the plan’s liabilities. All investment and longevity risks are transferred to the insurance company. Contingent risks could still remain – for example, litigation risk, or counterparty risk, could become issues in the event of a credit event with the chosen insurer.
Conclusion
The key risk management question currently faced by many pension plan fiduciaries is not whether to de-risk – many have already decided they must – but how to de-risk.
Fiduciaries who want to reduce funded status risk can make significant progress through asset allocation changes within the return-seeking mode, potentially reducing funded status risk to 4%-5% per year. This represents a three-quarters reduction in funded status risk for the typical plan. Hibernation strategies that use customized fixed income solutions can further reduce funded status risk, potentially to as low as 1%-2%. Finally, insurance buyouts can be used by plans seeking to approach the zero barrier of pension risk.
While the delineating lines are approximate, we present the de-risking spectrum to help fiduciaries categorize various approaches to pension risk management and gauge the expected reduction in pension volatility from each. We plan to further expand on the implementation details of each approach in future papers.
Appendix
Assumptions for illustrative plan funded status risk calculations:
- Funded status volatility figures reflect an annual one-standard deviation change in funded status expressed as a percentage of the liability value, and are based on common simplifying assumptions, including normal distributions, zero expected surplus return, etc.
- Funded status volatility figures are based on historical monthly data from 01/31/2000 through 11/30/2012, unless otherwise noted. Funded status volatility is based on investment risk and an annual longevity risk assumption of 0.4% of the liability value. These risks are assumed to be uncorrelated.
- An illustrative liability with a duration of 11 years is used. Liability measures using a corporate rate are based on the Citigroup Pension Discount Curve.
- Equity allocations are based on the S&P 500 Index.
- Corporate bond allocations and custom fixed income blends are based on relevant combinations of Barclays Intermediate and Long Corporate and Treasury indices.
- We assume the illustrative plan is 80% funded based on the Citigroup Pension Discount Curve and assume no additional contributions. Asset allocations in the hibernation range assume interest rate derivatives are available to hedge a portion of the liability.
- “Risk assets” generally refers to assets held with the primary goal of seeking excess returns. Other assets, including assets held with the primary goal of liability hedging, may not be risk-free.
- NISA’s PSRX (typical plan volatilities and funded status levels)
- Barclays index data
- Bloomberg (S&P data)
- Citigroup
Selecting five representative allocations from the chart above, we plot their 2-year rolling volatilities over the last 10 years below.
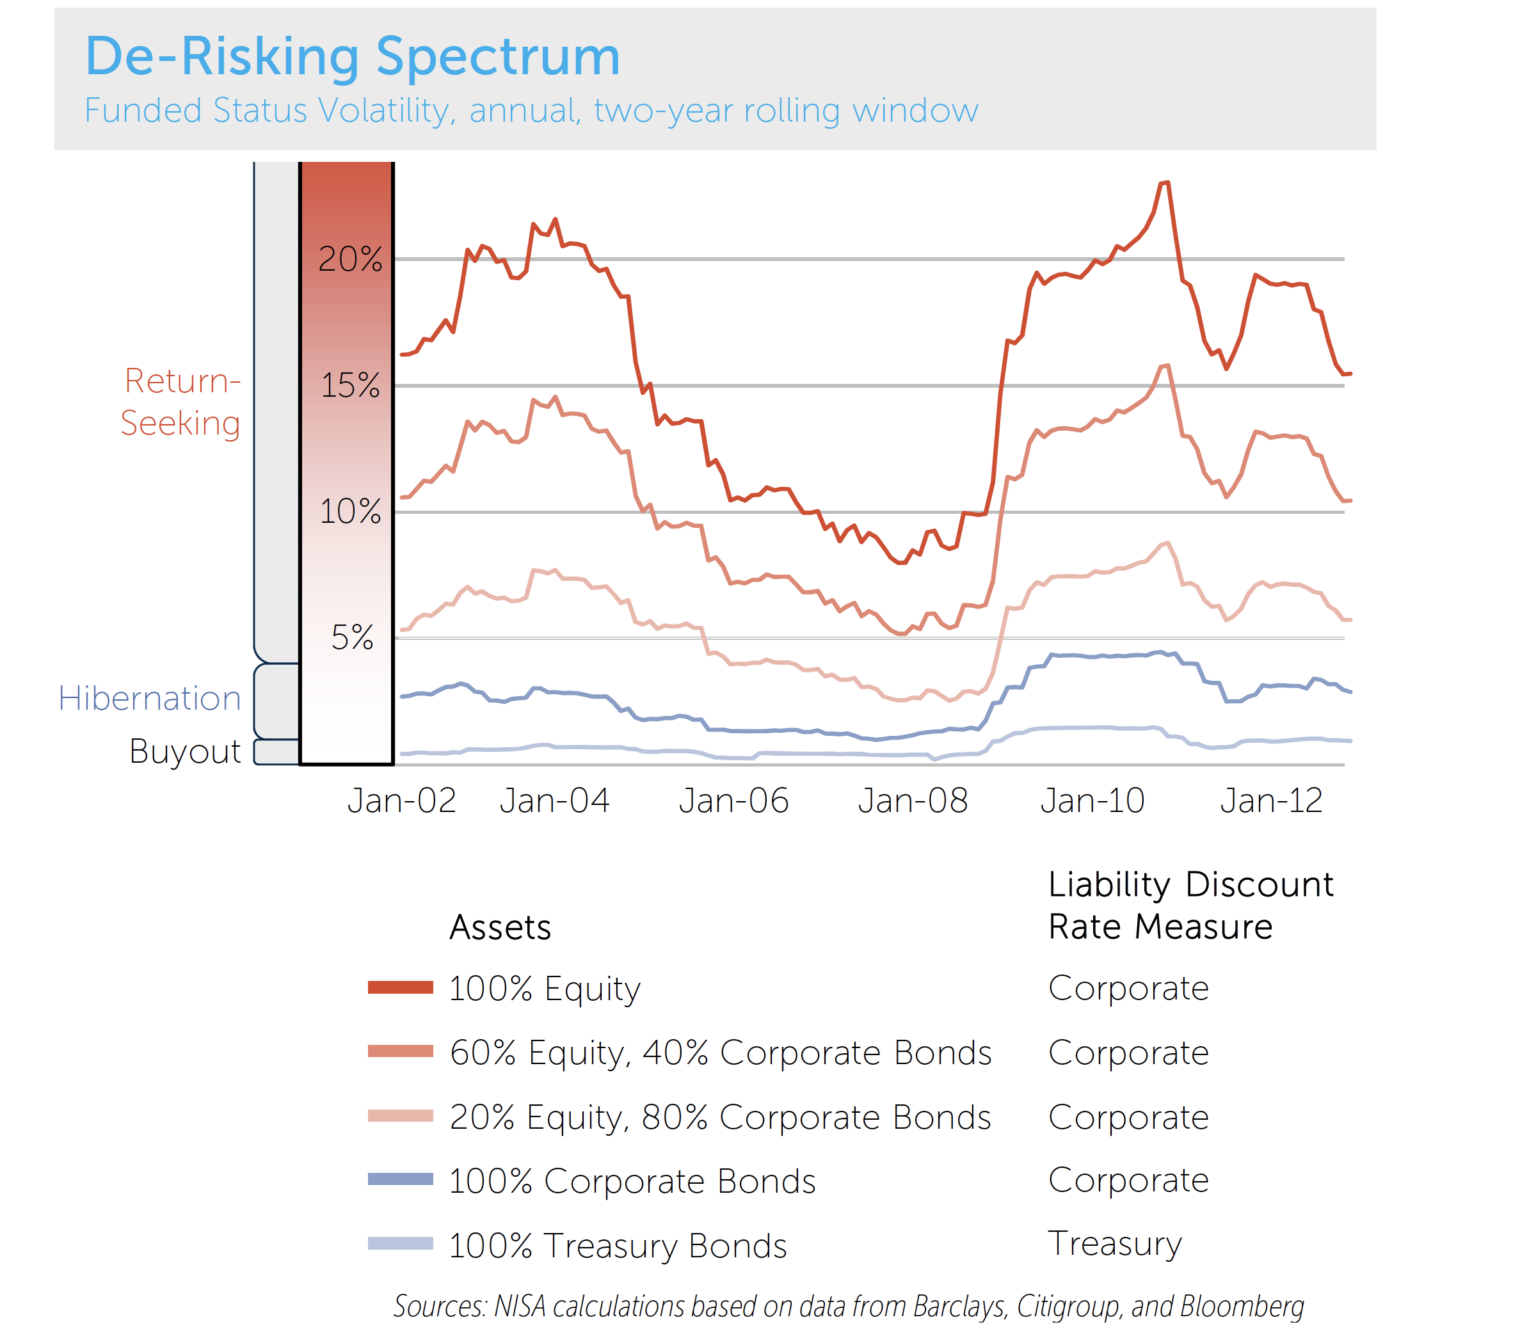
Observations from chart above:
- Observed volatility can vary substantially depending on the time period examined. While this conclusion will surprise no one, it reinforces the point that the ranges defined by the de-risking spectrum are estimates and may not be consistent over time.
- Nonetheless, the volatility of hibernation strategies is considerably more stable than the volatility of return seeking strategies. In other words, the allocations within the hibernation mode also have less uncertainty surrounding their volatility estimate. This is a desirable characteristic for a plan fiduciary seeking a risk-reducing solution in the hibernation range since it implies more reliability in the targeted volatility level.