Synopsis
The primary measure of the health of a pension plan is its funded status, which is the difference between the market value of the assets and the present value of the liability. As such, many plans measure and monitor risk in terms of the volatility of the plan’s funded status, as opposed to the volatility of the assets in isolation. This has implications for the investment strategy. A Liability Driven Investment (“LDI”) strategy measures risk in the context of the asset’s ability to meet future benefit obligations. This article identifies the risk factors that affect pension funded status, describes a framework for managing those risks, and presents considerations for designing a strategy appropriate for your plan.
Introduction
Over the past couple of decades, many sponsors of private defined benefit plans have shifted their focus from volatility of the assets only to volatility of funded status and have designed their asset allocation within an LDI framework. An LDI approach follows conventional modern portfolio theory, but reframes risk in terms of volatility of funded status. As such, “low-risk” assets in an LDI framework have a high correlation with the liability. Importantly, LDI does not imply that a plan necessarily increases the fixed income allocation. Similar to an asset-only framework, risk tolerance and return requirements determine the appropriate blend of “safe” and return-seeking assets. However, an LDI approach does require that plans measure and evaluate performance based on the level and volatility of funded status.
Section 1: Drivers of Liability Risk
An understanding of how a pension liability is valued and factors that can change the liability value are foundational to designing an effective LDI strategy. Actuaries forecast projected benefit payment obligations for a plan based on factors including the plan’s benefit formula, salary and service of plan participants, and forecasts of life expectancy. Those forecasted payments are then discounted to determine the amount needed in today’s dollars to fund the obligations (i.e., the present value of the liability), as illustrated in Exhibit I.
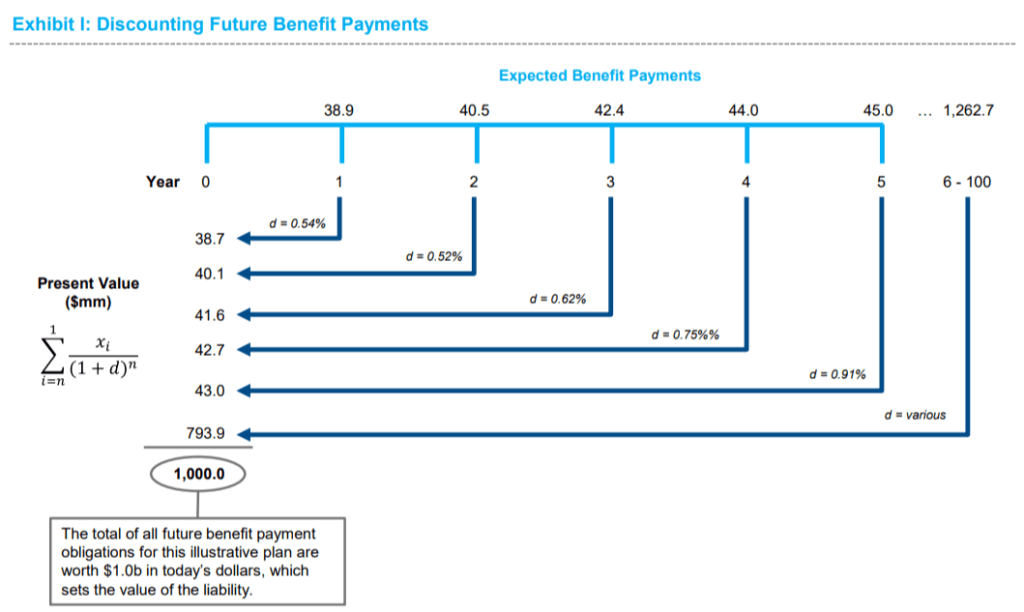
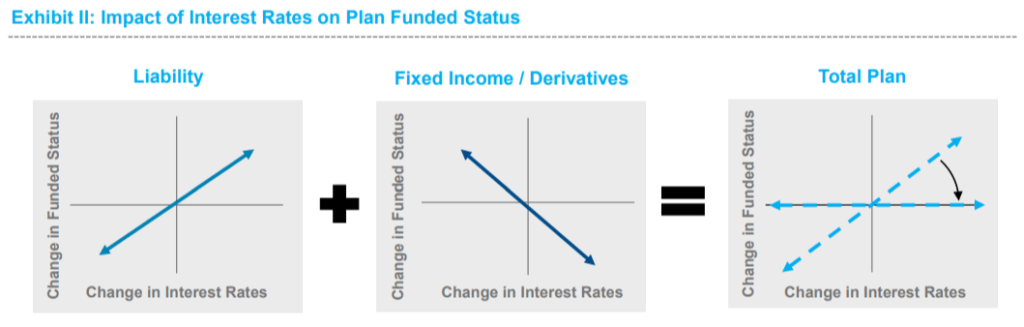
In the same way that the price of a bond moves inversely with its yield (i.e., increases in yield lower the price of a bond and vice versa), the present value of a liability moves inversely with changes in the discount rate. Bonds or interest rate derivatives can offset the interest rate sensitivity of the liability and reduce the interest rate sensitivity of the plan’s funded status.
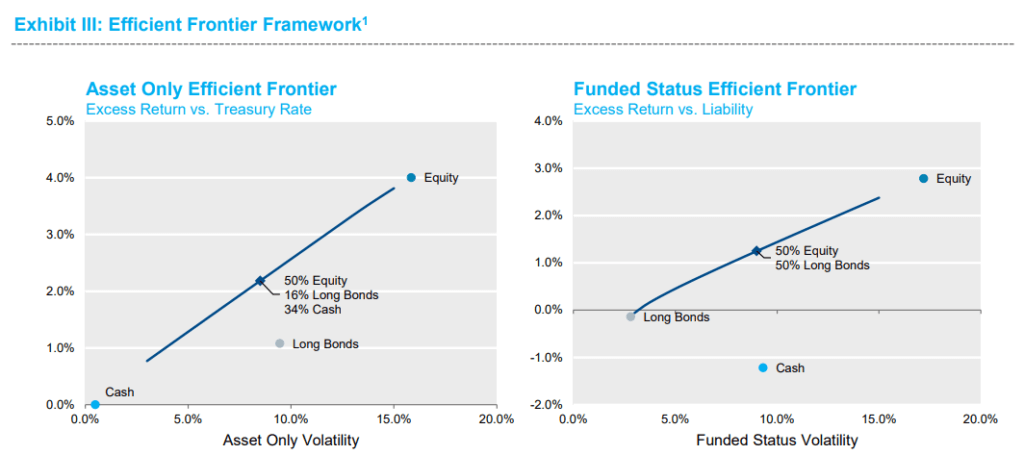
An LDI framework measures risk in terms of funded status volatility, as opposed to asset volatility. Exhibit III illustrates efficient combinations of equity, long bonds, and cash (i.e., allocations that provide the highest level of expected return for a given level of risk). The chart on the left defines risk and return in the context of the assets only, while the chart on the right defines risk and return relative to the liability. As shown, in an asset/liability framework, long bonds, which have exposures similar to the liability, are the lower risk asset class, while cash is inefficient.
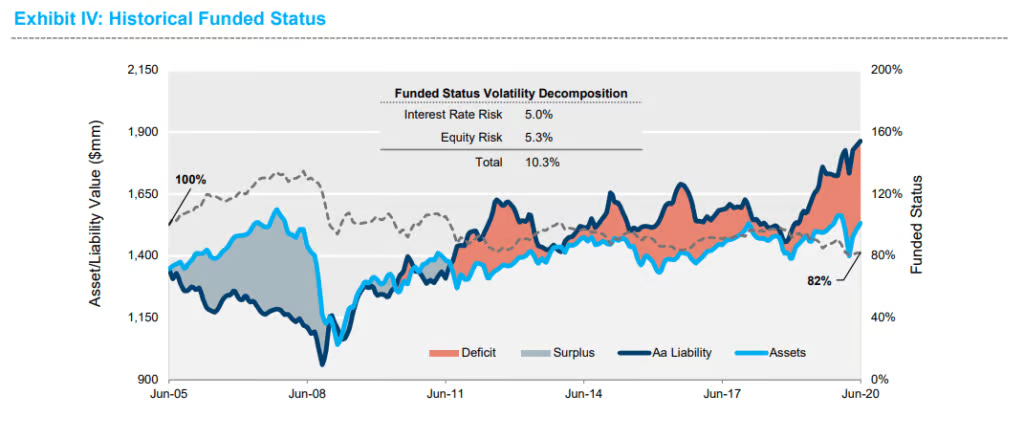
Corporate pension plans have two principal sources of funded status volatility: 1) return-seeking assets risk; and 2) interest rate risk embedded in the liability. LDI seeks to limit the contribution of interest rate risk to funded status volatility, while allowing for exposure to return seeking assets, such as equity, to remain if desired.
Exhibit IV illustrates the historical funded status of an illustrative plan allocated 50% equity, benchmarked to the MSCI ACWI Index, and 50% fixed income, benchmarked to the Bloomberg Barclays Aggregate Index. The analysis covers a 15-year period from June 2005 to June 2020. The plan started at 100% funded and ended the period at 82% funded, as the assets grew by a cumulative 131% and the liability2 grew by 183%. The realized funded status volatility over this period was 10.3%. Standard quantitative risk decomposition calculations attribute the funded status volatility approximately equally between interest rate risk and equity risk.
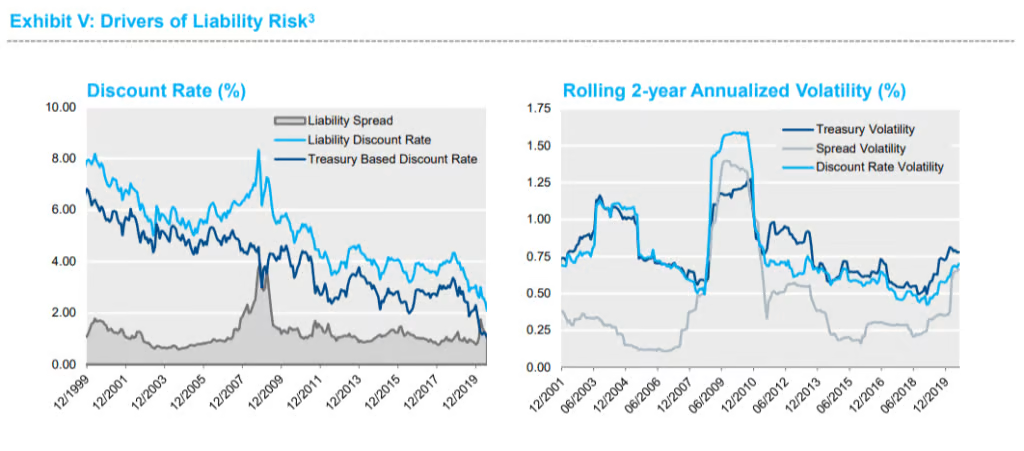
Private defined benefit plans’ discount rates are based on the yields of corporate bonds. Therefore, the reported liability present values are sensitive to changes in both Treasury rates and corporate bond spreads. However, the fact that a liability has equal sensitivity to these risk factors does not imply that they are equal in importance. As shown in Exhibit V, Treasury rate volatility has historically been higher than spread volatility. In fact, over the last 20 years spread volatility only exceeded Treasury rate volatility during the financial crisis from 2008-2009.
Since Treasury rates and spreads have historically been negatively correlated, the volatility of the liability’s discount rate is considerably less than the sum of the volatility of its Treasury rate and spread components. Over the last 20 years, the volatility of the Treasury rate and spread components of the illustrative liability’s discount rate has averaged 0.79% and 0.54%, respectively, while the volatility of the discount rate has averaged 0.81%.
Given the instruments available in the market, plans may face a trade off between 1) hedging more of their liability’s Treasury rate risk, but not addressing the hedge of the liability’s spread risk; or 2) increasing the hedge of the liability’s spread risk, but settling for lower hedge of the liability’s Treasury rate risk than may otherwise be achievable. In this circumstance, choosing option #1 will usually lead to lower funded status volatility.
Section 2: Pension Risk Management
A common criticism of LDI is that reducing interest rate risk requires selling equities to buy fixed income and thereby reducing expected return. This need not be the case. In this section, we will walk through possible actions plan sponsors can take to reduce interest rate risk without reducing expected return. We will describe these actions by profiling an illustrative plan assumed to be 85% funded and allocated 50% equity (MSCI ACWI Index) and 50% fixed
income (Bloomberg Barclays Aggregate Index).
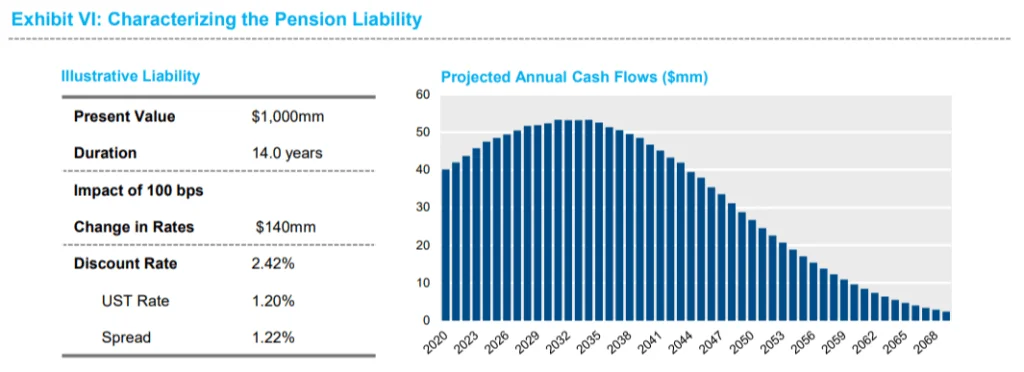
The design of an LDI strategy starts with understanding and quantifying the interest risk embedded in the pension liability. The liability profiled in this section has a present value of $1 billion and duration of 14 years, meaning that for a 1% change in the discount rate, the liability value will change by approximately 14%, or $140 million. For context, this interest rate exposure is economically equivalent to a $542 million short position in 30-year Treasury bonds. The discount rate of 2.42% can be decomposed into a 1.20% Treasury rate and a corporate spread of 1.22%.
Current Liability Hedge
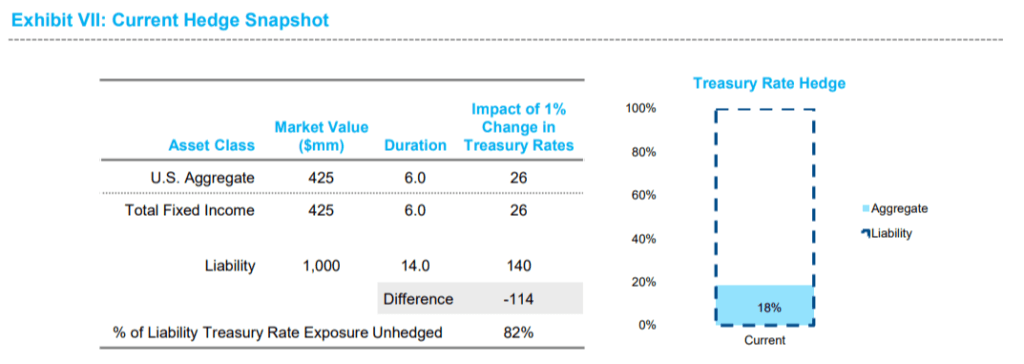
Exhibit VII illustrates the current hedge of the liability’s Treasury rate exposure. A 100 bps change in rates would cause the allocation to the Aggregate Index to change by $26 million (calculated as market value * duration / 100), which is 18% of the liability’s sensitivity to 100 bps change in rate. In other words, $114 million, or 82%, of the liability’s rate exposure is unhedged. Therefore, all else equal, a 1% decrease (increase) in interest rates would cause the funded status of this plan to decline (increase) by approximately $114 million or 11%.4
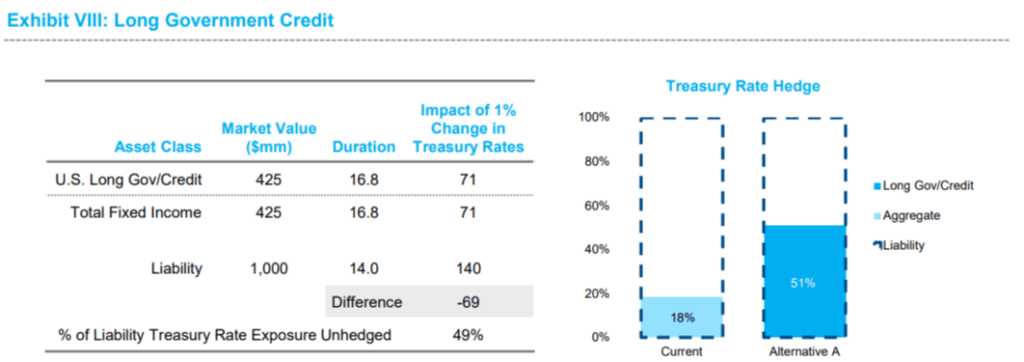
Alternative A: Increasing the Hedge with Long Duration Fixed Income
The gap in interest rate sensitivity between the current portfolio and the liability could be reduced by lengthening the duration of the fixed income. Instead of allocating the fixed income assets to the Bloomberg Barclays Aggregate index, the plan may choose to allocate to the Bloomberg Barclays Long Government Credit index, a flagship index that represents the market for all government and investment grade credit bonds with maturities of 10 years or longer. This reallocation would increase the liability interest rate hedge percentage to 51% and the exposure of the plan’s funded status to a 1% change in rates would fall to $69 million. Note that the higher hedge percentage was achieved without increasing the size of the fixed income allocation which remains at $425 million.
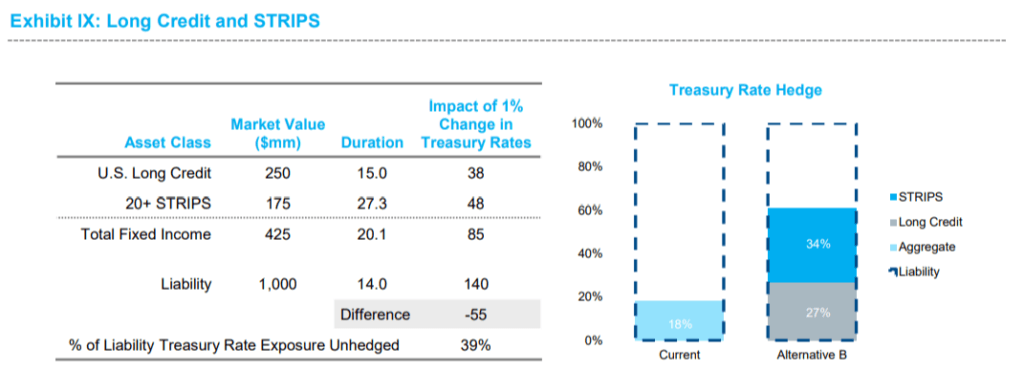
Alternative B: Increasing the Hedge with STRIPS
The Long Government Credit index is comprised of ~60% Long Credit and ~40% Long Government securities. The plan could further reduce the gap in interest rate sensitivity versus the liability by incorporating 20+ STRIPS in place of the Long Government allocation. STRIPS (Separately Traded Registered Interest and Principal of Securities) are securities that are created through the process of decomposing (i.e., stripping) Treasury bonds into their individual coupon and principal cash flows. Long dated STRIPS provide the most interest rate sensitivity per dollar invested available in the physical securities market and, therefore, are a very capital efficient asset class for hedging a liability. The Bloomberg Barclays 20+ STRIPS index represents the market for STRIPS with maturities of 20 years or longer. By utilizing 20+ STRIPS in place of the Long Government component, the liability hedge percentage increases to 61% and the exposure of the plan’s funded status to a 1% change in rates falls to $55 million.
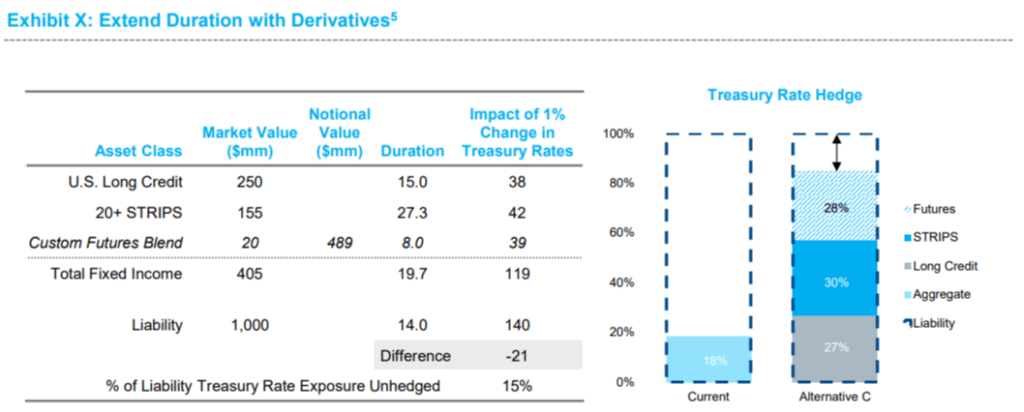
Alternative C: Increasing the Hedge with an Overlay of Interest Rate Derivatives
If this plan desires to further reduce the gap in interest rate sensitivity between the assets and liability it faces two choices: 1) change the asset allocation by reducing the amount of return seeking assets; or 2) add interest rate derivatives, which can be used to increase (or decrease) the liability hedge percentage as desired. While the first choice would certainly have an impact on the expected return on assets (“EROA”), it is our understanding from clients that auditors generally are willing to acknowledge the second choice as EROA neutral.
As illustrated in Exhibit X, Alternative C adds a blend of Treasury futures to the allocation profiled in Alternative B to increase the liability hedge percentage to 85%. Additionally, $20 million has been liquidated from the STRIPS account and transferred as cash to the futures account. This cash provides daily variation margin for the futures
portfolio and is sufficient to cover a 0.50% increase in rates. If cash variation margin coverage runs low, additional STRIPS can be liquidated and the futures allocation can be adjusted to maintain the target interest rate hedge percentage. The futures clearinghouse also requires customers to post initial margin at inception. Conveniently, this
requirement can be met with Treasury securities (as opposed to only cash), so the STRIPS can serve as a source of initial margin without disrupting the hedge.
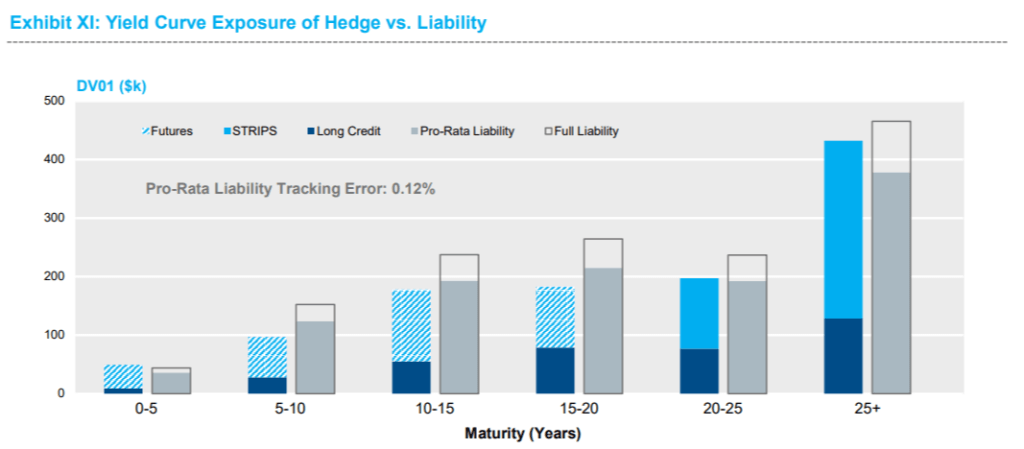
The blend of futures contracts is chosen to minimize differences between the cashflow profile of the hedge assets and liability, as shown in Exhibit XI. The STRIPS allocation is comprised of securities with maturities of 20 years and longer. Therefore, the futures are allocated to contracts that have underlying cashflows with less than 20 years to maturity in order to more evenly distribute the hedge across the liability’s cashflow horizon. While the cashflow profile of the hedge assets does not perfectly match the liability, tracking error from the difference in yield curve exposure versus the pro-rata liability is expected to be small (12 bps).
Section 3: Hedging the Spread Exposure of the Liability
While Treasury rate risk has historically been a larger driver of funded status volatility, it may be desirable to also measure and manage spread risk. Treasury rate risk can be estimated and hedged with a high degree of precision; however, spread risk is more challenging due to: 1) differences between the universe of bonds used to construct the
liability discount curve and the very desirable objective of a well-diversified investment-grade corporate bond portfolio; 2) discount curve construction techniques; and 3) downgrades and defaults. It is important to note that other assets in the pension plan (e.g., public equity, private equity, high yield, etc.) can have a strong correlation with spread movements and, therefore, contribute to a hedge of the spread component of the liability. In our opinion, these same asset classes do not contribute to the Treasury rate hedge in a reliable manner.
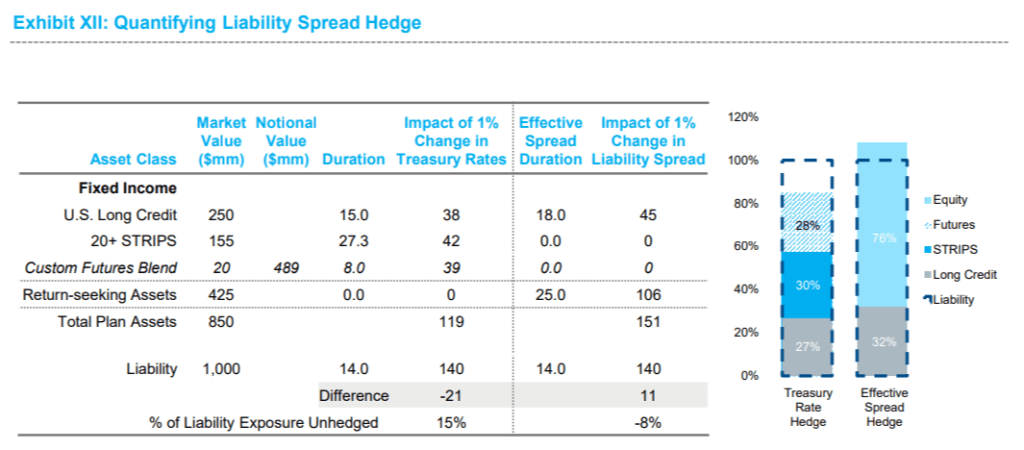
Measuring the Liability Spread Hedge
Quantitative regression techniques can be utilized to estimate assets’ sensitivity to changes in the spread of the liability (i.e., the effective spread duration (“ESD”) of the assets). The table shown in Exhibit XII expands on Exhibit X by quantifying the amount of the liability’s spread exposure that is hedged by the assets. Note within the Fixed Income assets section that the ESD of the Long Credit Index is higher than the duration of the index by a factor of 1.2 (i.e., 18 / 15 = 1.2), indicating that for a 1% change in the spread of the liability, the Long Credit spread changes by 1.2% on average. This is primarily due to the fact that the universe of bonds used to construct the liability discount curve has an average credit quality of A2/Aa, while the average credit quality of the Long Credit index is considerably lower at A3/ Baa1, and therefore has higher spread volatility. The allocation to Long Credit hedges 27% of the liability’s exposure to Treasury rates, but it hedges 30% of the liability exposure to changes in credit spreads.
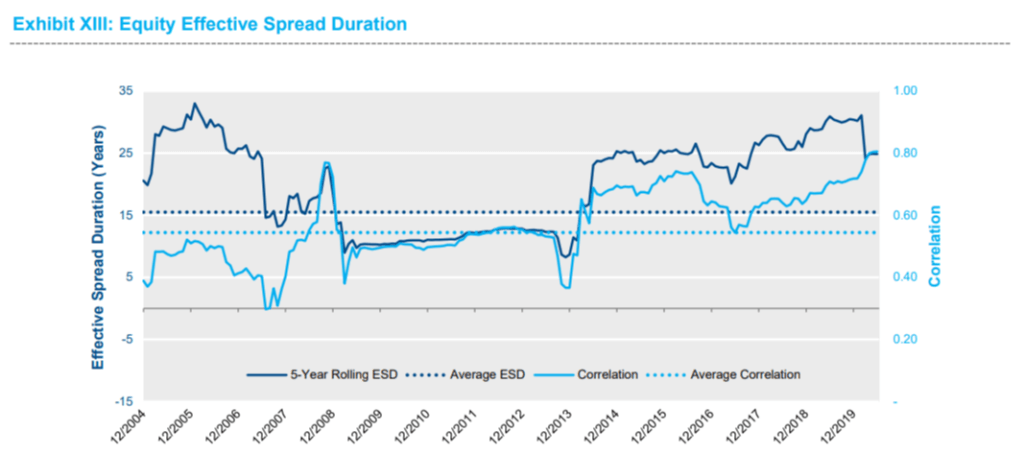
Equity Effective Spread Duration
It is important to consider the relationship between equity (and other return-seeking assets) and spreads when quantifying the hedge of the liability’s spread component. Empirically, on average equity markets have performed well when credit spreads have tightened and vice versa. The chart in Exhibit XIII illustrates the effective spread duration of the MSCI ACWI Index based on a rolling 5-year regression between the index returns and spread changes of the illustrative liability. Over this horizon the ESD has averaged 15.5 years, but has fluctuated in a range from 8 to 33 years. The correlation between equity and the liability spread changes has averaged 0.54, but has risen recently to 0.80.
Turning back to Exhibit XII, when including the return-seeking assets allocation, the total hedge percentage of the liability spread component is 108%. This indicates that if the spread of the liability were to widen by 100 bps, funded status is expected to decrease as the plan assets are expected to decline by $11 million more than the liability, with an acknowledgment that there is a material error bound around this estimate (a two standard deviation error bound is +$13 million to -$35 million).
It is important to note that this sensitivity is based on empirical estimates of each asset class’s sensitivity to changes in the liability’s spread. The relationship between spread changes of the liability and Long Credit is fairly tight (correlation = 0.9), but the relationship between spread changes of the liability and equity returns is noisy (correlation = 0.5).
Section 4: Glidepath Design
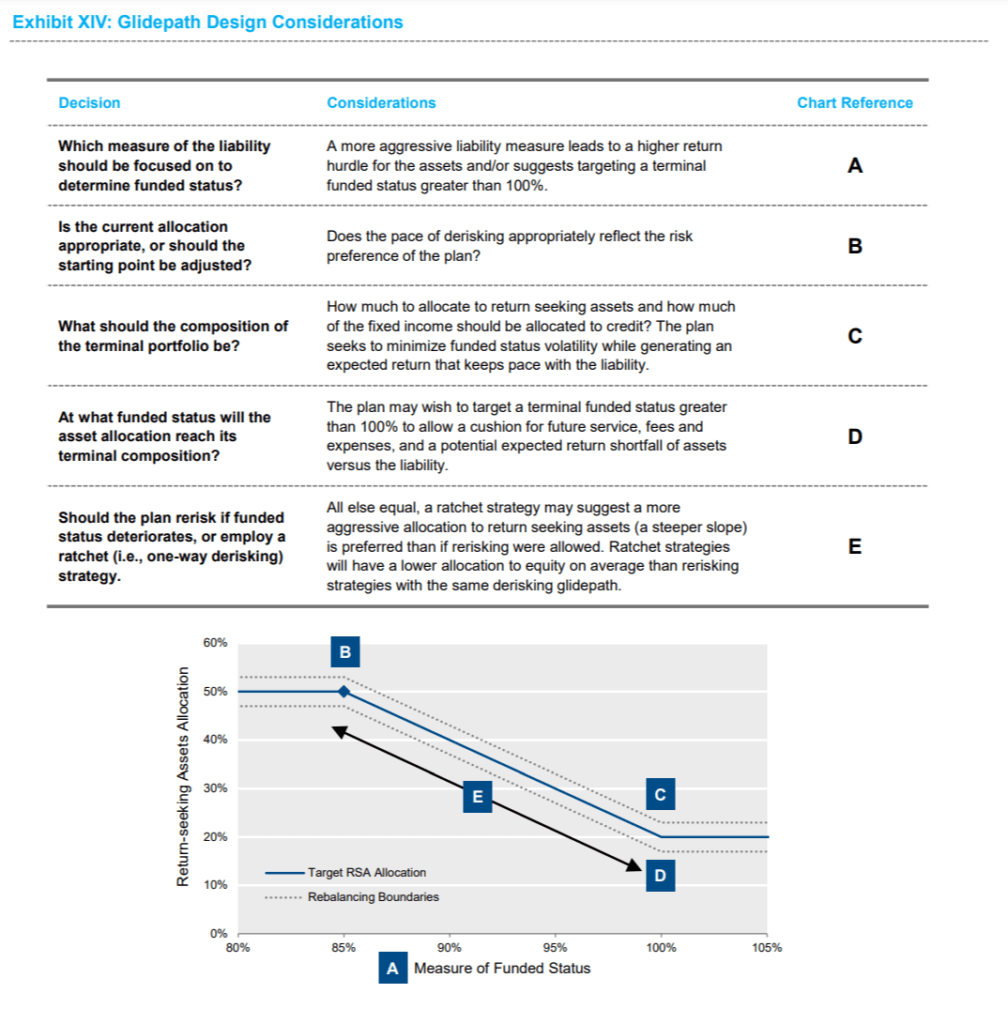
Many plan sponsors follow a glidepath approach to managing their asset allocation, which derisks as funded status improves by shifting assets from return seeking to liability hedging. This strategy recognizes the asymmetric risk profile associated with a pension surplus – depletion of the surplus can lead to additional required contributions, but an increase in the surplus may have little value to the sponsor or plan participants. While conceptually simple, implementation of a derisking glidepath requires plan sponsors to make several decisions. Exhibit XIV summarizes some of these decisions and details a possible glidepath for the illustrative plan detailed in the previous section. Recall the plan is 85% funded based on an accounting liability discounted at the FTSE Pension Discount curve and currently allocates assets 50/50 return seeking/liability hedging. The terminal allocation for the plan is 20% return-seeking assets/80% liability hedging assets and will be reached when the plan is 100% funded.
As plans move down their derisking glidepath, it is important to consider the appropriate blend of Treasuries and credit within the liability hedging allocation. As we described previously, when plans have a significant allocation to return seeking assets, they have less need for credit fixed income as the return-seeking assets hedge much of the liability’s spread exposure. However, as return-seeking assets are reduced, the credit allocation may need to increase to replace the lost effective equity spread duration.
Plans must also consider the expected return impact associated with the credit allocation decision. Plans may reasonably choose a credit allocation that does not minimize funded status volatility if the expected return pickup justifies the additional risk.
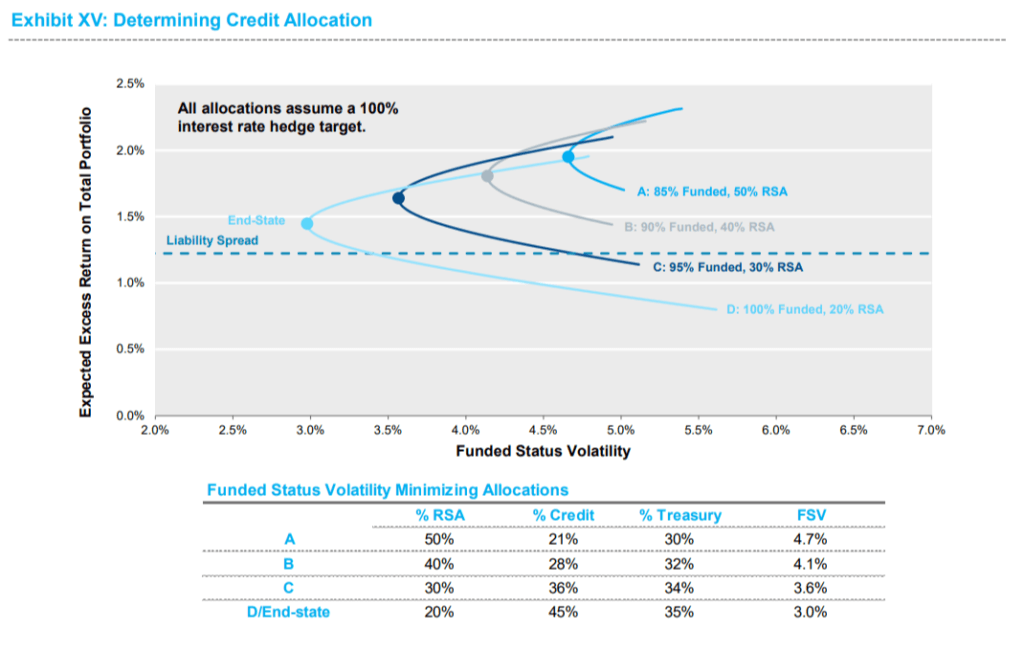
Exhibit XV provides a framework for determining the appropriate blend of credit versus Treasuries across the glidepath. Each curve on the chart represents a point on the plan’s derisking glidepath. The curve indicates the funded status volatility and expected excess return for varying blends of Treasuries and credit within the fixed income allocation. The top point of each curve represents a fixed income allocation that is comprised entirely of credit, while the bottom point on each curve represents a fixed income allocation that is comprised entirely of Treasuries. The
allocation to return-seeking assets is held constant across each distinct curve.
The table at the bottom of Exhibit XV provides the allocations for the funded status volatility minimizing point on each curve. With 50% in return-seeking assets, funded status volatility is minimized by allocating the fixed income 20% credit and 30% Treasuries. However, the curve is relatively steep, indicating that plans can increase expected return by allocating more to credit without significantly increasing funded status volatility.
As the plan moves down the derisking glidepath, the funded status volatility minimizing allocation to credit increases as less equity is available to hedge the liability’s spread exposure. The end-state allocation (20% return-seeking assets, 45% credit, 35% Treasuries) is expected to outpace the liability by 25 bps annually.
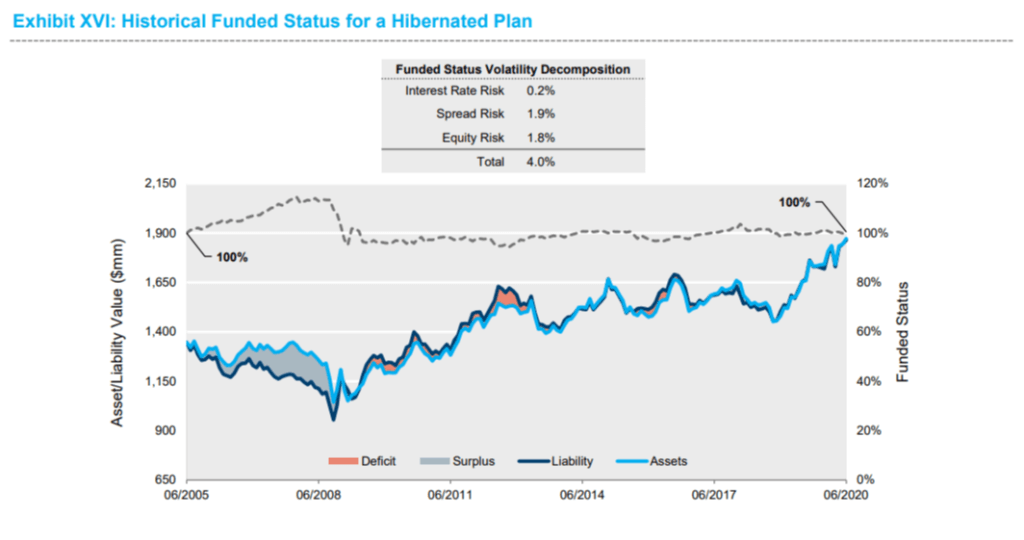
Recall in Section 1 we illustrated the historical funded status of a plan allocated 50% equity/ 50% fixed income (refer to Exhibit IV). Over the 15 years ended June 30, 2020, this plan would have lost 18% in funded status and experienced 10.3% funded status volatility. Exhibit XVI compares how this plan would have performed if, alternatively, assets were allocated in accordance with the end-state shown above, which has a 20% allocation to return-seeking assets and follows an LDI approach to target a 100% hedge of the liability’s interest rate risk. This illustrative plan would have ended the period at 100% funded and experienced 4% funded status volatility. The funded status volatility can be attributed almost equally between the risk associated with the remaining equity allocation and liability spread risk. Unsurprisingly, Treasury rate risk is nearly eliminated for this plan. Plans that have reached the end of their derisking glidepath are often
referred to as “hibernated” plans, eluding to the plans relatively high degree of funded status certainty.
Section 5: Looking Ahead
The striking growth in LDI over the past couple of decades has been driven by a variety of factors including accounting changes, regulatory changes, market crashes, and freezing of defined benefit plans. Increasingly, plan sponsors look for ways to reduce funded status volatility, while continuing to partially count on the market to reduce deficits. A well-designed LDI strategy can help seek to achieve these objectives. As previously discussed, LDI strategies run a continuum from simply extending the duration of the current fixed income allocation to fully bespoke strategies tailored to the liability’s unique cashflow profile and risk exposures. At this time, most plans have already taken initial derisking
steps and are at a point where increased customization may be required to increase the efficacy of the hedge.
As the demand for LDI has grown, the market has responded with improved strategies and tools to help sponsors better manage the complexities associated with implementing and monitoring a derisking program in changing market environments. The evolution of LDI is certain to continue as more plans reach the end of their derisking glidepath and look for opportunities to remove the last remaining risks embedded in their plan.
Disclosure Information
By accepting this material, you acknowledge, understand and accept the following:
This material has been prepared by NISA Investment Advisors, LLC (“NISA”). This material is subject to change without notice. This document is for information and illustrative purposes only. It is not, and should not be regarded as “investment advice” or as a “recommendation” regarding a course of action, including without limitation as those terms are used in any applicable law or regulation. This information is provided with the understanding that with respect to the material provided herein (i) NISA is not acting in a fiduciary or advisory capacity under any contract with you, or any applicable law or regulation, (ii) that you will make your own independent decision with respect to any course of action in connection herewith, as to whether such course of action is appropriate or proper based on your own judgment and your specific circumstances and objectives, (iii) that you are capable of understanding and assessing the merits of a course of action and evaluating investment risks independently, and (iv) to the extent you are acting with respect to an ERISA plan, you are deemed to represent to NISA that you qualify and shall be treated as an independent fiduciary for purposes of applicable regulation. NISA does not purport to and does not, in any fashion, provide tax, accounting, actuarial, recordkeeping, legal, broker/dealer or any related services. You should consult your advisors with respect to these areas and the material presented herein. You may not rely on the material contained herein. NISA shall not have any liability for any damages of any kind whatsoever relating to this material. No part of this document may be reproduced in any manner, in whole or in part, without the written permission of NISA except for your internal use. This material is being provided to you at no cost and any fees paid by you to NISA are solely for the provision of investment management services pursuant to a written agreement. All of the foregoing statements apply regardless of (i) whether you now currently or may in the future become a client of NISA and (ii) the terms contained in any applicable investment management agreement or similar contract between you and NISA.
MSCI All Country World Index (ACWI): Represents market for large and mid-cap publicly traded stocks in 23 developed and 27 emerging market countries.
Bloomberg Barclays Long Credit A+ Index: Represents the market for U.S. investment-grade credit bond with maturities of 10 years or longer and credit rating of A or higher.
Bloomberg Barclays Intermediate Credit A+ Index: Represents the market for U.S. investment-grade credit bond with maturities of 1 to 10 years and credit rating of A or higher.
Bloomberg Barclays U.S. Aggregate Index: Broadly represents the entire U.S. investment-grade bond market.
Bloomberg Barclays Long Government Credit Index: Represents the market for U.S. government and investment grade credit bonds with maturities of 10 years or longer.
Bloomberg Barclays Long Credit Index: Represents the market for U.S. investment-grade credit bond with maturities of 10 years or longer.
Bloomberg Barclays 20+ STRIPS: Represents the market for STRIPS with maturities of 20 years or longer.
1 Calculations are based on historical data from 6/30/2005-6/30/2020. “Equity” = MSCI ACWI Index, “Cash” = Bloomberg Barclays 1-3 Month T-bills Index, “Long Bonds” = blend of Bloomberg Barclays Long A+ Index and Bloomberg Barclays Intermediate A+ Index that is duration neutral to an illustrative liability. The illustrative liability is discounted at the FTSE Pension Discount curve and had a duration of 14 years as of 6/30/2020. Excess return assumptions are 400 bps for equity, 75% of index OAS as of 6/30/2020 for fixed income, and spread of the liability discount rate for the liability A 15-year history was chosen as representative of a full market cycle, inclusive of the financial crisis of 2008-2009.
2 Throughout this paper the illustrative liability is discounted at the FTSE Pension Discount curve and has a duration of 14 years as of 6/30/2020.
3 Rates shown reflect the average discount rate (i.e., IRR) of an illustrative liability discounted at the FTSE Pension Discount Curve and the FTSE STRIPS Curve. The spread is the difference between the average discount rate (i.e., IRR) of the illustrative liability discounted at the FTSE Pension Discount Curve and the FTSE STRIPS curve. This liability had a 14-year duration when discounted at the FTSE Pension Discount Curve as of 6/30/2020.
4 For simplicity, we are describing a first order approximation of interest rate sensitivity based on duration only and assuming parallel yield curve shifts.
5 For purpose of establishing intuition, this example separates the STRIPS portfolio from the derivatives portfolio. In practice, plans that target a specific hedge percentage versus the liability often allocate assets to a Completion portfolio that may include both physical securities and derivatives. The objective of a Completion portfolio is to maintain the target hedge versus the liability while minimizing yield curve exposure differences versus the liability. For more details, see the Completion Primer available here: https://www.nisa.com/primers/primer-on-completion-portfolio-management/. While the only type of derivative utilized in the example is Treasury futures, including other interest rate derivatives such as total return swaps or repo may improve the efficiency of a liability hedge. Note: The use of derivatives introduces additional requirements and risks to the portfolio.