Pension plans run the risk that actual beneficiary lifespans can exceed those assumed in their liability projections. We estimate the risk to be about 0.4% annually in funded status terms. While longevity risk should not be ignored and can be managed, it is small relative to the market risks embedded in a typical plan’s assets and liability.
Pension plans are paying more attention to longevity risk – the chance that beneficiaries will live longer than anticipated. For those plans looking to understand and potentially manage this risk, there are some key points to consider:
-
What is longevity risk? Longevity risk is not the risk that lifespans may improve in the future – lifespans are expected to improve and pension liability estimates may (or should) already incorporate that expectation. Instead, longevity risk is best viewed as the uncertainty related to the central tendency of those lifespan projections. The degree to which today’s projections are wrong about future lifespans implies an uncertainty surrounding current liability valuation and funded status.
How is longevity risk hedged? Longevity swaps, annuity buy-ins, and terminations are available as strategies to manage the uncertainty associated with lifespan improvement projections. The pricing of an annuity product or the structure of a longevity swap will use current projections of lifespan improvements as a baseline, regardless of whether a plan’s liability valuation may be using these current projections or older assumptions. Future changes in assumptions and realized mortality rates can be hedged, while the “shock” from catching up to current assumptions obviously cannot.
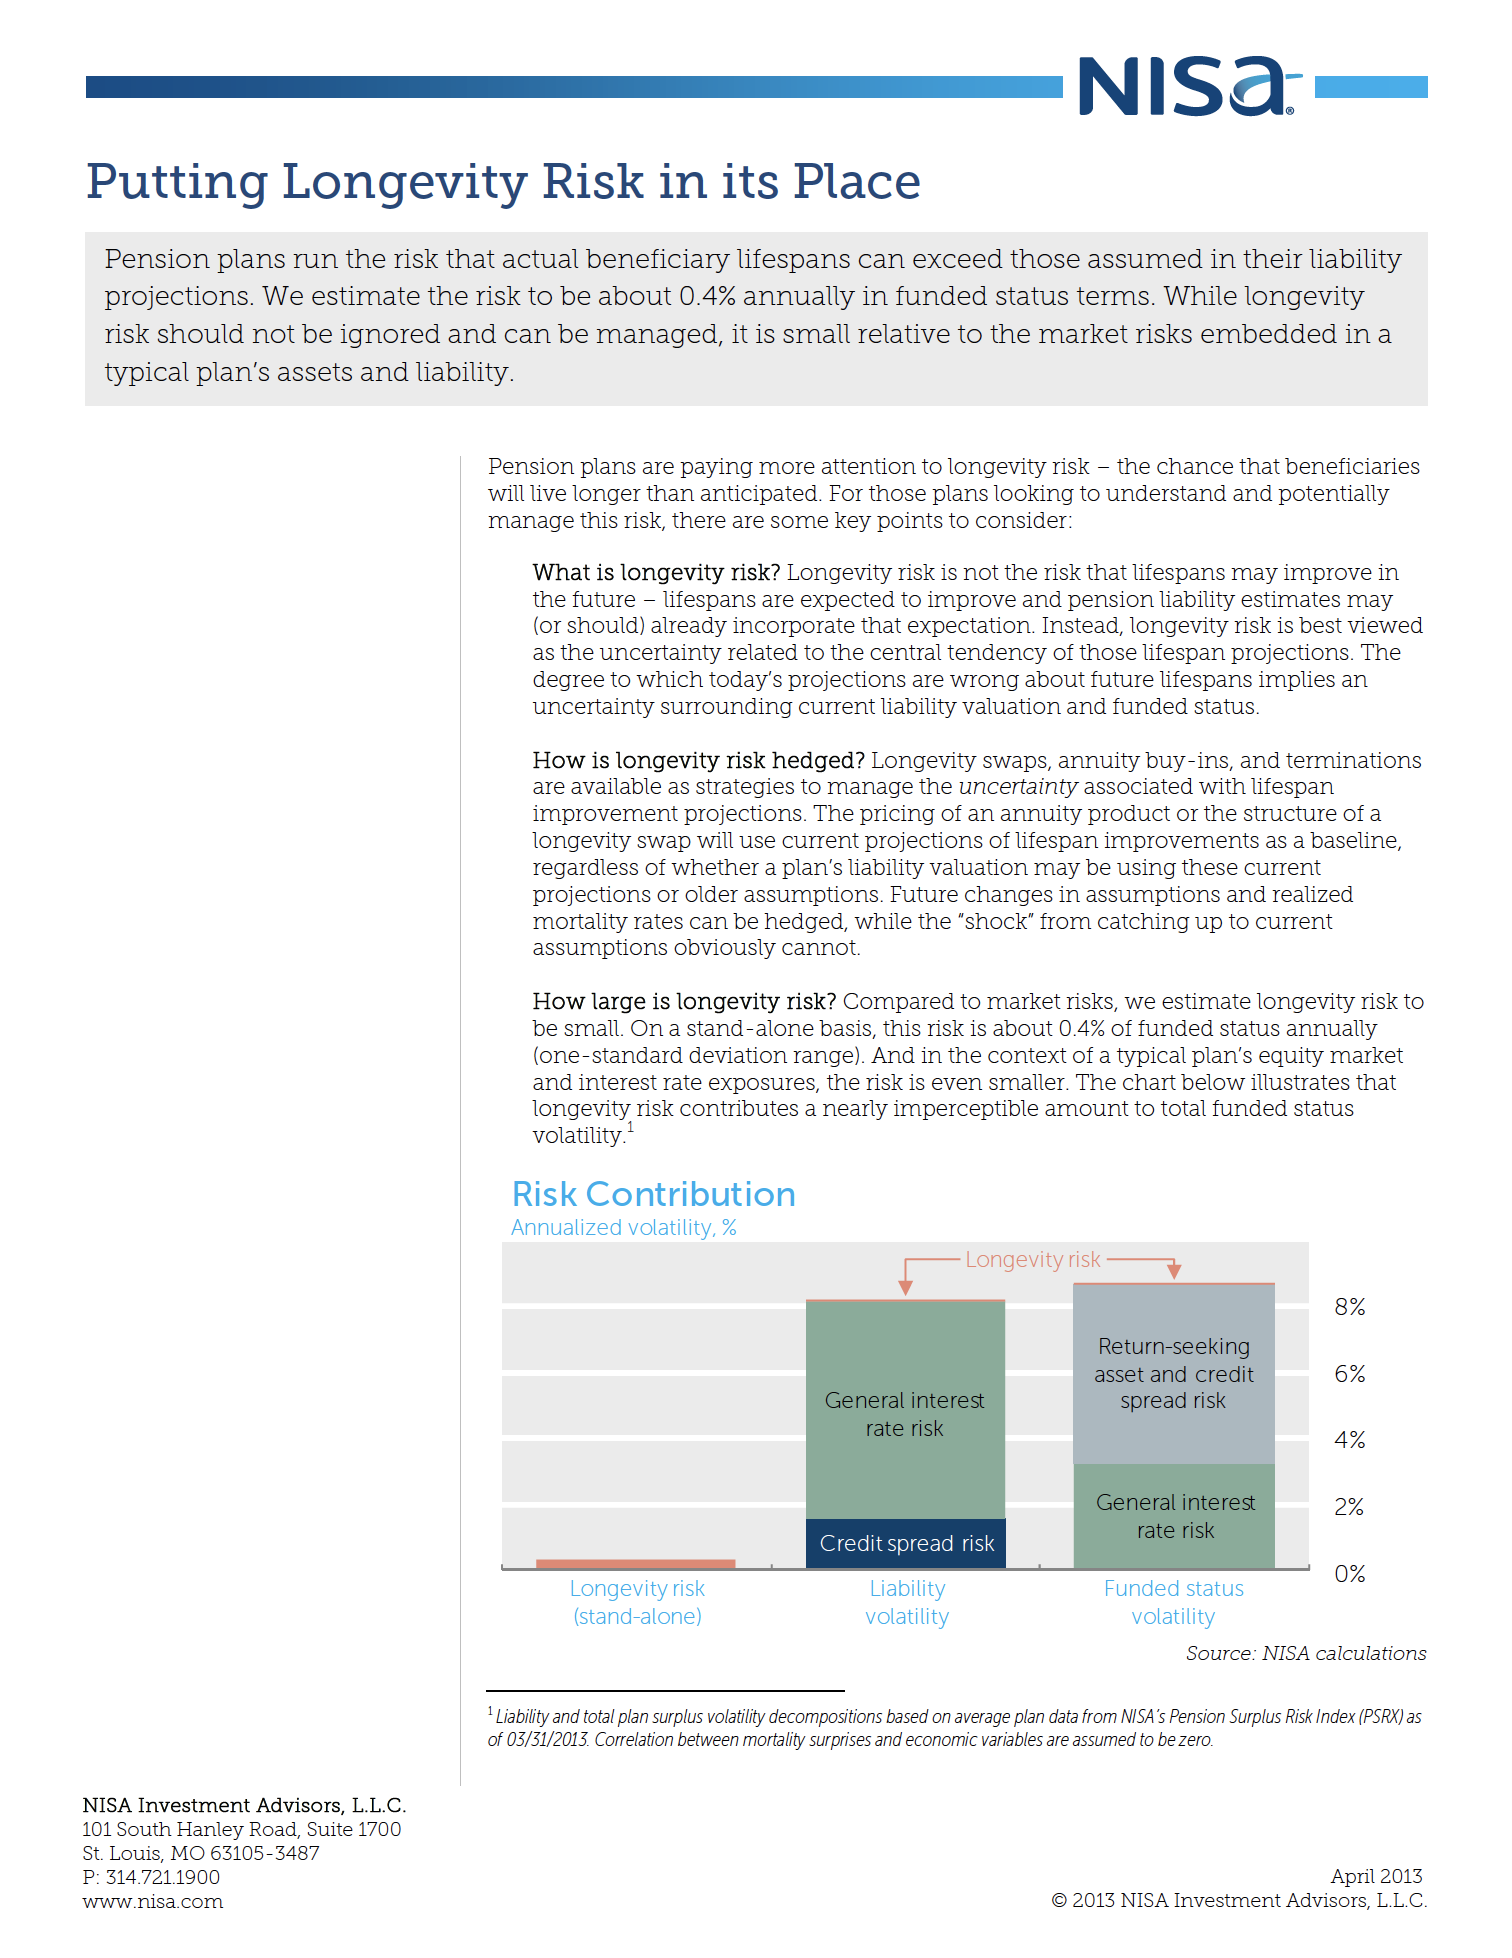
How large is longevity risk? Compared to market risks, we estimate longevity risk to be small. On a stand-alone basis, this risk is about 0.4% of funded status annually (one-standard deviation range). And in the context of a typical plan’s equity market and interest rate exposures, the risk is even smaller. The chart below illustrates that longevity risk contributes a nearly imperceptible amount to total funded status volatility.1
Pension risk managers may have estimates of the liability’s sensitivity to changes in longevity. For example, we calculate that an unexpected increase in life expectancy by one year2 would increase pension obligations by 3% in present value terms for a typical plan. By way of illustration, a $1 billion liability3 would increase to $1.03 billion, an increase of $30 million.
While this may seem like a big impact, the real issue from a risk management perspective is the likelihood of this illustrative one-year increase in life expectancy. Without any sense of the probability of longevity uncertainty, it is hard to justify any action (or inaction) towards managing the risk. Pension risk managers have been left to guess at this probability, since lifespan projections used by pension actuaries typically do not include any estimate of their uncertainty.
However, mortality models can provide a likelihood estimate, which can then be applied to pension liability projections. We derive our estimate of 0.4% as a one-standard deviation range for annual longevity risk through this approach.4
The rest of the paper will delve into the details, first by examining how actuaries currently incorporate longevity improvement estimates, and how those estimates have changed in the past. We then discuss current lifespan projection models and the uncertainty surrounding those projections that gives us a basis to quantify the risk that mortality uncertainty brings to the funded status of a pension plan. It’s worth clarifying that while we discuss various longevity projection methods, we do not attempt to evaluate them – we leave that endeavor to actuaries.
Understanding Longevity Risk
Actuaries determine life expectancy by establishing assumptions about the probability that an individual will die within a given year and then making additional forecasts about how those probabilities may change in the future. These assumptions are premised on a wide array of information. For example, the probability of death often varies by the age, gender, and general health condition of the individual.
Current mortality rates and future changes in mortality rates are subject to uncertainty. Current mortality rates, at least for a very broad population, are generally considered accurate and not subject to meaningful uncertainty due to the large sample sizes available from sources such as the Social Security Administration. Any uncertainty about current mortality rates is not considered here.
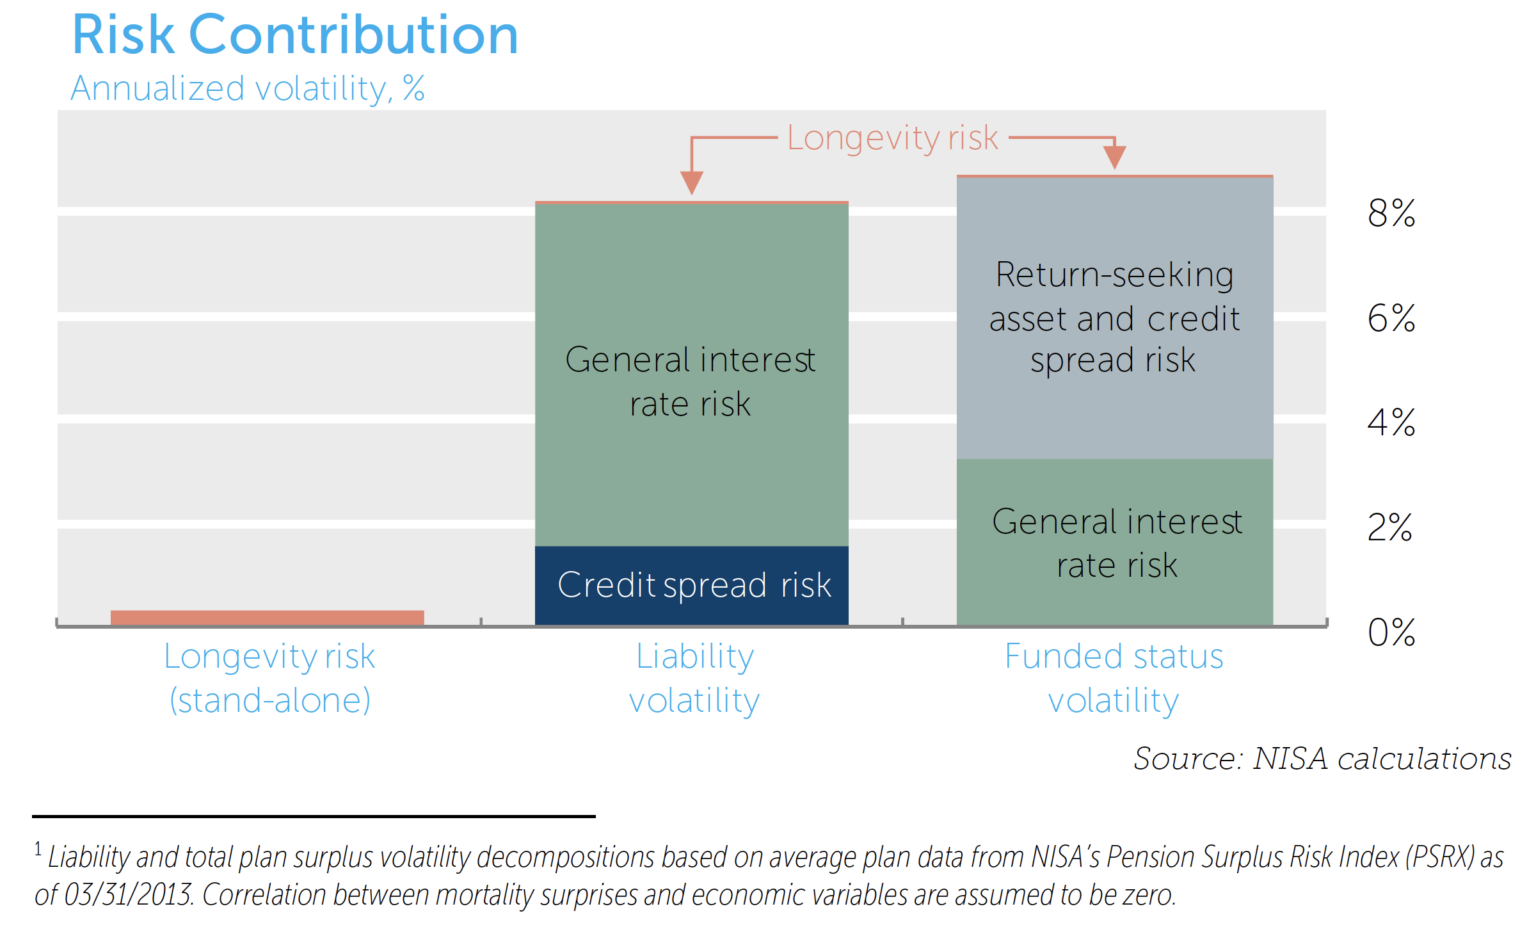
The following chart illustrates historical mortality rate trends for U.S. females since 1900.
The chart shows the mortality rate for 45-, 65-, and 75-year old females. It is intuitive that the older the individual, the higher the mortality rate. The most striking observation from the data is the unquestionable trend in the improvement of the mortality rate at every age.
Extrapolating this improvement into the future is central to understanding how much risk longevity contributes to a pension plan. Much debate in the actuarial and demographer communities surrounds whether current improvement trend estimates are too modest. Consider a recent example in which revisions to actuarial mortality estimates (replacing Scale AA with Scale BB)5 increased a typical liability’s present value by nearly 5%. Is this 5% change due to inherent uncertainty in mortality rates, or was the initial estimate developed with too modest assumptions? Or is the new assumption too aggressive? We leave this to the actuarial community to determine.
There also is the risk that even if actuarial projections for the entire population are perfectly precise, a given pension plan’s “sample” of participants from that population may result in higher or lower realized mortality than predicted due to standard statistical sampling error. As the audience for this paper likely has thousands of beneficiaries in their plans, the risk due to this sampling variation is small and is ignored in the analysis that follows.6
Projecting Uncertainty with Mortality Models7
Actuaries and demographers use history as a key input when forecasting mortality rates and the uncertainty surrounding them. Some models rely entirely on historical mortality rates to develop forecasts of future mortality rates.
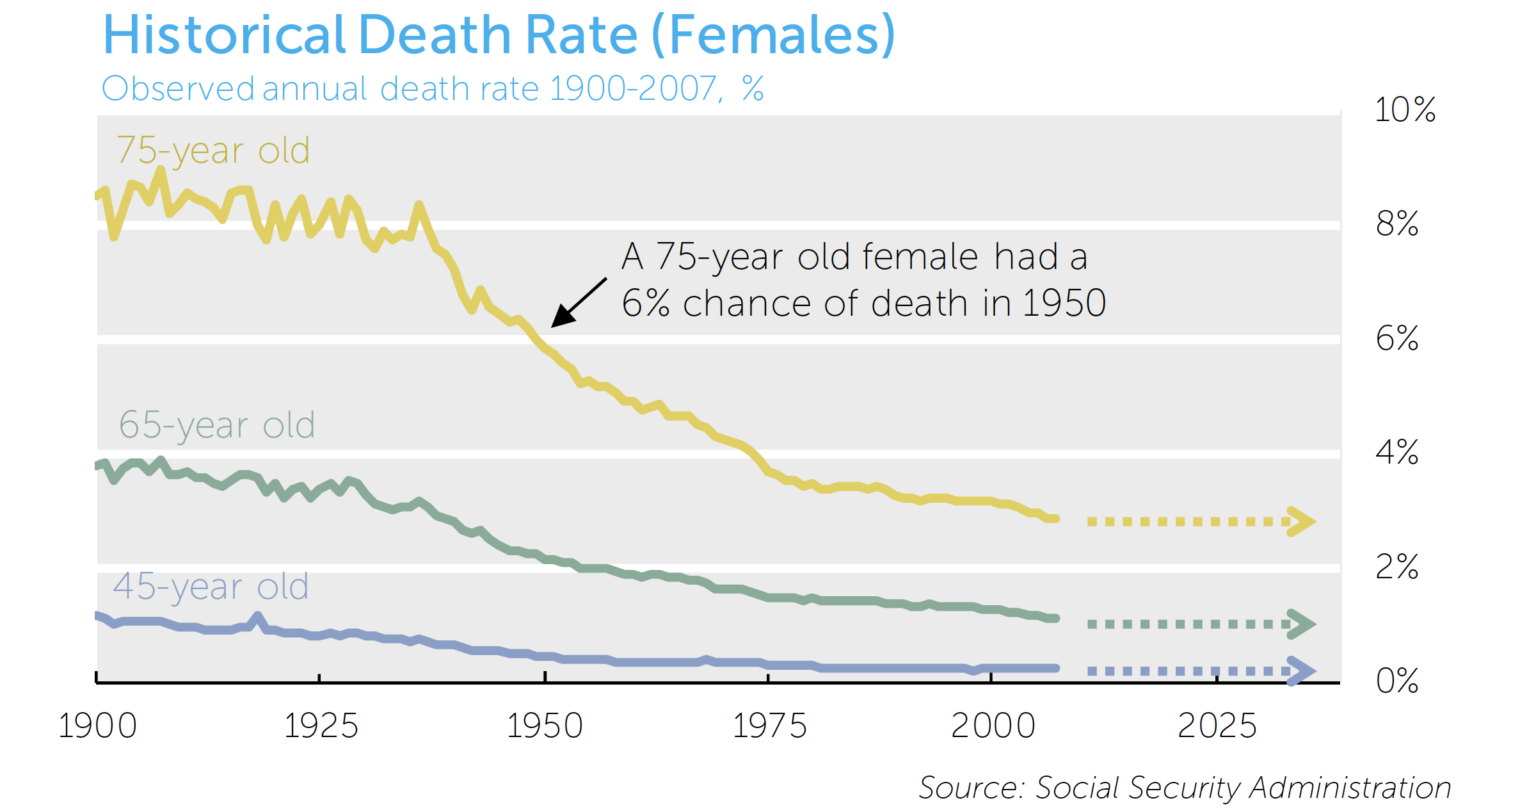
The Lee-Carter model is such a model and is commonly used as a standard against which others are measured.8,9 We use this The Lee-Carter model uses variation in historical mortality rates to calibrate the level of uncertainty in future mortality rates. The model then simulates future mortality rates to generate a distribution of possible paths for mortality. A cursory inspection, however, reveals curious behavior in the historical mortality data. Data prior to around 1950 appear meaningfully more volatile than data since. As such, calibrating mortality models by including the data prior to 1950 results in higher uncertainty forecasts than excluding the data, as illustrated in the following two charts:
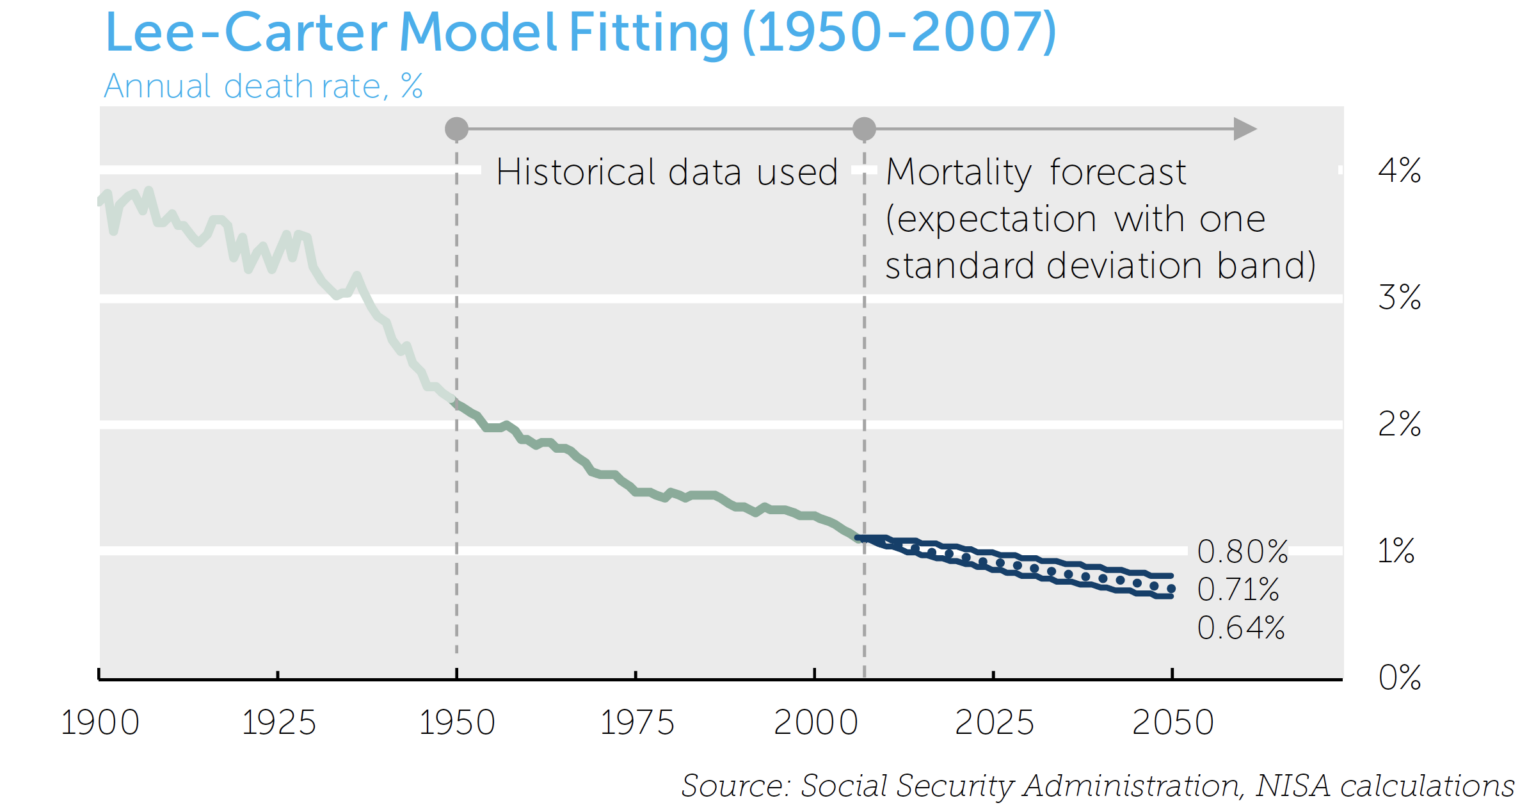
Given the stark difference in uncertainty estimates, we continue by assuming two cases: a “higher uncertainty” case, generated by fitting the model with data since 1900, and a “lower uncertainty” case, generated by fitting the model to data since 1950.
Lastly, it is important to reiterate that the uncertainty estimates produced by such models are based entirely on history. That is, the models suppose the past is representative of the range of possible future events. To the extent there is a potential degree of uncertainty that has not been previously seen (e.g. a catastrophic global environmental event, miracle cure for diseases, etc.) the models will understate the ‘true’ volatility of mortality. While the magnitude of this bias is impossible to know, this may be another argument for using a “higher uncertainty” case when assessing risk.
Estimating Longevity Risk for Pension Plans
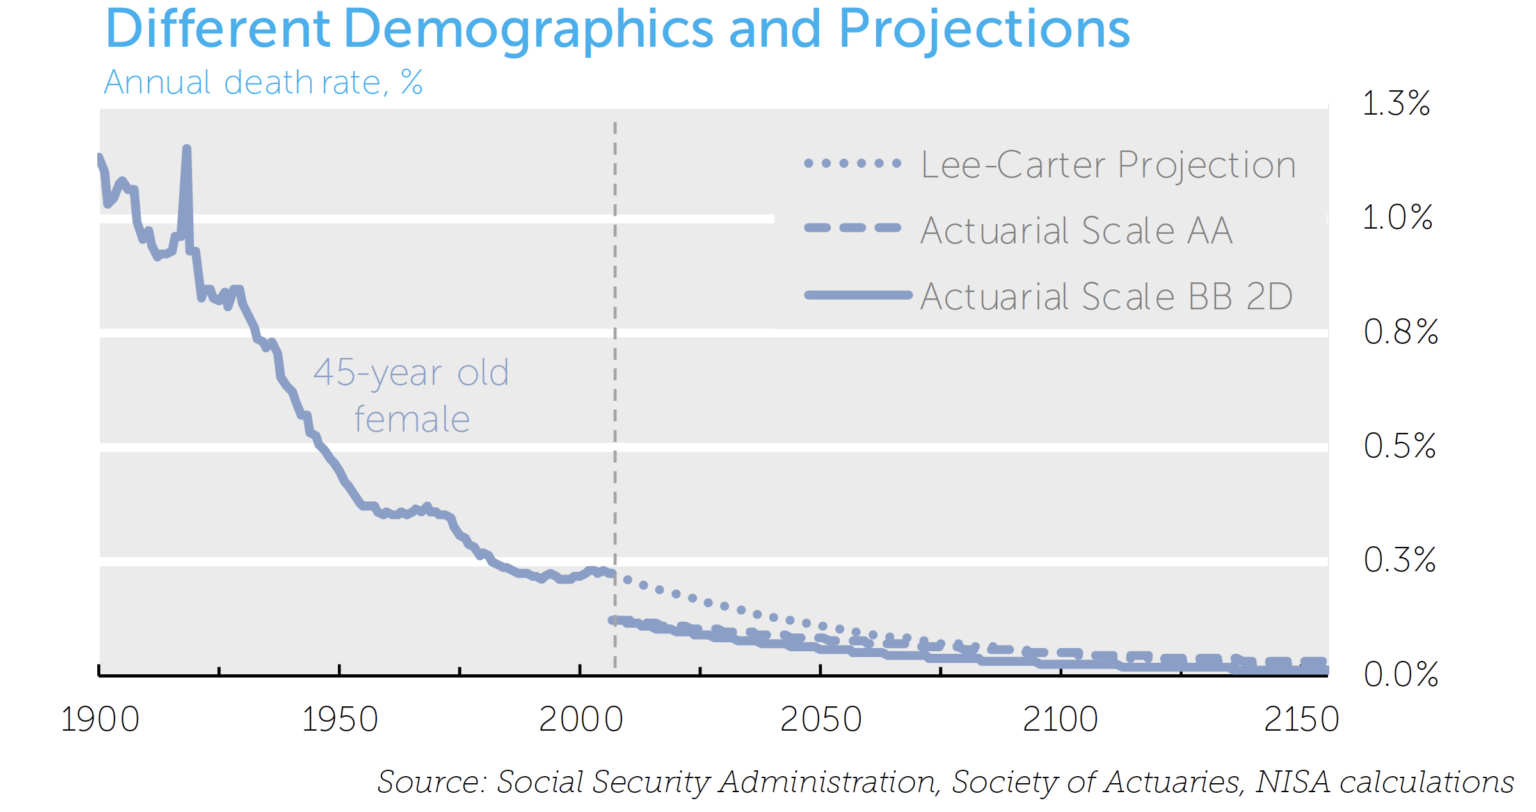
The baseline assumptions used by pension actuaries differ from estimates generated from the broader population data because pensioners are a different demographic than the general population. For example, many pension plans include a greater proportion of people in higher socio-economic classes, with historically lower mortality rates than the general population. Regrettably, mortality data on pension participants is hard to obtain, so most mortality models are fit to data based on the general population. As an illustration of this issue, the following chart highlights the difference between model-fitted assumptions and two pension actuarial assumptions (Scale AA and Scale BB 2D10) for a 45-year old female. The lower initial mortality rate (about 0.15% lower) assumed by the actuaries may be appropriate due to the differences in demographic compositions.
These pension actuarial assumptions, however, are generally silent on uncertainty measures, which are necessary to understand pension longevity risk in any probabilistic sense. As a solution, we can use the uncertainty derived from mortality models like Lee-Carter based on a broad population to estimate an uncertainty for the pension actuaries’ projections. This allows us to estimate the impact of this uncertainty on pension liability value.
Applying this to a pension plan, we map the variation in mortality to variability of annuitant cash flows, which in turn is discounted to arrive at variability in the present value of pension cash flows. For this purpose, we develop a hypothetical set of individuals, with demographic characteristics similar to typical pension liabilities. We then simulate five thousand equally possible paths of lifespans for each age group and gender. This generates the range of pension cash flows illustrated in the following chart.
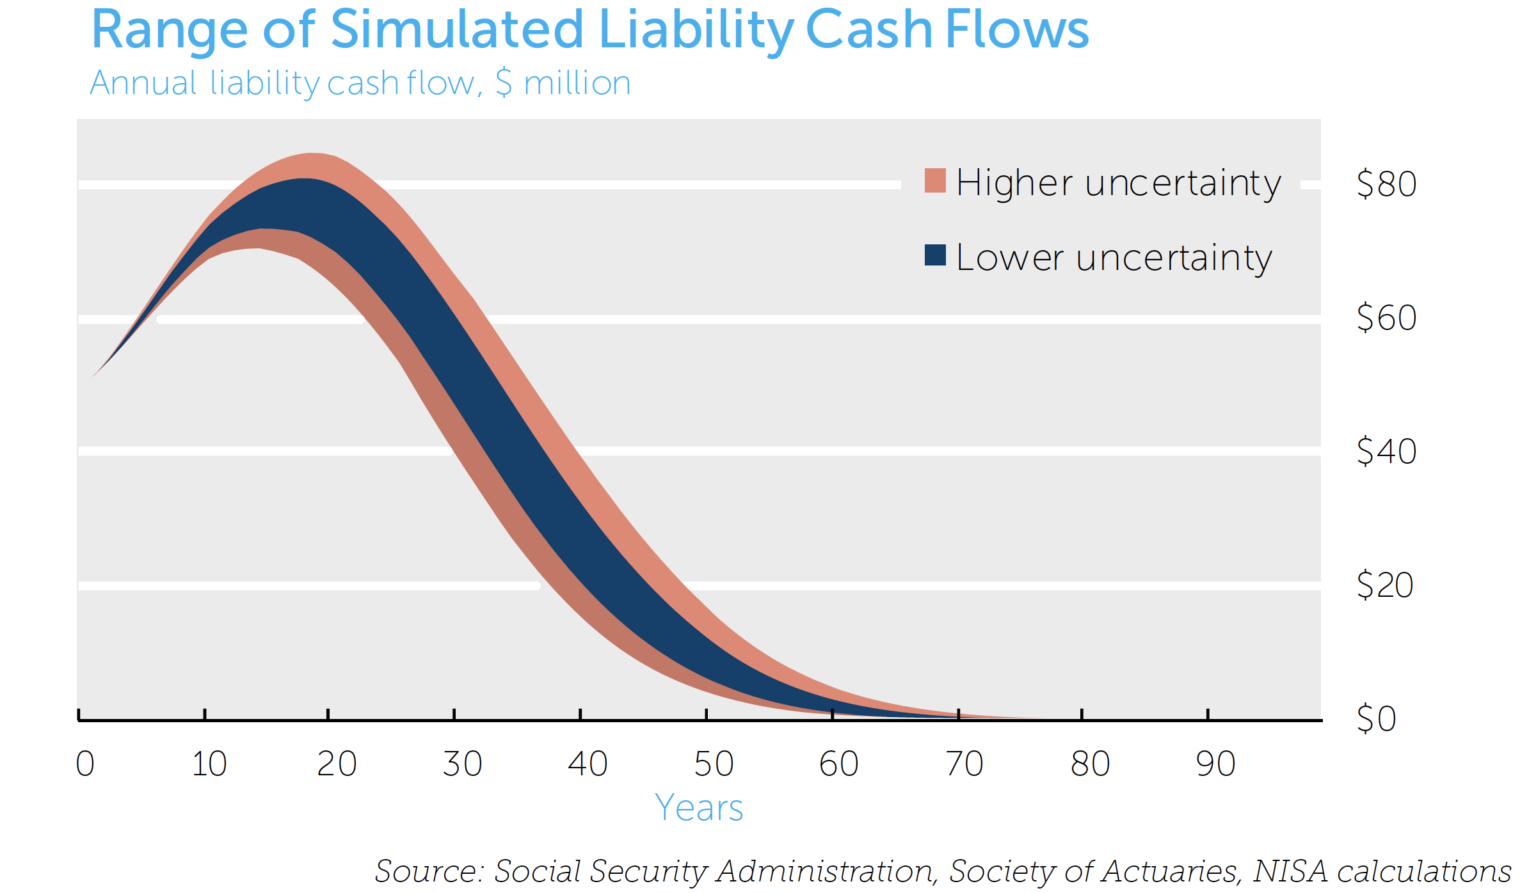
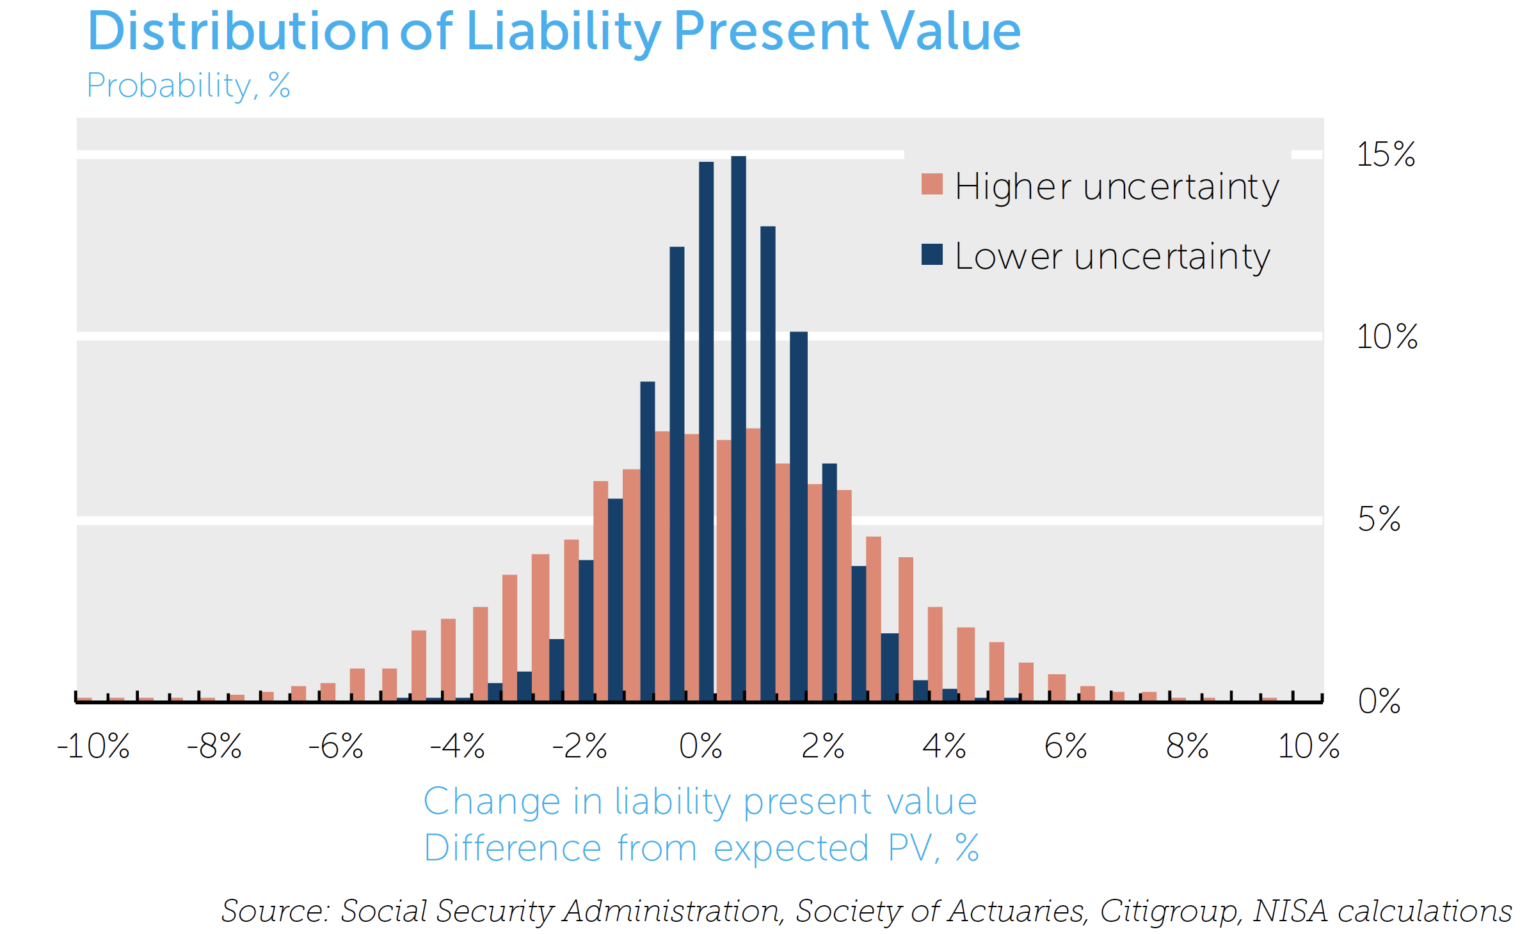
We then discount these possible pension cash flows at current interest rates11 to generate a distribution of present value for the pension liability. Based on our analysis, the Lee-Carter mortality model suggests that a one-standard deviation band of uncertainty around today’s estimates of pension liability values may be as high as 2.4%. The lower uncertainty case of 1.2% variability, calibrated from more recent (and stable) mortality experience, suggests a potentially lower risk level.
Interpreting this volatility range is challenging as it represents the distribution of the present value of the liability after all future mortality uncertainty has been resolved and is taken into consideration. Perhaps a more intuitive measure would be to consider a one-year volatility measure, as is common in financial asset markets (e.g., 15% risk on an equity investment). We estimate this volatility to be about 0.4% per year.12 That is, a one-standard deviation change in the present value due to variation in the realized mortality rates would change funded status by plus or minus 0.4% in a given year.
Furthermore, these estimates view longevity risk on a stand-alone basis, whereas a pension risk manager may be more interested in the contribution to total risk at the liability or plan level. As shown in the illustration on the first page, longevity risk seems to be of even less concern when viewed in this context. When “decomposing” liability risk of 8.2% and total plan funded status risk of 8.7%, longevity uncertainty contributes less than 0.02% towards these totals.
We can conclude that longevity risk pales in comparison to other risks in the pension plan, such as equity market or interest rate risk. Moreover, for a frozen or aging plan, this risk will generally decline through time as there is less sensitivity to distant mortality rates and the mortality rates for the young become relatively less important. Longevity risk will also decrease in magnitude should interest rates rise from their current historical lows.13
Nevertheless, as plans move down a de-risking glide path, longevity risk could become a more central concern, as it will be an increasing portion of the risk that does remain.
Managing Longevity Risk
Measuring the magnitude of longevity risk in pension plans is one thing – determining how best to manage the risk is another. There are a variety of hedge solutions available to pension plans, which can be broadly categorized as follows:
- Bear the risk: Recognizing the relatively small magnitude of longevity risk, stakeholders could decide that the plan can absorb the risk if longevity surprises prove negative. Contributions may be modestly more volatile than would be the case in other hedge solutions, but differences between realized and forecasted mortality rates will take years to manifest themselves in pension valuations. The ultimate realization of this uncertainty may be lumpy, as the occasions for updating assumptions are fairly infrequent.
- Longevity swaps: While the longevity swap market is in its infancy in the United States, its existence in other countries and the increased discussion in the US demonstrate a willingness among market participants to transfer this risk. Entering into a longevity swap should reduce or eliminate the economic exposure to longevity within the pension plan. Counterparty risk to the swap provider, however, would exist in such transactions.
- Buy-ins: Buy-ins could be thought of as a turn-key asset that hedges some or all of the longevity and market risks associated with pension obligations. The asset is the insurance contract from an annuity provider. A key difference between this and a buy-out is that the plan remains under the fiduciary’s control and on the sponsor’s balance sheet. This may be an appealing option for an active plan that wishes to “shut down” market and longevity risks for a portion of the assets and liability while maintaining a more traditional approach for the rest. However, a counterparty exposure to the annuity provider would be introduced.
- Buyouts: One way to completely eliminate longevity risk from the pension plan is to contract with an insurance company to assume benefit obligations in conjunction with a termination via an annuity buyout. The longevity risk, along with all market risks, is then transferred to the insurance company. Based on our analysis of the scale of longevity risk, we believe it is unlikely that longevity risk alone provides a compelling argument for sponsors to take this route. Moreover, counterparty risk could become an issue in the event of a credit event with the insurer, as with buy-ins. Litigation risk would also exist, as illustrated by the lawsuits deriving from one of last year’s larger buyout transactions.
Conclusion
Economic exposure to longevity risk in pension plans is not new. Our intent in this paper has been to shed light on the magnitude of the risk and how it can be managed. Industry standards suggest longevity risk may introduce uncertainty of about 2-3% around today’s estimate of a plan’s liability, or 0.4% in annual terms. This is not an insignificant amount, but is small compared to other risks such as equity market and interest rate risk that are commonly present in pension plans. If/when a plan gets further along a de-risking glide path, managing this residual longevity risk may take on increased importance.
APPENDIX
Changes in Life Expectancy: A Recent Observation
A real world scenario illustrates the risk of mortality improvements. Common valuation techniques (e.g., PPA valuations) for pension plans use the RP-2000 Mortality Table and the Scale AA improvement schedule to determine the life expectancy of pension beneficiaries. Developed by the Society of Actuaries around 2000 and 1995, respectively, these tables are now being revised. While the final findings are not expected until late 2013, an interim update to the Scale AA improvement schedule, Scale BB, is available.
Expected mortality rates have declined broadly – for example, a 65-year old female had a life expectancy of 86.3 years in 2012 under the old assumptions (Scale AA), and 88.1 years under the new (Scale BB). Using the new scale increases the liability present value by approximately 5%, or about 0.4% per year over the 12 years between the release of RP-2000 and Scale BB.
In addition to updating for newly available data, Scale BB has allowed for a two dimensional design, unlike Scale AA. The two dimensions allow for mortality improvement assumptions to vary not only by age of the person, but also by the year in which improvement takes places. The construction is such that improvement trends converge to be the same for all ages as time goes on. It is believed this method better reflects mortality dynamics. Nevertheless, the Society of Actuaries also published a one-dimensional table to be used if the two-dimensional table cannot be used for some reason. Using the Scale BB one dimensional table results in a life expectancy of 87.6 years for the 65yr old female, and a 4.7% increase in the typical liability.