
Pension Surplus Risk Index (PSRX)
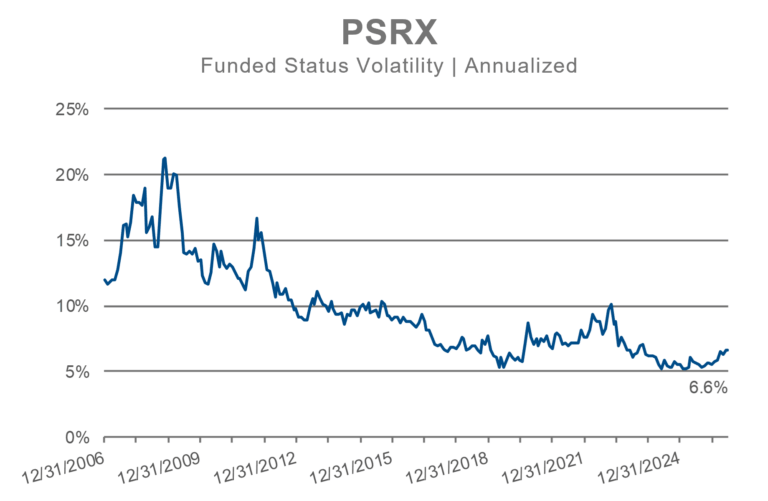
The Pension Surplus Risk Index (PSRX®) held steady at 6.6%.

NISA’s Pension Surplus Risk Index, or PSRX,1 is a forward-looking estimate of the funded status volatility of U.S. corporate defined benefit pension plans. The index level represents a one standard deviation change in funded status over a one year horizon, based on the average of the 100 largest pension plans.2 For example, an index value of 15% suggests approximately a one in three chance that a $1 billion plan could lose or gain more than 15%, or $150 million, in funded status in one year.2 We believe the PSRX and its accompanying sector indices will provide a useful risk measure for CFOs, Treasurers and plan fiduciaries to gauge their pension risk’s influence on enterprise risk, implications for capital structure, and level of beneficiary security, respectively. It is our hope the index, a dynamic measure of surplus risk, offers an additional dimension of context that proves meaningful in framing decisions.
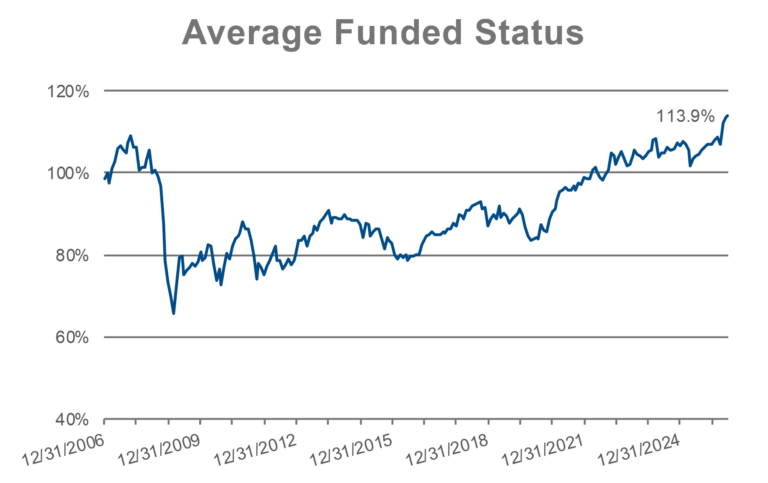
The chart below shows the history of the average funded status of constituent plans included in the PSRX.
PSRX Overview
The PSRX is a forward-looking estimate of the funded status volatility of U.S. corporate defined benefit pension plans. The index level represents a one standard deviation change in funded status over a one year horizon, based on the average of the 100 largest pension plans.1 For example, an index value of 15% suggests approximately a one in three chance that a $1 billion plan could lose or gain more than 15%, or $150 million, in funded status in one year.2
Please refer to the PSRX Overview and PSRX Guide for more information.
From a risk management perspective, the primary shortcoming of many existing pension indices is that they are backward-looking in nature. The PSRX, based on current implied volatility data from option markets, is a forward-looking estimate of funded status volatility. We believe the PSRX and its accompanying sector indices will provide a useful risk measure for CFOs, Treasurers and plan fiduciaries to gauge their pension risk’s influence on enterprise risk, implications for capital structure, and level of beneficiary security, respectively.
The PSRX constituent pension plans represent approximately $1.05 trillion of assets and $1.00 trillion of pension liabilities.
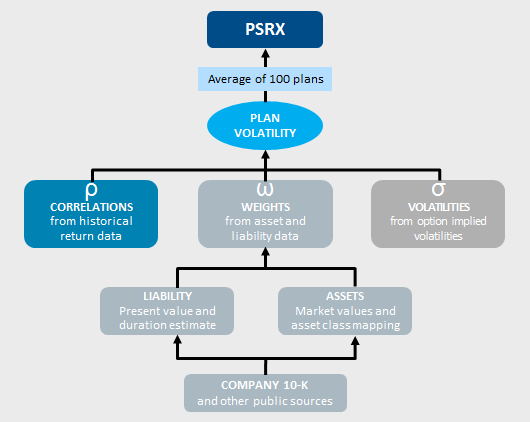
The PSRX methodology calculates the funded status volatility individually for the largest 100 pension plans.1 The PSRX represents the arithmetic average of these volatilities.
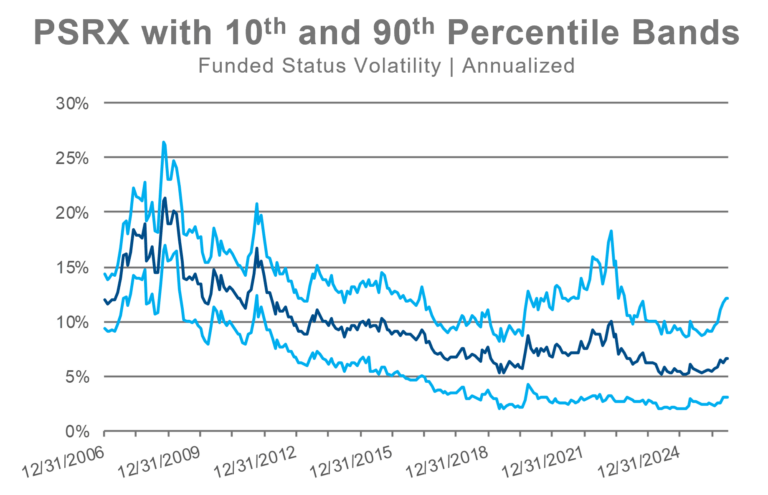
In addition to the PSRX, NISA reports the 90th and 10th percentile funded status volatilities within the largest 100 plans.1
In addition to the primary index, NISA provides a matrix of risk estimates for various combinations of risk asset allocations, liability durations and funded status levels, to allow individual plans to determine a volatility level that more closely corresponds to their circumstances. These sector indices assume hypothetical plans with static funded status, liability durations and risk asset allocations over time, for example, 85% funded, 12.5 duration and a 60% allocation to risk assets.
Please refer to the Sector Indices section for more information.
Yes, in fact the primary index is comprised of the volatilities of the individual constituent plans. NISA can provide a customized analysis based on plan specific data. Please contact a NISA Client Service representative to discuss such an analysis.
The PSRX is calculated on a monthly basis and typically released on the sixth business day following month end. Please refer to the Methodology section below or PSRX Guide for more details.
Methodology
The PSRX reflects the average of the individual funded status volatilities for the index-constituent plans. Constituent plans are:
- U.S. defined benefit corporate pension plans;
- Publicly-traded; and
- The 100 largest plans based on pension liability present value (PBO), as determined by NISA from publicly available documents, and re-constituted annually.
The constituent plans represent approximately $1.05 trillion in assets and $1.00 trillion in liabilities in aggregate as of 12/31/25.
Deriving individual plan volatilities involves three main components:
- Plan-specific asset allocation and liability data, derived from publicly available sources
- Implied volatilities for various markets from traded options
- Correlations between the various asset classes and liability components from historical data
These three components provide the necessary inputs for a traditional portfolio volatility calculation; in this case the “portfolio” is the combination of both the assets and liabilities of the plan.
Index constituents are determined annually by NISA and updated with the April 30 index release. Plans with poor data quality are removed from the index. Each monthly index update reflects current implied volatility data from option markets, a “roll forward” of asset and liability figures to reflect market movements year to date, and updated correlation calculations.
Additional details regarding the calculation of the index can be found in the PSRX Guide.
Supplemental Data
Sector Indices
In addition to the primary index, NISA provides a table of the risk levels of the major industry sectors, or sector indices. The methodology for calculating the sector indices is identical to the PSRX, but narrowed to only include constituents in the given sector.

Additional PSRX Data
The chart below shows the history of the PSRX since inception. The 10th and 90th percentile bands help provide a range of pension plan funded status volatility.
The asset portfolio and the liability volatility are key determinants of the PSRX. The relative level of those components has varied considerably since inception.
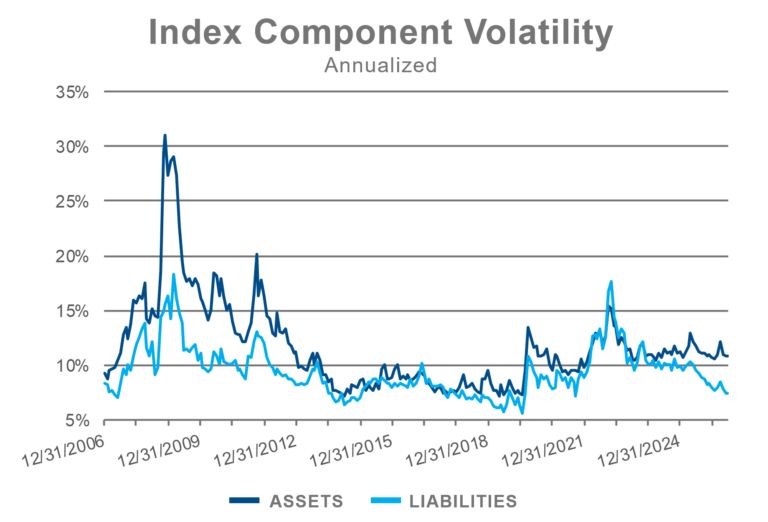
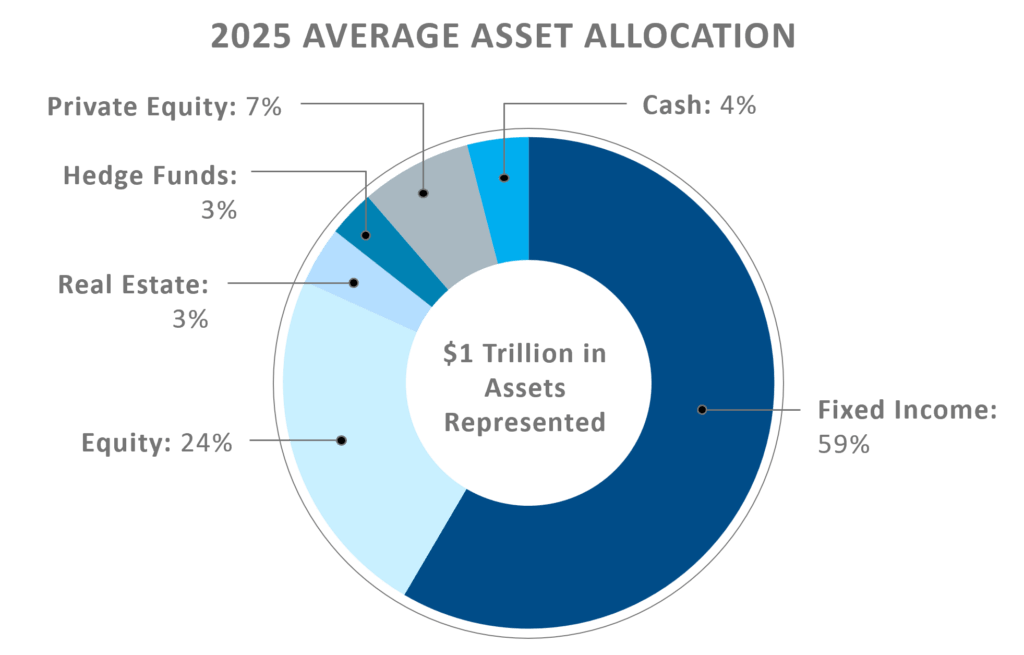
The PSRX asset allocation changes annually based on data provided in firms’ 10-Ks. The chart below shows allocations for the 2025 plan year as determined by NISA.
Note: The levels for the PSRX and sector indices include data for periods prior to when the index was in live production. Historical levels for the index prior to live production in September 2012 are calculated using the same methodology. Past market experience is not necessarily indicative of future market experience.
All PSRX data as of 6/30/2026.