The recent widening of credit spreads has increased focus on the potential suitability and attractiveness of corporate bonds as pension plan investments. This paper examines one aspect of these issues – reducing funded status volatility by better matching the sensitivity of the liability’s discount rate to credit spreads using corporate bonds.
To assess the effectiveness of corporate bonds for this purpose, after reviewing some background information, we examine the inherent difficulty of attempting to “lock-in” the spreads used to discount the liability. We then take a wide-lens view of an illustrative plan’s sensitivity to credit spreads, inclusive of the liability and the plan’s overall asset allocation.
This paper makes two important points, both supported by common sense and theory, and consistent with the empirical data. The first is that a portfolio of corporate bonds, even one ideally structured, is likely to experience significantly different returns than an Aa-discounted pension liability. The second is that many plans may already have significant effective exposure to changes in corporate spreads via other asset classes such as equities, even before the additional investment in corporate bonds.
There are several important determinants of the desirability of an allocation to corporate bonds that we will not consider here. Among them are any tactical views on the relative value of corporate bonds, the impact of historically high spreads on this relative value determination, the future direction of interest rates in general, the cost of any hedge, and the risk-return preferences of a given plan – any one of which may be a determining factor of whether to invest in corporate bonds.
Credit Spread Impact on Pension Liability Valuations
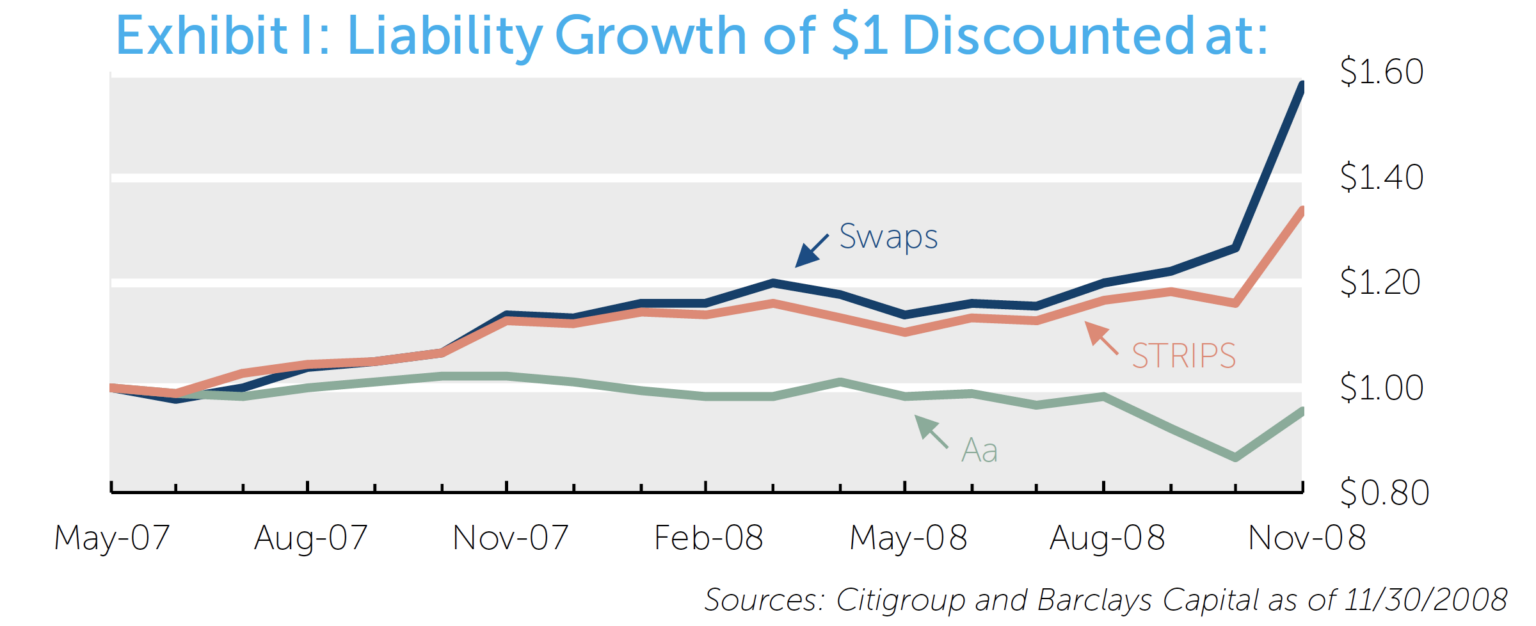
Many of the common measures of the value of pension liabilities (including some mandated by statute) are based on discount rates derived from yields on high-quality corporate bonds – most notably Aa rated securities. All else equal, given the dramatic widening of credit spreads over the 18 months ending in November 2008, the present value of a typical pension liability discounted at Aa yields has fallen approximately 5%. In contrast, the present value of the same pension liability using interest rate swap rates or Treasury yields has increased approximately 58% and 34%, respectively. The graph below illustrates the growth of an illustrative liability with an initial present value of $1 that is discounted at the Citigroup Aa Pension Discount Curve; the Barclays Capital Zero-Coupon Swaps Curve; and the Citigroup Treasury Model STRIPs Curve.
The question that naturally arises is: Can a plan “lock-in” the corporate spread used to discount the liability by increasing its allocation to corporate bonds? The next two sections investigate this question.
“Locking-In” the Spread with Corporate Bonds
The spread of a corporate bond is highly unlikely to represent the expected excess return of that bond over Treasuries because, among other reasons, the issuer of the corporate bond could default. In fact, the spread of a given corporate bond can be viewed as the “best case” excess return – it will be realized if the bond does not default before maturity. The positive expected excess returns typically associated with corporate bonds may result from compensation to bear credit risk (similar in nature to the equity risk premium) and liquidity risk, for example. As long as some portion of the spread is compensation for potential losses incurred in the event of default, any strategy that attempts to “lock-in” the spread component of the liability discount rate will be imperfect.
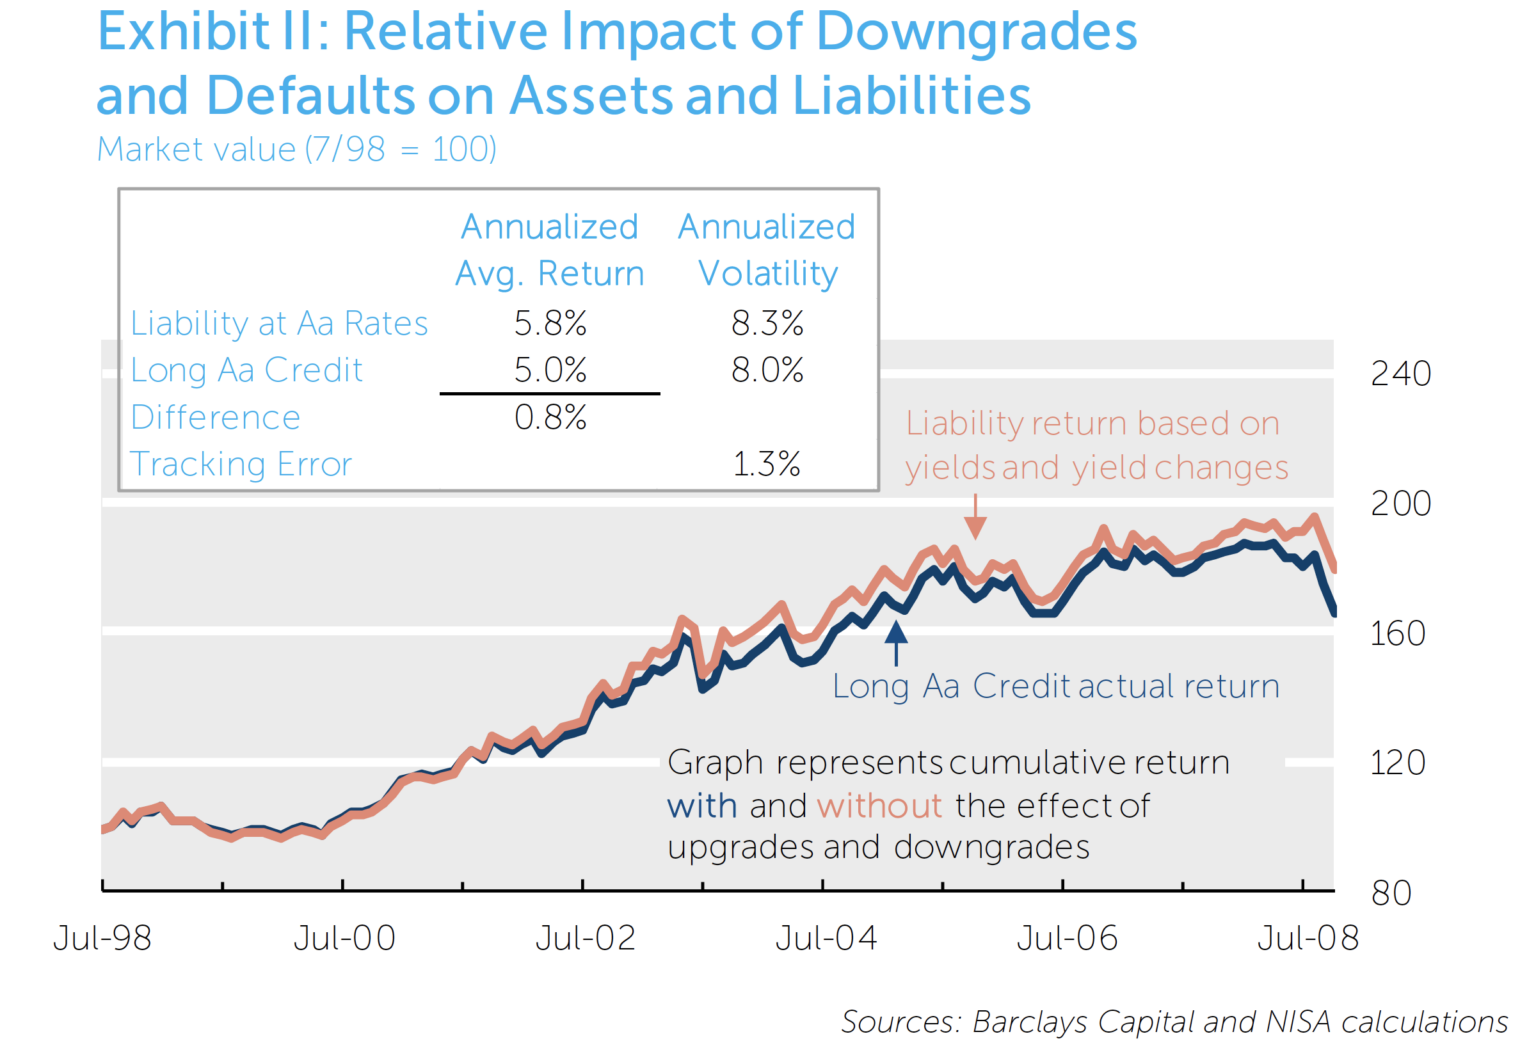
The graph below, covering the period of July 1998 through October 2008, shows that while the returns of a liability discounted at Aa yields and the returns of the Barclays Capital Long Aa Credit Index have been highly correlated, the returns of the Aa-discounted liability have been higher, at least in part, for the reasons stated above.
Plan-Wide Spread Exposure
It is also noteworthy that the reported funded status of the typical large pension plan has deteriorated over the same period of time that spread widening has reduced liability present values (all else equal). We believe this is not a coincidence and leads to our second point: the typical plan already has significant exposure to the basic factors that drive the credit spread imbedded in this discount rate. Thus the addition of corporate bonds may exacerbate rather than alleviate the problem.
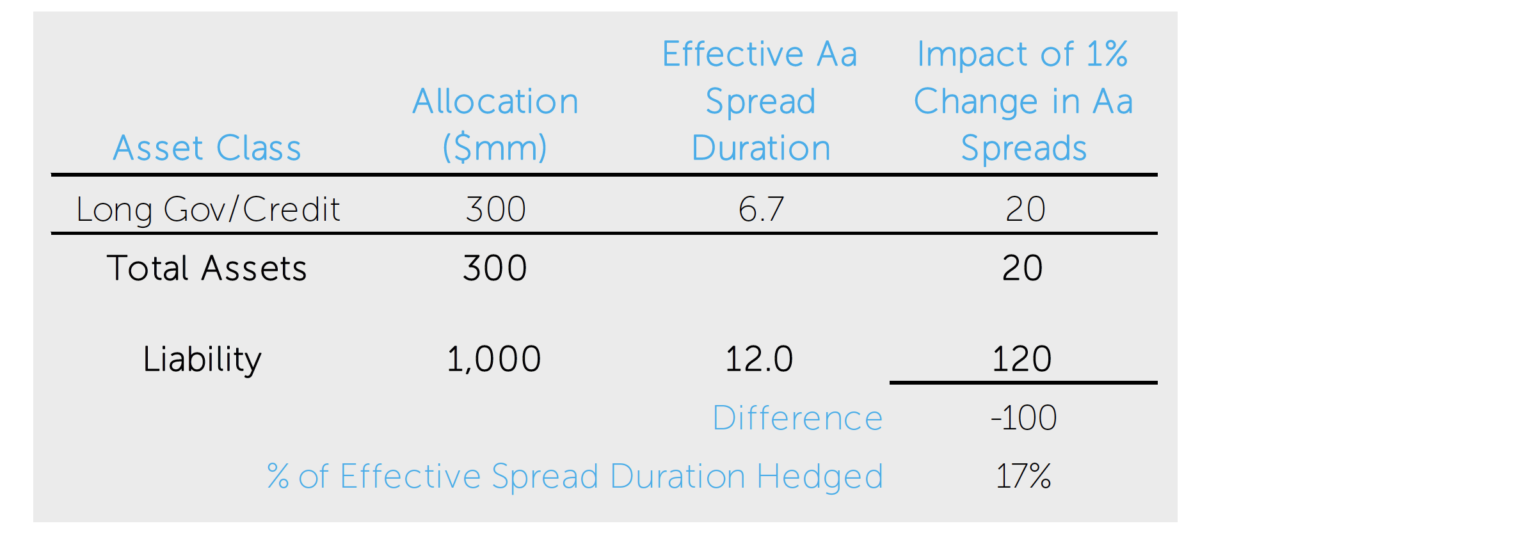
The typical plan’s fixed income allocation does not contain enough corporate bond exposure (i.e., “spread duration”) to match that of the liability discounted at corporate yields. For example, with a 30% allocation to the Barclays Capital Long Government/Credit Index, the illustrative plan below has only hedged approximately 17% of the liability’s spread duration. In other words, a spread tightening of 100 bps would result in an approximate increase of $120mm in the value of the liability, with an estimated increase of just $20mm in the value of the fixed income assets – thus resulting in a $100mm reduction in funded status.
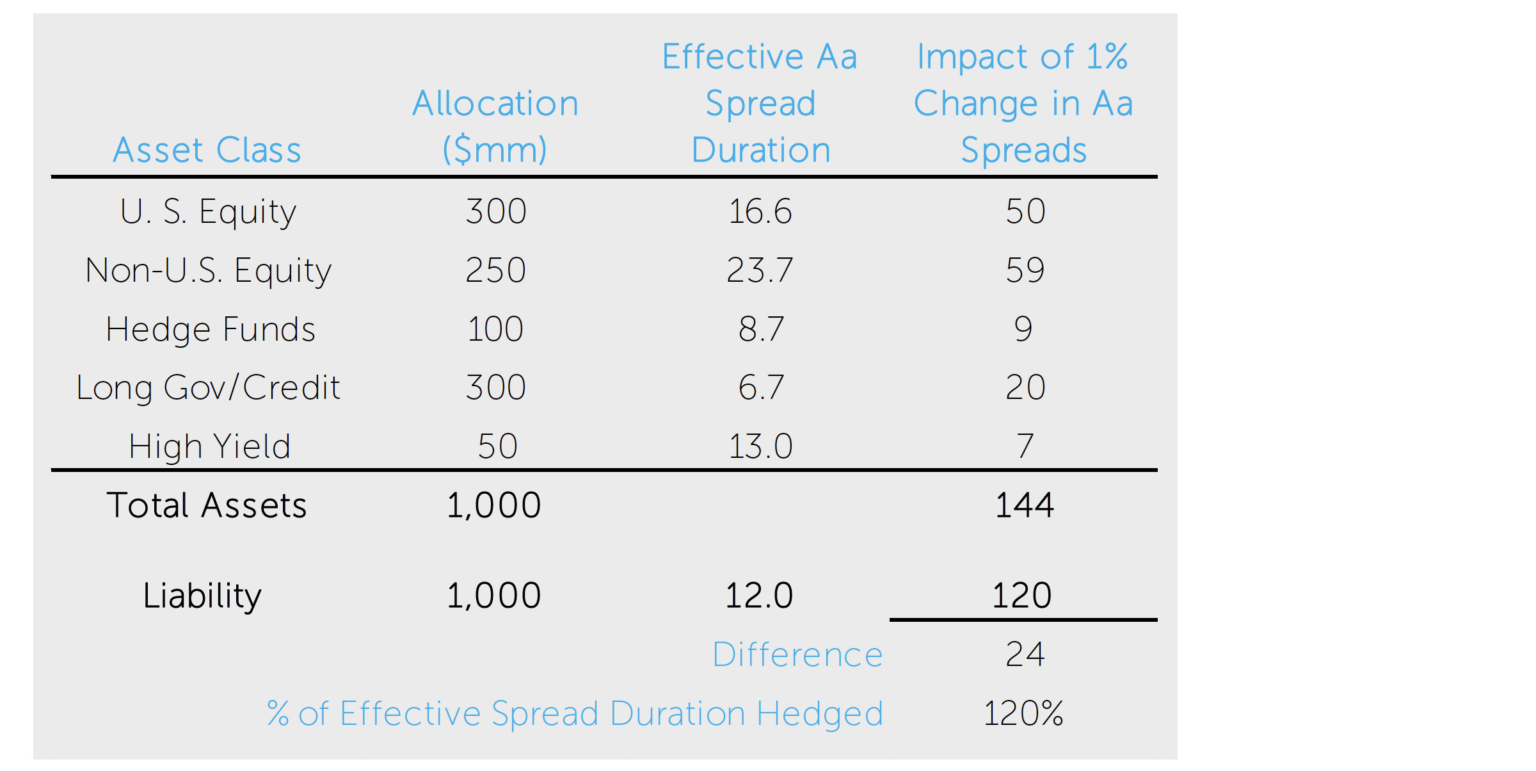
However, if we include all of the plan’s assets in our analysis, a different picture emerges. In particular, when we include the estimated sensitivity of each asset class to changes in Aa spreads (see Appendix for a description of the analysis), the plan’s assets have 20% more sensitivity to Aa spreads than the liability. This more complete measure of spread sensitivity indicates that if spreads were to tighten 100 bps, the plan’s assets would increase by $144mm, resulting in a $24mm increase in funded status.
It is important to note that these plan-wide sensitivities are based on empirical estimates of each asset class’s sensitivity to changes in Aa spreads. To provide a sense of the potential range of these estimates over the last two years, the 95% confidence interval around the estimate of the hedge percentage has been 90%-150% of the spread duration of the liability. Thus, it is far more likely our illustrative plan was overhedged rather than underhedged to Aa spread changes.
Finally, it is worth noting that these estimates are based on index returns. To the extent a plan’s active managers own more or less spread product or have higher or lower betas (to Aa spreads or equities) than their respective benchmarks, the sensitivity to Aa spreads will vary correspondingly.
Conclusion
There are many considerations when examining the appropriateness of an allocation to corporate bonds. To the extent one motivation for such an allocation is the impact of recent spread movements on the plan’s liabilities, we believe the potential tracking error between a corporate bond portfolio and the liability should be analyzed. Secondly, an examination of plan-wide sensitivities is in order. Ultimately, the decision may hinge on any tactical view or change in strategic outlook regarding the corporate bond market given current conditions.
APPENDIX
Data sources:
Effective spread durations were calculated by regressing excess returns on Aa-spread changes. Excess returns were defined as total returns minus returns that are attributable to general interest rate movements for fixed income indices and total returns minus Treasury bill returns for all other indices. Specifically, the following regression equation was estimated:
- Citigroup Aa Pension Discount Curve
- Citigroup Treasury Model STRIPs Curve
- Russell 3000: U.S. Equity
- MSCI EAFE: Non-U.S. Equity
- MSCI Emerging Markets: Non-U.S. Equity
- CSFB Tremont: Hedge Funds
- Barclays Capital Long Gov/Credit: Long Gov/Credit
- Citigroup High Yield: High Yield
Effective spread durations were calculated by regressing excess returns on Aa-spread changes. Excess returns were defined as total returns minus returns that are attributable to general interest rate movements for fixed income indices and total returns minus Treasury bill returns for all other indices. Specifically, the following regression equation was estimated:

- re = Asset class excess return
- AA = Change in Aa spreads
- -β = Effective spread duration