Part 2: The Private Credit Premium is Real. The Performance Drag of Leverage?
Also, Real.
Net Return From Leverage in Private Credit Strategies
In our prior paper, we compared private-market indices with comparable credit-quality public-market indices. Importantly, in an effort to present a fair and balanced comparison, we adjusted the returns of the various indices for differences in duration, leverage and pricing conventions (mark-to-market [MTM] vs. book value accounting). This analysis supports the common view that private credit investments provide an additional return, often associated with their illiquidity. Depending on the horizon, our estimates of the illiquidity premium ranged from 0.5–1.5% over the prior 20 years, net of managers’ fees.
However, the most common vehicles used to access private credit markets tend to use structural leverage, frequently about one turn of leverage.[1] In this paper, we argue that this form of leverage is extremely expensive, and when combined with typical investment management fees, significantly erodes the value proposition of private credit for investors. Nonetheless, if an investor desires this levered return profile, liquid instruments such as high yield credit default swaps (HY CDX) provide a far more effective source of leverage.
The Cost of Structural Leverage in Private Credit
Private credit funds and business development companies (BDCs) frequently employ fund‑level leverage to amplify returns. However, this leverage is costly and consumes a large share of the asset class’s potential excess return. When coupled with the typical fee structure of private credit, the investor’s upside to these levered assets is further eroded.
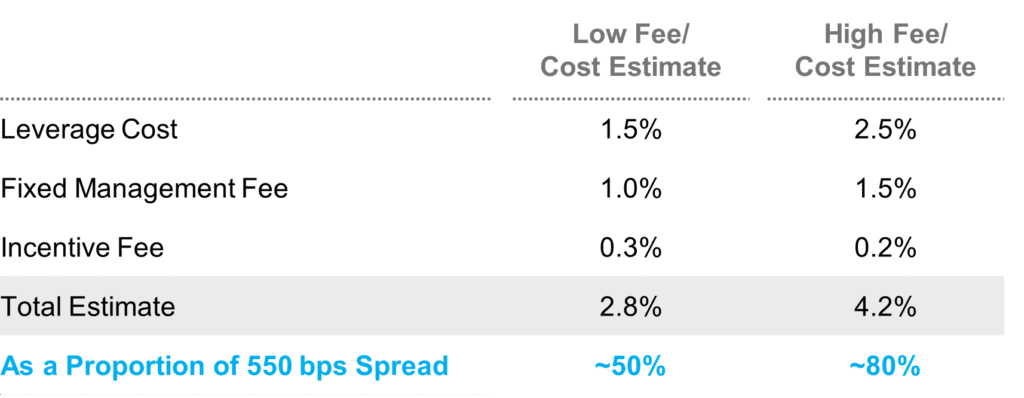
A stylized example demonstrates this dynamic, assuming the following costs/fees[2]
- Leverage cost: SOFR + 150-250 bps annually[3]
- Management fee: 100-150 bps on gross assets[4]
- Incentive/carry: 10-15% of net return (subject to hurdle structures)[5]
Assuming an average direct lending spread of SOFR + ~550 bps, these costs can absorb ~50–80% of the spread on levered assets before default losses.
Figure 1: Estimating the Cost of Leverage for Private Credit Funds
Empirical Estimates of the Cost of Private Credit Leverage
Comparing historical BDC results with direct lending indices, after adjusting for pricing conventions, corroborates that a large share of incremental performance from effective leverage is consumed by financing costs and manager fees. The table below takes publicly traded BDC returns and adjusts them for market price-to-book value variations. That is, in each period, the price of the BDC is adjusted so that its market value equals the reported book value of the underlying loans, minus the book value of any fund–level borrowing. This adjusted return series can then be compared with the unlevered, book value direct lending return series. Since there is a significant, albeit imperfect, overlap in the underlying loans of these two indices, we believe that comparing them provides a reasonable estimate of the BDCs’ net return from leverage. Though the return from leverage has been positive, it is a relatively paltry portion of the underlying loans’ average spread over this period. For example, if the average spread on private credit had been 600 bps over the past 10 years, investors have netted only 1.7% of this spread, leaving ~72% to escape due to leverage costs and management fees. This empirical result is very much in line with our pro forma estimates above and, notably, occurred in a very benign credit environment. Higher prospective default rates would only worsen this outcome for investors.
Figure 2: Estimating the Excess Return From Leverage

The cost of structural leverage is so high, in fact, that if investors could only choose between a levered private credit vehicle and a liquid alternative based on high-yield instruments,[6] it is readily apparent that they should choose the latter. The table below compares the return of the Cliffwater BDC Index (CWBDC) with a portfolio consisting of a physical investment in the high-yield market, hedging out the associated Treasury rate exposure, and then adding a 100% notional exposure in the HY CDX to replicate the one turn of BDC leverage. This levered high-yield solution has outperformed the CWBDC by 2-3% over the past 10-20 years.
Figure 3: Estimating the Excess Return of Levered High Yield Relative to BDCs

In short, the fund’s structural leverage is so painfully expensive that using it forgoes the entire benefit of the direct lending illiquidity premium—and then some. But there are alternatives.
For many asset owners—especially those already operating multi‑asset portfolios with derivative capabilities—deploying leverage in other asset classes: 1.) frees up capital to invest in unlevered private credit and 2.) utilizes a liquid, less expensive form of leverage—and one that is under the investor’s precise control. For example, consider an investor who desired a 5% allocation to a traditional private credit vehicle that utilized one turn of leverage. That is, they were seeking 10% of gross exposure to private credit loans. Embedded in this approach is a financing cost of, say, SOFR +200 bps. Alternatively, they could invest 10% in unlevered private credit by selling 5% of their public equity allocation and replacing it with 5% exposure to equity derivatives. With equity derivatives financing around SOFR + 70 bps, this second approach delivers an additional 130 bps of return on this 5% allocation![7]
A Public/Private Solution
If a private credit manager offers an unlevered version of their strategy, an investor can build a far more efficient levered strategy by combining it with a HY CDX overlay, assuming the investor desires an incremental turn of leverage. In this case, the investor commits to the unlevered private credit fund and adds 100% notional to the HY CDX. This approach avoids incurring the fund‑level financing costs and manager fee structure that significantly erode returns from leverage. In addition, the overlay can be quickly and cheaply adjusted as conditions change. The table below shows how an illustrative investment in the Cliffwater Direct Lending Index (CDLI) + 100% notional in HY CDX[8] would have performed historically.[9]
Figure 4: Estimating the Returns of Private/Public Solution

The absolute magnitude of the returns above is a strong indication of the strategy’s attractiveness. For reference, the S&P 500 returned only 11.0% over the last 20 years! While the above data is what an investor would have hypothetically experienced over the horizon, we have indeed mixed apples with oranges. Specifically, we have combined a book-value index (CDLI) and a market-value index/instrument (HY CDX).
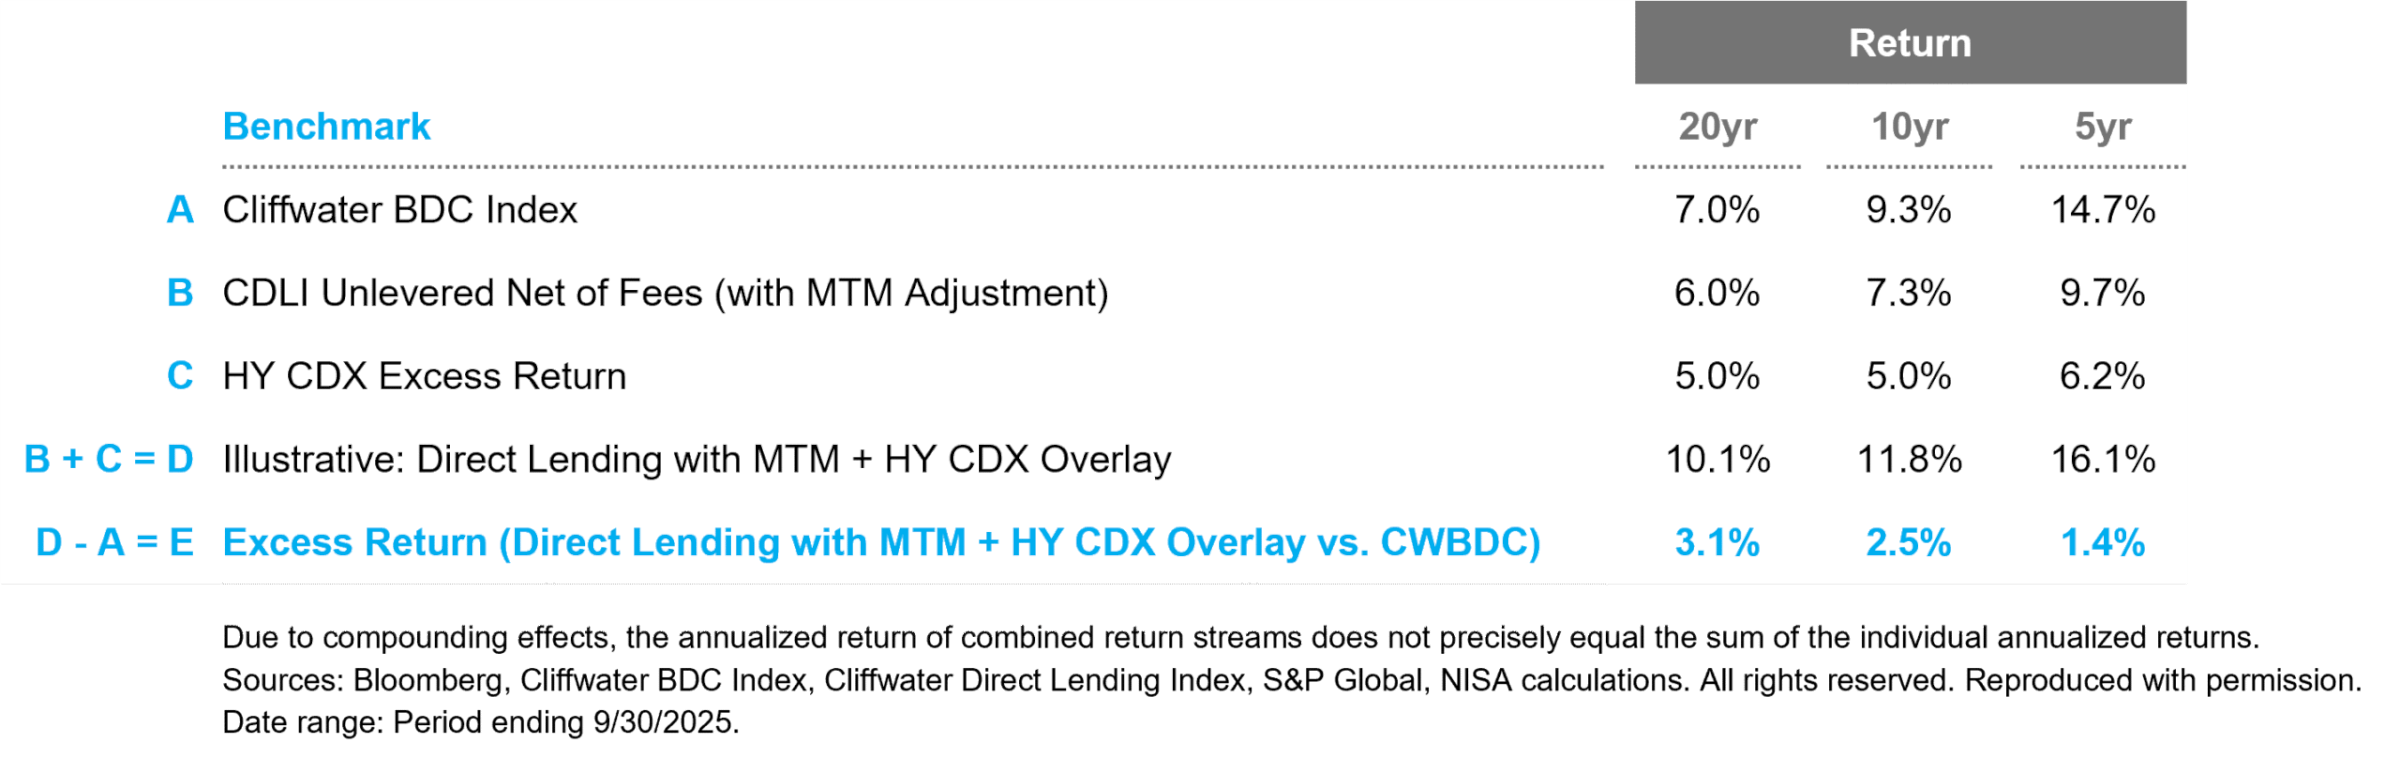
Once again, we need to make adjustments to provide a more useful assessment. The table below first uses the price/book movements in the Cliffwater BDC index to create an MTM estimate of the unlevered, direct lending strategy.[10] With that, we can then add the HY CDX overlay to get a fully MTM time series. Comparing this combined series to the similarly levered Cliffwater BDC index provides a meaningful comparison of the two approaches to levered private credit. And there is a clear winner: unlevered private credit (CDLI) + HY CDX.
Figure 5: Excess Return of Public/Private Solution vs. BDCs
The result is a portfolio that preserves the best of both worlds—the illiquidity premium of private loans while deploying leverage where it is cheapest and most liquid.
The Performance Drag of Leverage is Also Real
Private credit markets offer investors an attractive return profile—one that has exceeded comparable public markets on an unlevered basis. Unfortunately, many of the most common vehicles employ structural leverage, which materially erodes returns through financing, debt servicing and fee drag. Based on our estimates, this approach likely robs the investor of the asset class’s inherent attractiveness—its illiquidity premium. But investors have alternatives. Unlevered private credit with HY CDX offers the benefits of both worlds—the illiquidity premium of direct lending and the inexpensive leverage of CDX. Alternatively, high yield with one turn of leverage via CDX is a fully liquid and reasonable alternative as well. We will explore this strategy in more detail in our final paper in this series.
“Cliffwater,” “Cliffwater Direct Lending Index,” “Cliffwater BDC Index,” “CDLI,” and “CWBDC” are trademarks of Cliffwater LLC. The Cliffwater Direct Lending Indexes and the Cliffwater BDC Index (the “Indexes”) and all information on the performance or characteristics thereof (“Index Data”) are owned exclusively by Cliffwater LLC, and are referenced herein under license. Neither Cliffwater nor any of its affiliates sponsor or endorse, or are affiliated with or otherwise connected to, NISA Investment Advisors, LLC, or any of its products or services. All Index Data is provided for informational purposes only, on an “as available” basis, without any warranty of any kind, whether express or implied. Cliffwater and its affiliates do not accept any liability whatsoever for any errors or omissions in the Indexes or Index Data, or arising from any use of the Indexes or Index Data, and no third party may rely on any Indexes or Index Data referenced in this report. No further distribution of Index Data is permitted without the express written consent of Cliffwater. Any reference to or use of the Index or Index Data is subject to the further notices and disclaimers set forth from time to time on Cliffwater’s website at https://www.cliffwaterdirectlendingindex.com/disclosures.
[1] For avoidance of doubt, one turn of leverage means for each dollar of invested capital, one additional dollar is borrowed. In Cliffwater’s March 2025 article “No Fee Compression in Private Debt,” they reported an average of 1.11 turns of leverage across participants in their lender survey, consistent with leverage observed in BDCs.
[2] Some investors may also incur unrelated business income tax (UBIT), which would reduce the net spread by an additional 1%, approximately.
[3] Many public and private BDCs issue publicly traded debt that is included in common fixed income benchmarks and provides transparency into the prevailing cost of leverage for private credit vehicles.
[4] Funds typically charge administrative fees in addition to management fees. For simplicity, we are combining these two fee components into an overall estimate of fixed management fees.
[5] The effective incentive fee is calculated by multiplying the respective incentive fee rate by the assumed net return (i.e., spread carry minus leverage cost and management fee).
[6] This may seem like a false choice, which is a rhetorical device that lands on a particularly low circle of author hell. But a given private credit manager may only offer funds that include leverage, in which case, at least with respect to that manager, this is indeed the choice faced by the investor.
[7] We choose to finance the private credit purchase by selling another return-seeking asset, public equities. However, if the investor had an allocation to Treasuries, they could sell 5% of that allocation and replace that exposure with Treasury derivatives that typically finance around SOFR +10-20, thus saving 180 bps.
[8] For the period from 3/31/2007 to 9/30/2025, CDX returns are based on excess return indices published by S&P Global (Bloomberg ticker: CH5LMER5 Index). For the period prior to 3/31/2007, HY CDX returns were estimated using Bloomberg data.
[9] Given the illiquidity of the direct lending investment, some portion of the investment would need to be in liquid investments to provide margin support for the CDX overlay, thus impacting the return. For example, a strategy that invests 80% in direct loans, 20% cash and 120% CDX would have returned 12.3%, 12.1% and 15.2% over the last 20, 10 and five years, respectively.
[10] For this calculation, we assumed all the difference between BDC’s price and book value was attributable to the underlying direct loans. Any economic impact from interest rate moves that affect the value of the leverage source (e.g., fixed-rate leverage) is ignored and believed to be small.