Part 1: The Private Credit Premium is Real
Measuring the Illiquidity Premium
Institutional interest in private credit[1] has expanded meaningfully in recent years, driven by the potential to capture an illiquidity premium and access a broader range of issuers than traditional public capital markets alone can provide. And while it is tempting to join the current raging debate which has concluded that private credit is somewhere between the preordained culprit of the next systemic crisis and the savior to all things financial (e.g., insurance markets, AI’s voracious capital needs, DC investors’ savings shortfalls, etc.), we will muster unusual restraint in this paper and leave that commentary to our banking/PE overlords. Instead, we compare the public high-yield market and the private credit market, not to determine a winner. Rather, we examine how these two markets can work in harmony and complement one another.
Key Takeaways
Our series begins by first assessing the realized excess return to private credit. Three observations are readily apparent.
- Apples-to-apples adjustments matter. To make valuable comparisons between private and public markets, one must adjust for duration, leverage and pricing conventions (e.g., market value vs. book value).[2] Without these adjustments, investors risk conflating structural effects with accurate excess returns.
- Net excess return to private credit (vs. liquid high yield) is meaningful and reasonably persistent. Depending on the period examined and after adjusting for leverage, rate exposure and mark-to-market (MTM) effects, this illiquidity premium[3] has historically delivered an incremental annual excess return of approximately 3% (see Figure 2) over liquid alternatives such as publicly traded high yield bonds.
- Management fees for private credit strategies are material and erode a meaningful portion of the illiquidity premium. After adjusting for fees, private credit has provided a net excess return of approximately 0.5% to 1.5% (see Figure 3), depending on the horizon.
4 Essentials in Comparing Private Credit and Public High Yield
A meaningful comparison between private credit and public high yield requires four key adjustments:
- Duration/Rate Exposure: Private direct lending loans are predominantly floating-rate (e.g., SOFR + spread), while public high-yield indices are largely fixed-rate. Duration adjusting high-yield returns (i.e., neutralizing interest rate exposure differences) allows a fair, rate‑controlled comparison to a floating-rate private credit return time series.
- Leverage: While many private credit vehicles, including business development companies (BDCs),[4] use fund‑level leverage (often around 1x), public high-yield bond indices are generally unlevered. To compare like with like, unlevered public market benchmarks must be levered or a private credit vehicle that is levered must be delevered to a common risk footprint. Fortunately, the Cliffwater Direct Lending Index (CDLI) provides an unlevered, private market index for comparison.
- Pricing Convention: Book value accounting in private debt smooths reported returns relative to those of publicly traded credit securities. Publicly traded instruments, like BDCs, provide the market’s valuation of underlying private credit assets by examining the market price of the security relative to its book value. Adjusting for estimated price/book movements improves the comparability of private and public credit market return series.
- Fees: Management fees for private credit strategies are material. As they are an order of magnitude larger than fees for liquid alternatives, it is critical to report results net of fees to determine the actual, realized excess returns to private credit investors.
These adjustments control for “structural features,” so what remains is a better estimate of the actual economic difference—net excess return from illiquidity and other premia.
Estimating the Illiquidity Premium—Private Credit vs. High Yield
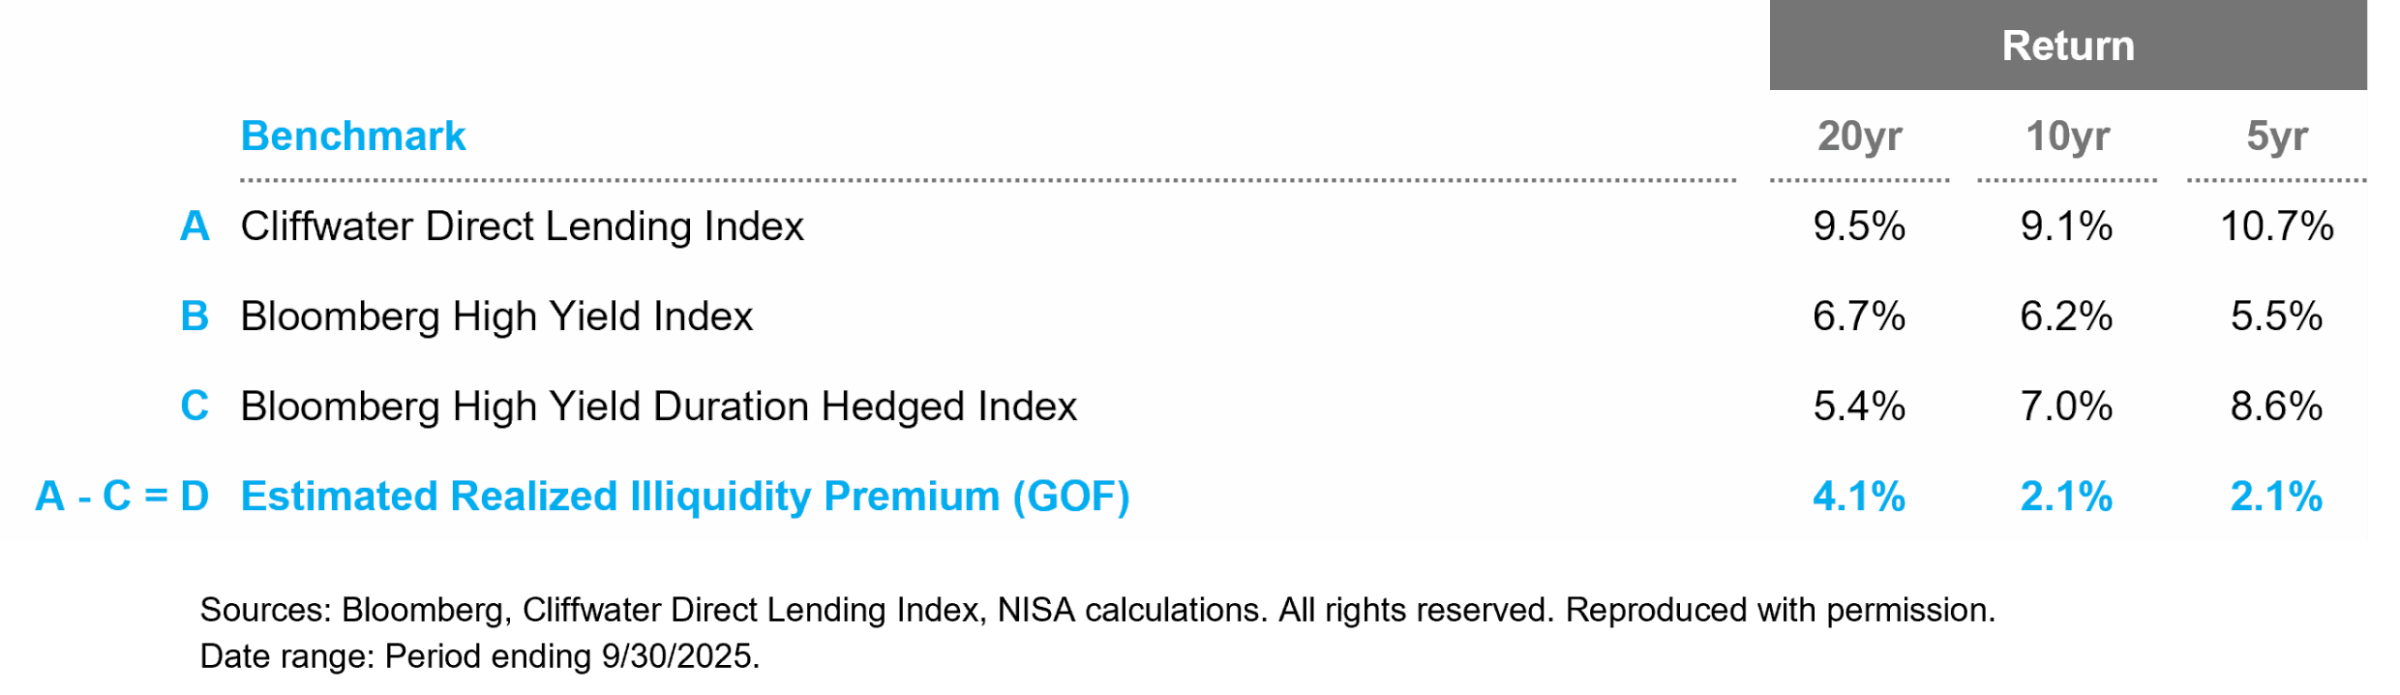
One of the principal motivations for a private credit investment is the potential illiquidity premium relative to the liquid high-yield bond market. We often see comparisons of published private credit indices, such as the CDLI, against the Bloomberg High Yield Index. While duration-adjusting indices is standard (and best) practice when determining the relative excess return of public markets, this step is often ignored when comparing public credit markets to private markets. As mentioned above, private, direct lending tends to be floating-rate (i.e., approximately zero interest rate duration), while many comparable public market debt benchmarks are fixed-rate (e.g., Bloomberg High Yield Index). Accordingly, we take the first step below in Figure 1 and compare the return of the CDLI with a duration-adjusted version of the Bloomberg High Yield Index.
Two key observations stand out. First, there is a meaningful realized illiquidity premium to private credit—we estimate the historical excess return for private credit vs. liquid high yield has been between 2-4% annually, after controlling for interest rate risk. Importantly, ignoring the impact of interest rates could lead to poor conclusions with an understatement of the realized illiquidity premium over the last 20 years by 1.3% and an overstatement in the previous five years by 3.0%.
Figure 1: Estimating the Illiquidity Premium | Duration Adjusted
Second, equally essential is controlling for pricing conventions (e.g., book value accounting vs. observed market prices).
One often touted benefit of private markets is lower volatility relative to comparable public market investments. As a born-and-raised public market firm, we would suggest that this is an artificial construct of not marking to market positions in all but extreme situations (e.g., impairment). But, playing devil’s advocate, private market advocates would argue that their approach more accurately reflects the true value of the investment rather than the vicissitudes of animal spirits in markets. Here again, we won’t really weigh in, but irrespective of whether you are in “camp market value” or “camp book value,” it should be readily apparent that comparing the two return profiles is fraught with issues. Specifically, public market instruments’ price movements reflect changing investor risk preferences—that is, the compensation demanded to accept a particular economic risk, and in markets such as middle-market private credit or high yield, these changes in the demanded risk premium can be material.
Fortunately, we have publicly traded BDCs that provide a measure of the market’s reassessment of the perceived credit risk and the demanded risk premium for private credit over time. If we compare a BDC’s traded price to the book value of its underlying assets adjusted for the BDC’s leverage, we can recover the MTM value of the underlying private credit loans. Using this valuation adjustment will enable a fairer comparison of returns between private and public markets across any horizon.
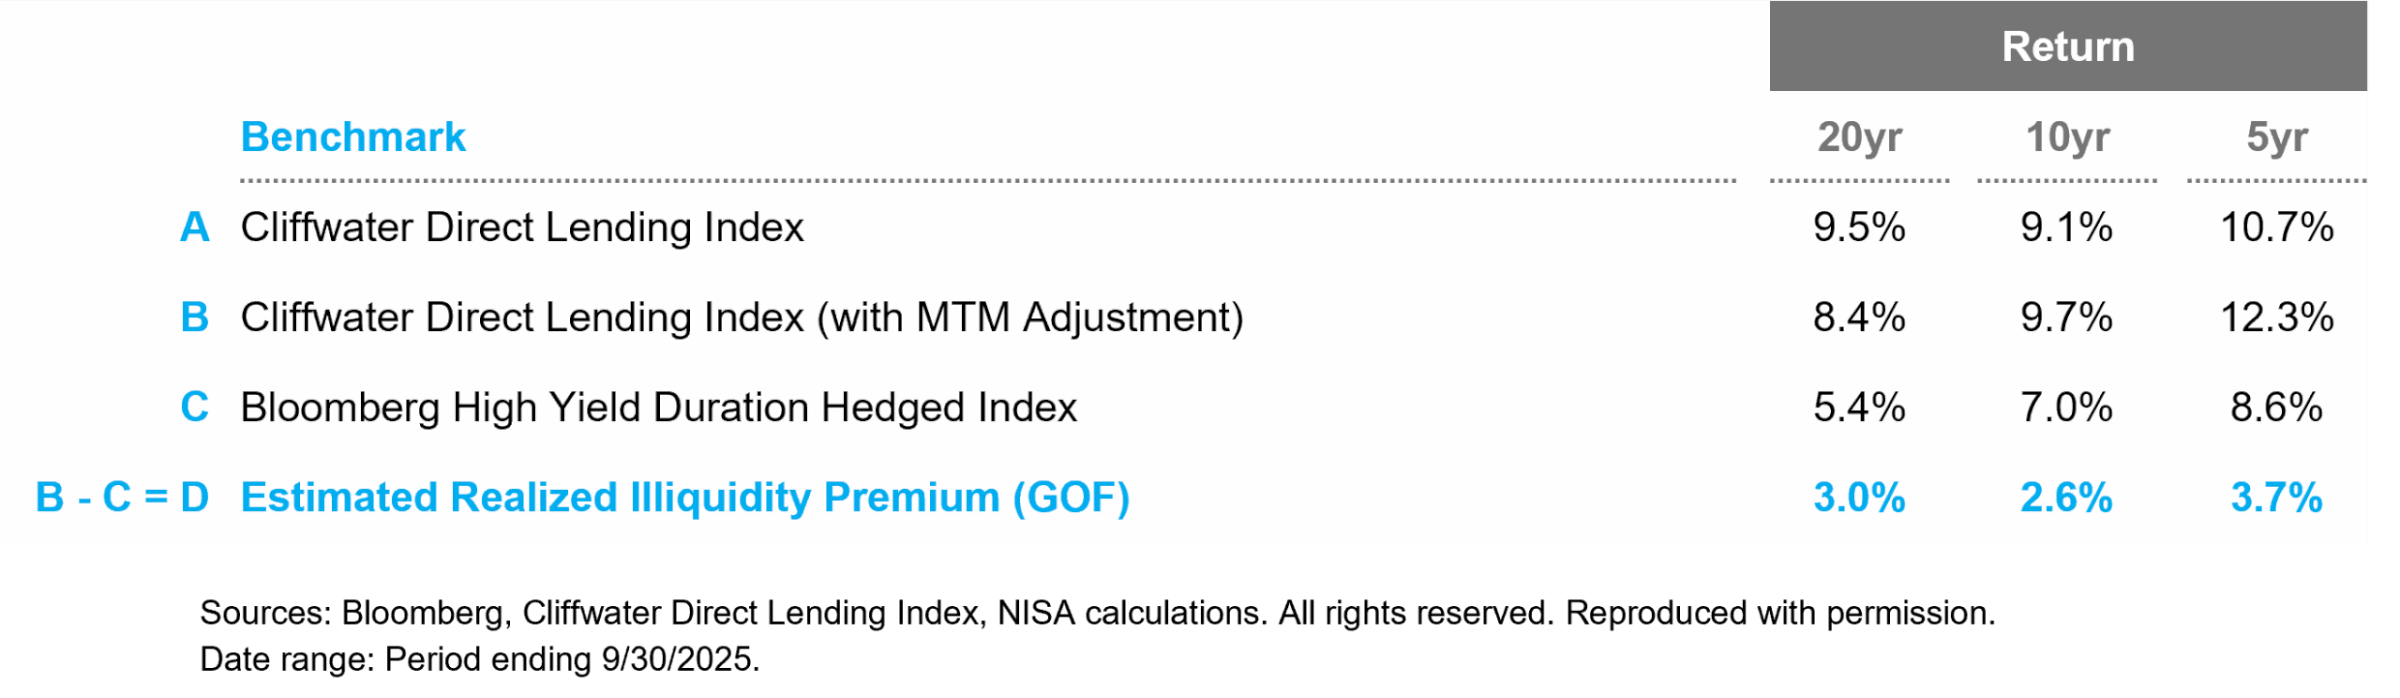
Figure 2 below uses the price/book movements on publicly traded BDCs, to create an estimated MTM, unlevered direct lending return series.[5] Comparing this price/book-adjusted index to the duration-adjusted high yield benchmark provides a more robust estimate of the realized illiquidity premium, ranging from 2.6-3.7% across 5-, 10- and 20-year horizons. Again, failing to make this pricing convention adjustment would result in an overstatement of the illiquidity premium in the previous 20 years of 1.1% and an understatement of the premium over the last five years of 1.5%.
Figure 2: Estimating the Illiquidity Premium | Duration and Price/Book Adjusted
The Private Credit Premium is Real. But so are the Fees.
Given the idiosyncratic nature of the asset class, private credit can be accessed only through active management with its associated fees. Accordingly, it’s important to determine what portion of the illiquidity premium is actually captured, net of fees. In Figure 3, we instead use the returns of the CDLI Unlevered Net of Fees.[6]
Figure 3: Estimating the Fee Impact
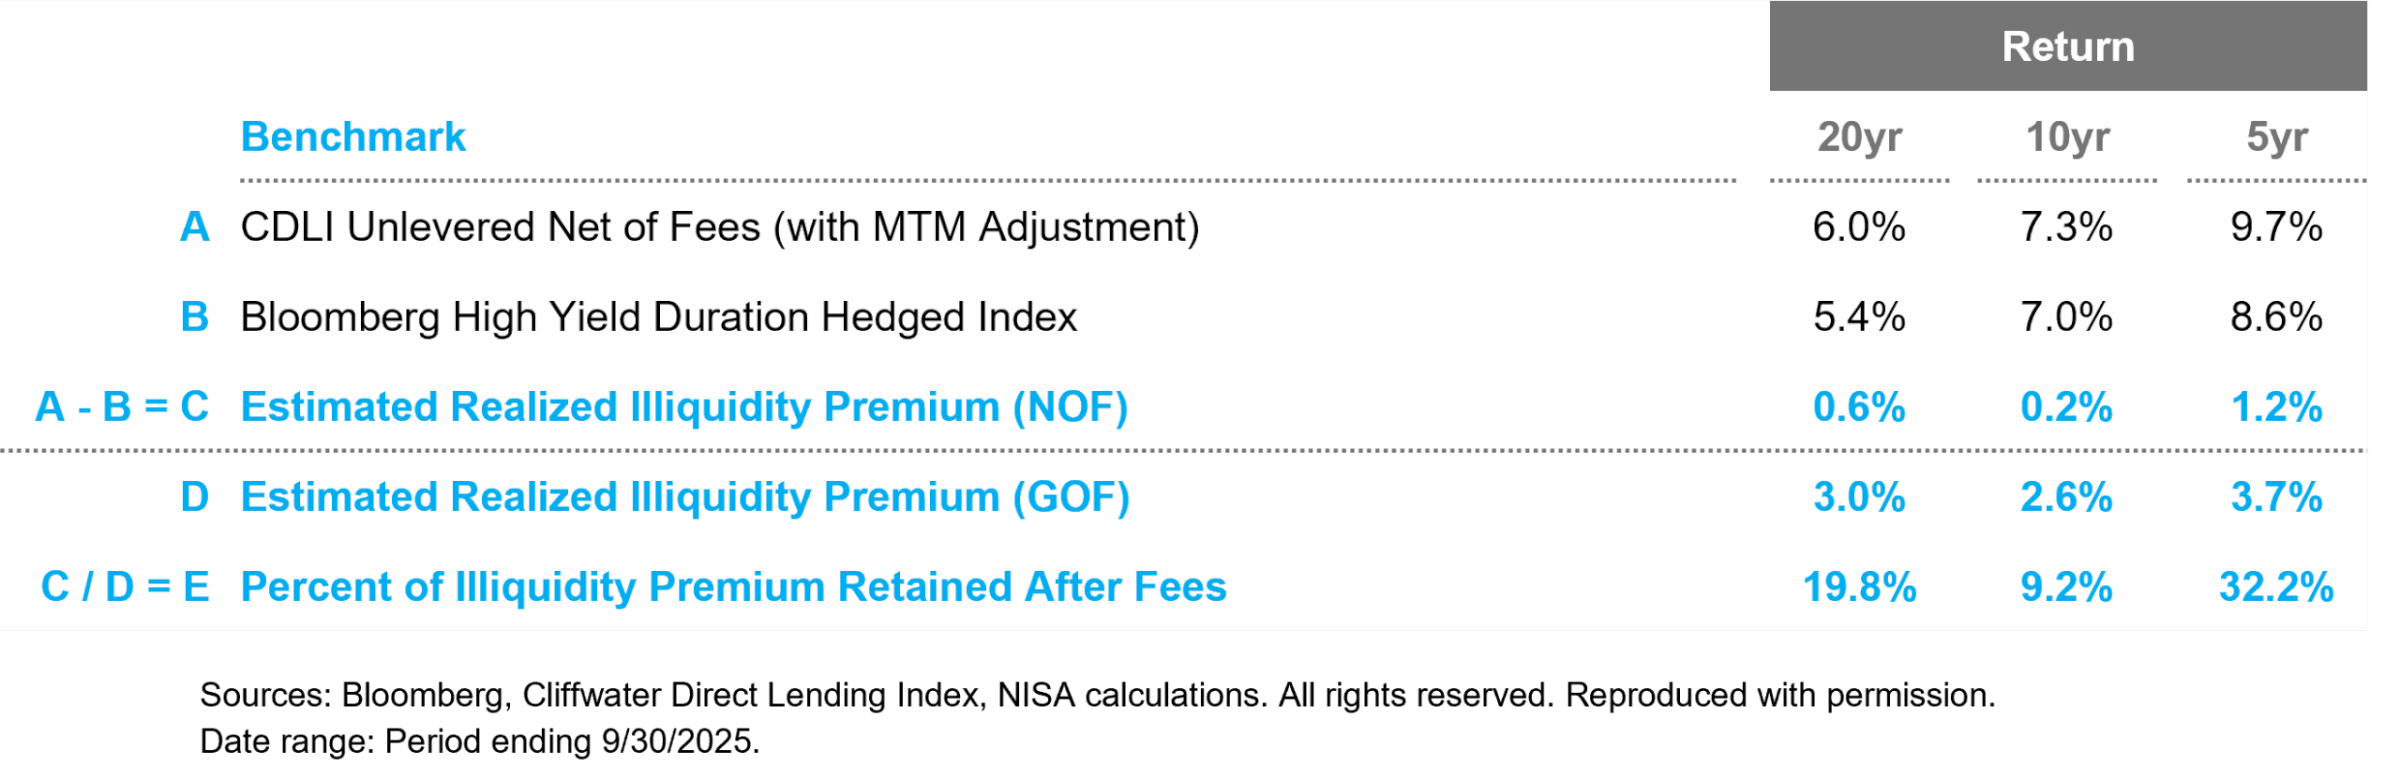
The realized illiquidity premium falls sharply after adjusting for fees. For example, over the last 20 years, private credit has only outperformed high yield by approximately 60 bps. Perhaps what is most striking is the relatively paltry portion of the premium retained by investors after fees. Depending on the horizon, only 9-32% of the illiquidity premium accrues to the end investor.
It is important to note that institutional investors may be able to negotiate lower fees than those embedded in BDCs. Additionally, reported fees have fallen modestly over this period. And finally, while passive solutions do exist for high-yield bond exposure, their fees are not immaterial in this analysis.[7] Accordingly, when taken all together, one could argue that the realized illiquidity premium was perhaps 25-75 bps higher than the estimates reported above.
Conclusion
Private credit has provided an attractive return premium over comparable credit quality public credit markets, though management fees take a large portion of this realized premium. Specifically, we estimate that unlevered, direct lending has outperformed the public high-yield market by approximately 3% gross of fees over the last 20 years after adjusting for differences in duration and pricing conventions. Net of investment management fees, the excess return falls to 60bps over this same period.
One caveat to investors, though, is that most private credit vehicles utilize structural leverage. BDCs and private credit funds often employ approximately one turn of leverage at the vehicle level. The borrowing costs of this leverage, when coupled with relatively high fees in private credit funds, create a meaningful drag on potential performance. Our next paper will explore this dynamic, estimate its impact and provide liquid, less expensive leverage alternatives.
“Cliffwater,” “Cliffwater Direct Lending Index,” and “CDLI” are trademarks of Cliffwater LLC. The Cliffwater Direct Lending Indexes (the “Indexes”) and all information on the performance or characteristics thereof (“Index Data”) are owned exclusively by Cliffwater LLC, and are referenced herein under license. Neither Cliffwater nor any of its affiliates sponsor or endorse, or are affiliated with or otherwise connected to, NISA Investment Advisors, LLC., or any of its products or services. All Index Data is provided for informational purposes only, on an “as available” basis, without any warranty of any kind, whether express or implied. Cliffwater and its affiliates do not accept any liability whatsoever for any errors or omissions in the Indexes or Index Data, or arising from any use of the Indexes or Index Data, and no third party may rely on any Indexes or Index Data referenced in this report. No further distribution of Index Data is permitted without the express written consent of Cliffwater. Any reference to or use of the Index or Index Data is subject to the further notices and disclaimers set forth from time to time on Cliffwater’s website at https://www.cliffwaterdirectlendingindex.com/disclosures.
[1] Private credit is far from a monolithic asset class. Throughout this paper, we define private credit as middle-market direct loans as these constitute the preponderance of securities in private credit indices.
[2] And ideally, credit quality. Unfortunately, the relative opaqueness of private credit makes this difficult to do with any precision. A range of sources suggests private credit’s credit quality, as proxied by debt/EBITDA, is comparable or slightly lower than the high-yield market.
[3] While we use the illiquidity premium throughout, there are likely other sources of potential return premiums. For example, there could also be a size premium as middle-market issuers, on average, are considerably smaller than high-yield issuers, as measured by EBITDA.
[4] A BDC is a publicly traded entity that provides capital to small- and mid-sized U.S. companies creating an opportunity for retail investors to access private market investments in a public market security.
[5] CDLI levels were multiplied by the estimated price-to-book value ratio of the underlying loans of publicly traded BDCs to create a MTM version of the index. This price-to-book ratio is calculated by taking the total asset value of available BDCs and adding the difference between the market cap of the BDCs and their net asset value to determine the implied market value of the underlying loans.
[6] Cliffwater publishes CDLI Unlevered Net of Fee returns beginning with Q3 of 2013. For periods prior to Q3 2013, we assumed a quarterly fee equal to the average fee observed from Q3 2013–Q3 2025 (58 bps).
[7] In the spirit of apples-to-apples comparisons, it should be noted that the duration-adjusted high-yield return series does not include a fee assumption. Passive high-yield products listed in eVestment’s database have management fees ranging from 18-22 bps, while ETFs such as USHY, JNK, and HYG have expense ratios of 8 bps, 40 bps and 49 bps, respectively.