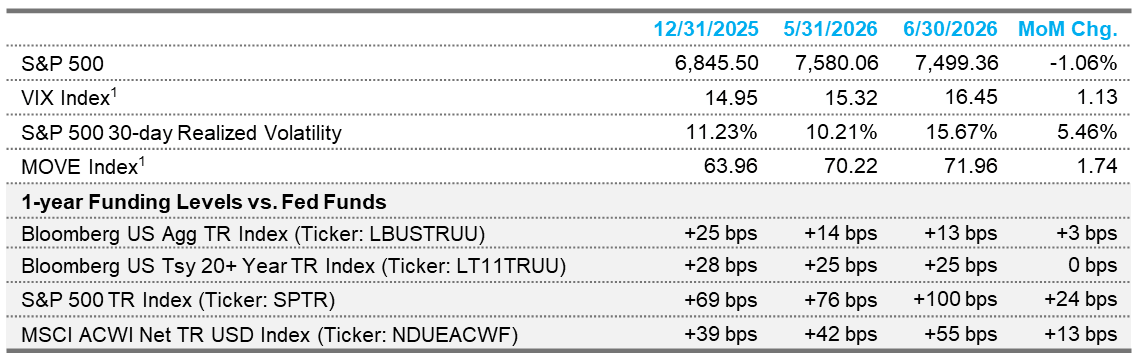
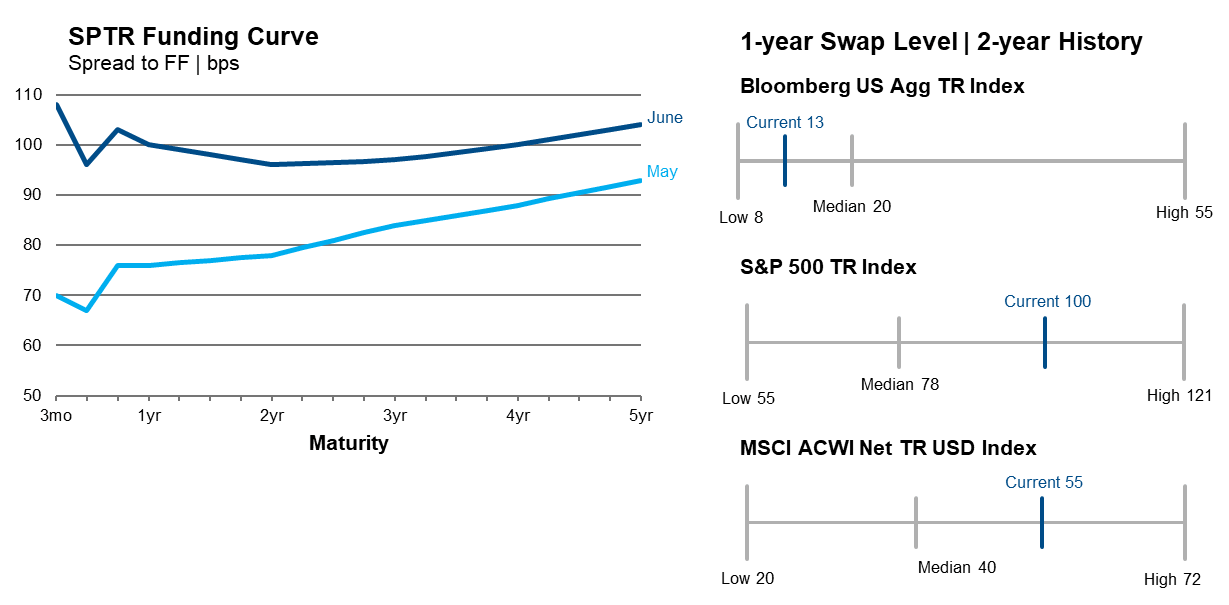
Equity and fixed income financing levels continued to diverge, as equity financing costs increased month-over-month while fixed income indices remained stable. One-year funding levels in equities are trading above their two-year medians. The U.S. equity funding term structure inverted in June, driven by extreme moves in near-dated tenors, as SPTR traded at the highest levels seen outside of year-end.
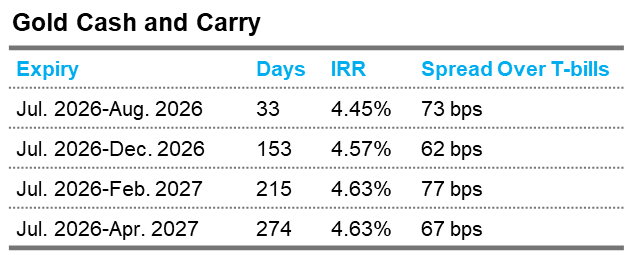
Cash-and-carry strategies seek to earn a positive financing spread after adjusting for carrying costs. The strategy buys a near-dated futures contract (e.g., July 2026) with the intent of taking delivery of the physical asset and sells a far-dated futures contract. The financing levels in the table account for the storage costs associated with taking physical delivery of gold.
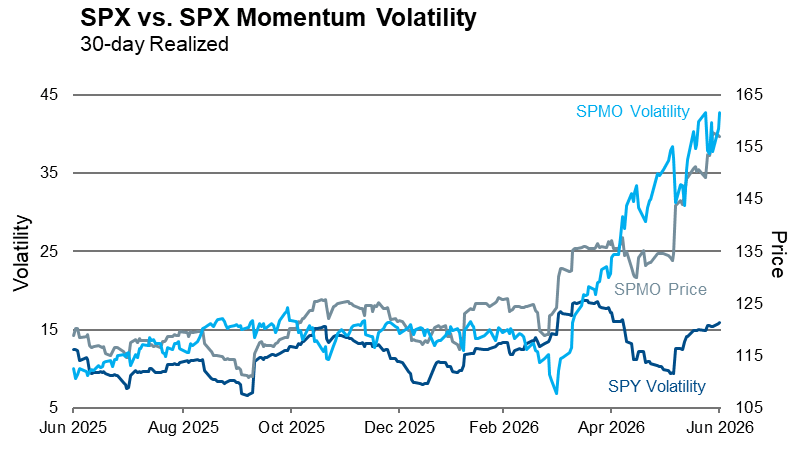
The Invesco S&P 500 Momentum ETF (SPMO), which tracks the S&P 500 Momentum Index, has delivered a year-to-date return of 36%, making it the highest performing factor in the S&P 500 over the period. The momentum factor is an investment factor predicated on the principle that recent outperformers tend to exhibit return persistence while recent underperformers continue to lag. The factor has been the primary beneficiary of the market’s concentrated rotation into AI and AI infrastructure names.
Notably, a divergence has emerged between the realized volatility of SPMO and the broader S&P 500 index. Historically, the realized volatility spread between the two has averaged approximately 6 volatility points; in June, this spread widened to nearly 25 points, the 100th percentile on a one-year lookback. With both returns and volatility increasingly driven by concentrated exposure to a narrow set of AI-related names, any shift in sentiment for this sector could become a material source of downside pressure.
The SpaceX (SPCX) IPO in June represented the largest IPO ever brought to market and carries potentially wide-ranging implications for portfolios. While SPCX will not be eligible for inclusion in the S&P 500 until 2027, it was fast-tracked for inclusion in several other major indices, notably the Russell 1000 and MSCI USA.
For portfolios that use S&P 500 instruments as a hedge against either a Russell 1000 or MSCI USA benchmark, the inclusion of SPCX could introduce incremental tracking error. Based on our analysis, we estimate a near doubling of tracking error in the coming months due to index composition divergence driven by the increasing weight of SPCX.
![]()
Additionally, listed options began trading on June 16, two days after the IPO started trading. The option market developed quickly and has been relatively liquid, reaching 2mm contracts of open interest in just seven trading days. Both listed and OTC options provided an effective avenue for enacting hedges. The SPCX listing has provided valuable insights into the hedging landscape for future mega-cap IPOs; however, it is important to note that the observed liquidity dynamics may not be representative of future IPOs.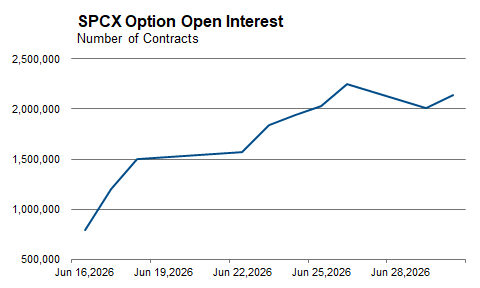
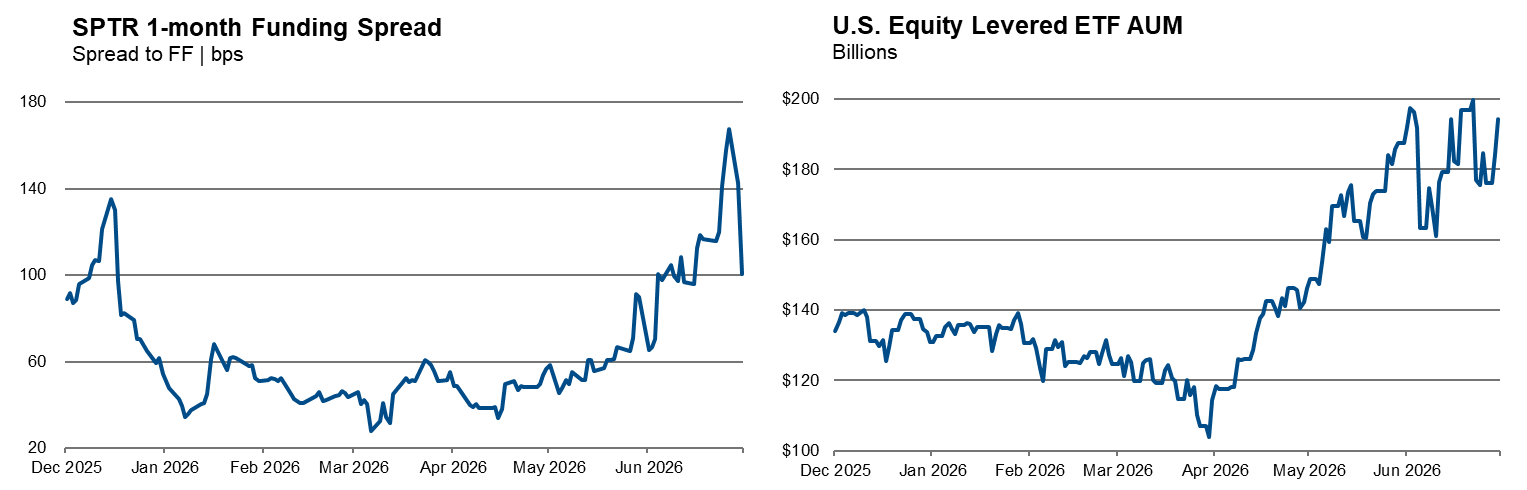
Equity financing rates had been trending higher since mid-April and moved sharply higher in June, reaching record levels outside of year-end. Historically, financing levels have been highest heading into the end of the year as banks charge higher spreads for balance sheet usage over year-end; however, levels in June were higher than those seen at the end of 2025. The dislocation in June was likely driven by a confluence of factors: strong demand for equity leverage as the SPX traded at all-time highs, the record-breaking SpaceX IPO coming to market and the AUM of US equity levered ETFs nearly doubling since the end of March. Additionally, asset manager SPX futures net positioning reached the 100th percentile on a 10-year lookback, adding further stress to financing markets.
High financing rates increase the cost of maintaining synthetic long exposure, but can also create conditions in which unencumbered cash can earn an enhanced yield. Cash-and-carry strategies are one mechanism through which elevated financing rates have historically been monetized, typically involving a long position in the underlying physical asset offset by a short position in the same asset via futures or swap. Additionally, for portfolios with long equity exposure, elevated financing rates can alter the relationship between synthetic and physical holding costs, shifting the relative attractiveness of each approach.