


Hedge funds often use hurdle rates that are low—and often zero—to measure portfolio performance. Moreover, returns above these hurdle rates incur performance fees that can, at times, exceed 20%. At a minimum, we believe hurdle rates should match the prevailing interest rate; otherwise, investors end up paying performance fees for cash returns. If these returns are indeed true alpha and not beta in disguise, these fees may be justified. However, earning a cash rate is not alpha. So why should a hedge fund manager be able to charge a performance fee for earning returns that can be achieved by simply purchasing a T-bill?[1]
Since the Fed began increasing the Fed funds rate in March 2022, which peaked at 5.33% before settling at an effective rate of 3.64% today, a capital commitment to a hedge fund can earn comparable rates by purchasing a T-bill. For example, a hedge fund with a management fee of 2% and a performance fee of 20% that just bought a 5% yielding T-bill would result in total fees of 2.6% with 2.4%[2] net, assuming no fund or pass-through expenses, paid to the investor. More than half of the total return is consumed by fees, resulting in a negative alpha on a net-of-fee basis, despite achieving a positive absolute return. Of course, if that were all the hedge fund did, investors would eventually leave and those hedge funds would not be in business long. Although with a 2.6% fee for a T-bill return, the hedge fund doesn’t need to be in business long to end up happy!
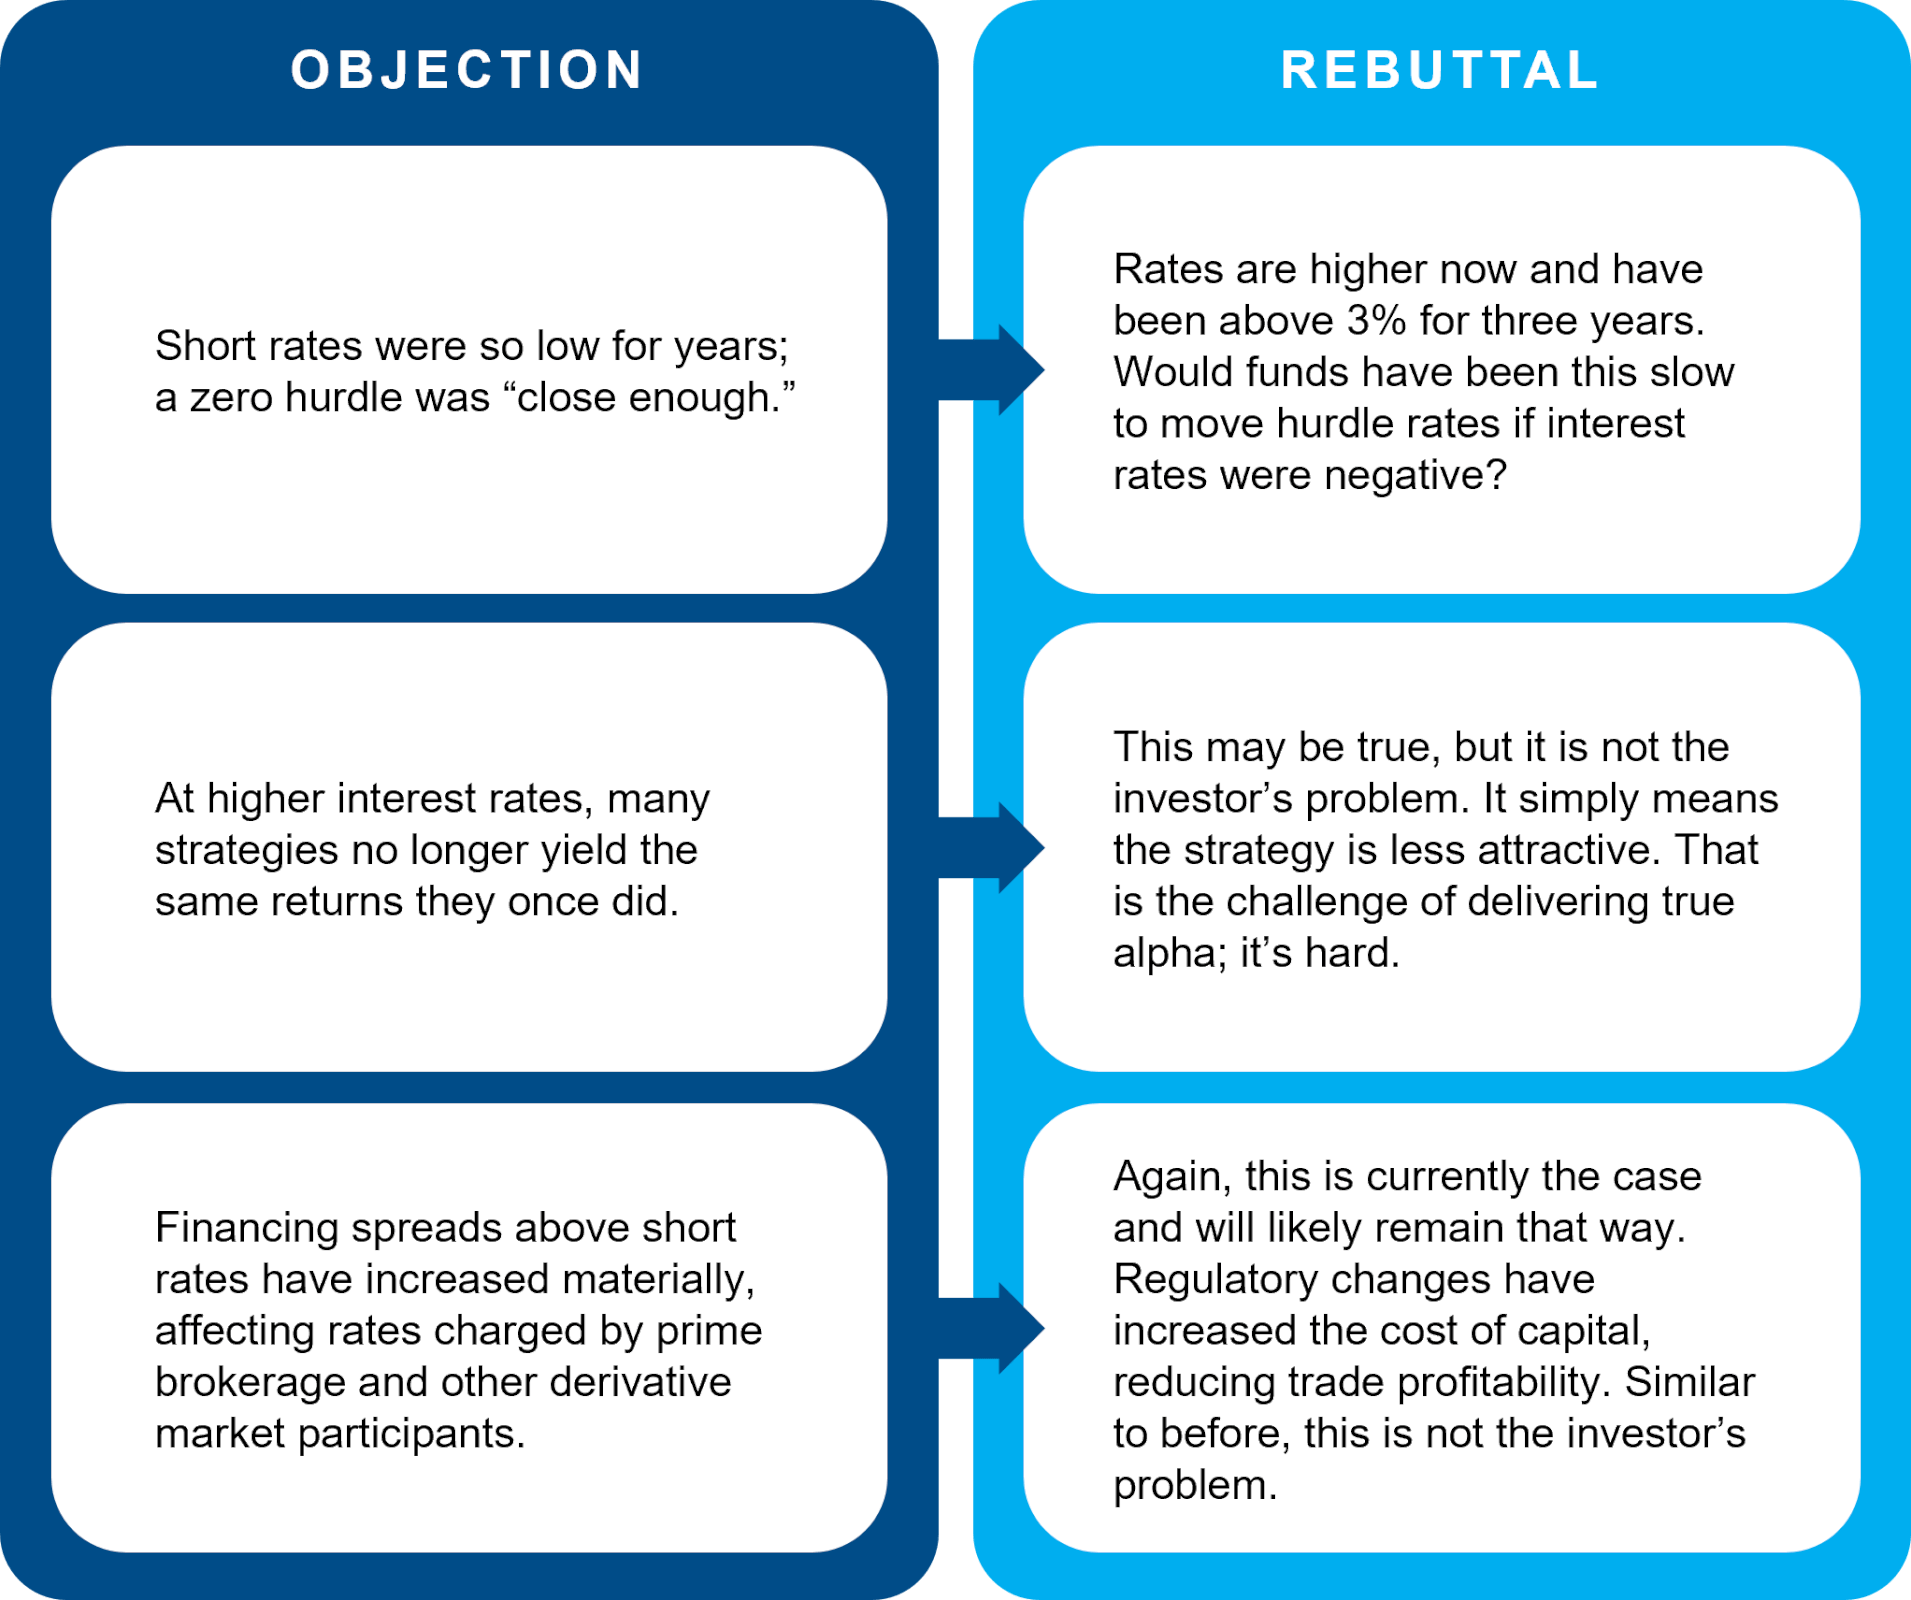
Anecdotally, we have heard a variety of reasons why hurdle rates should be zero or, at the very least, below the T-bill rate. We have yet to hear one that withstands scrutiny. Below are three examples.
Hurdle Rate Objections—and Why They Don’t Hold Up
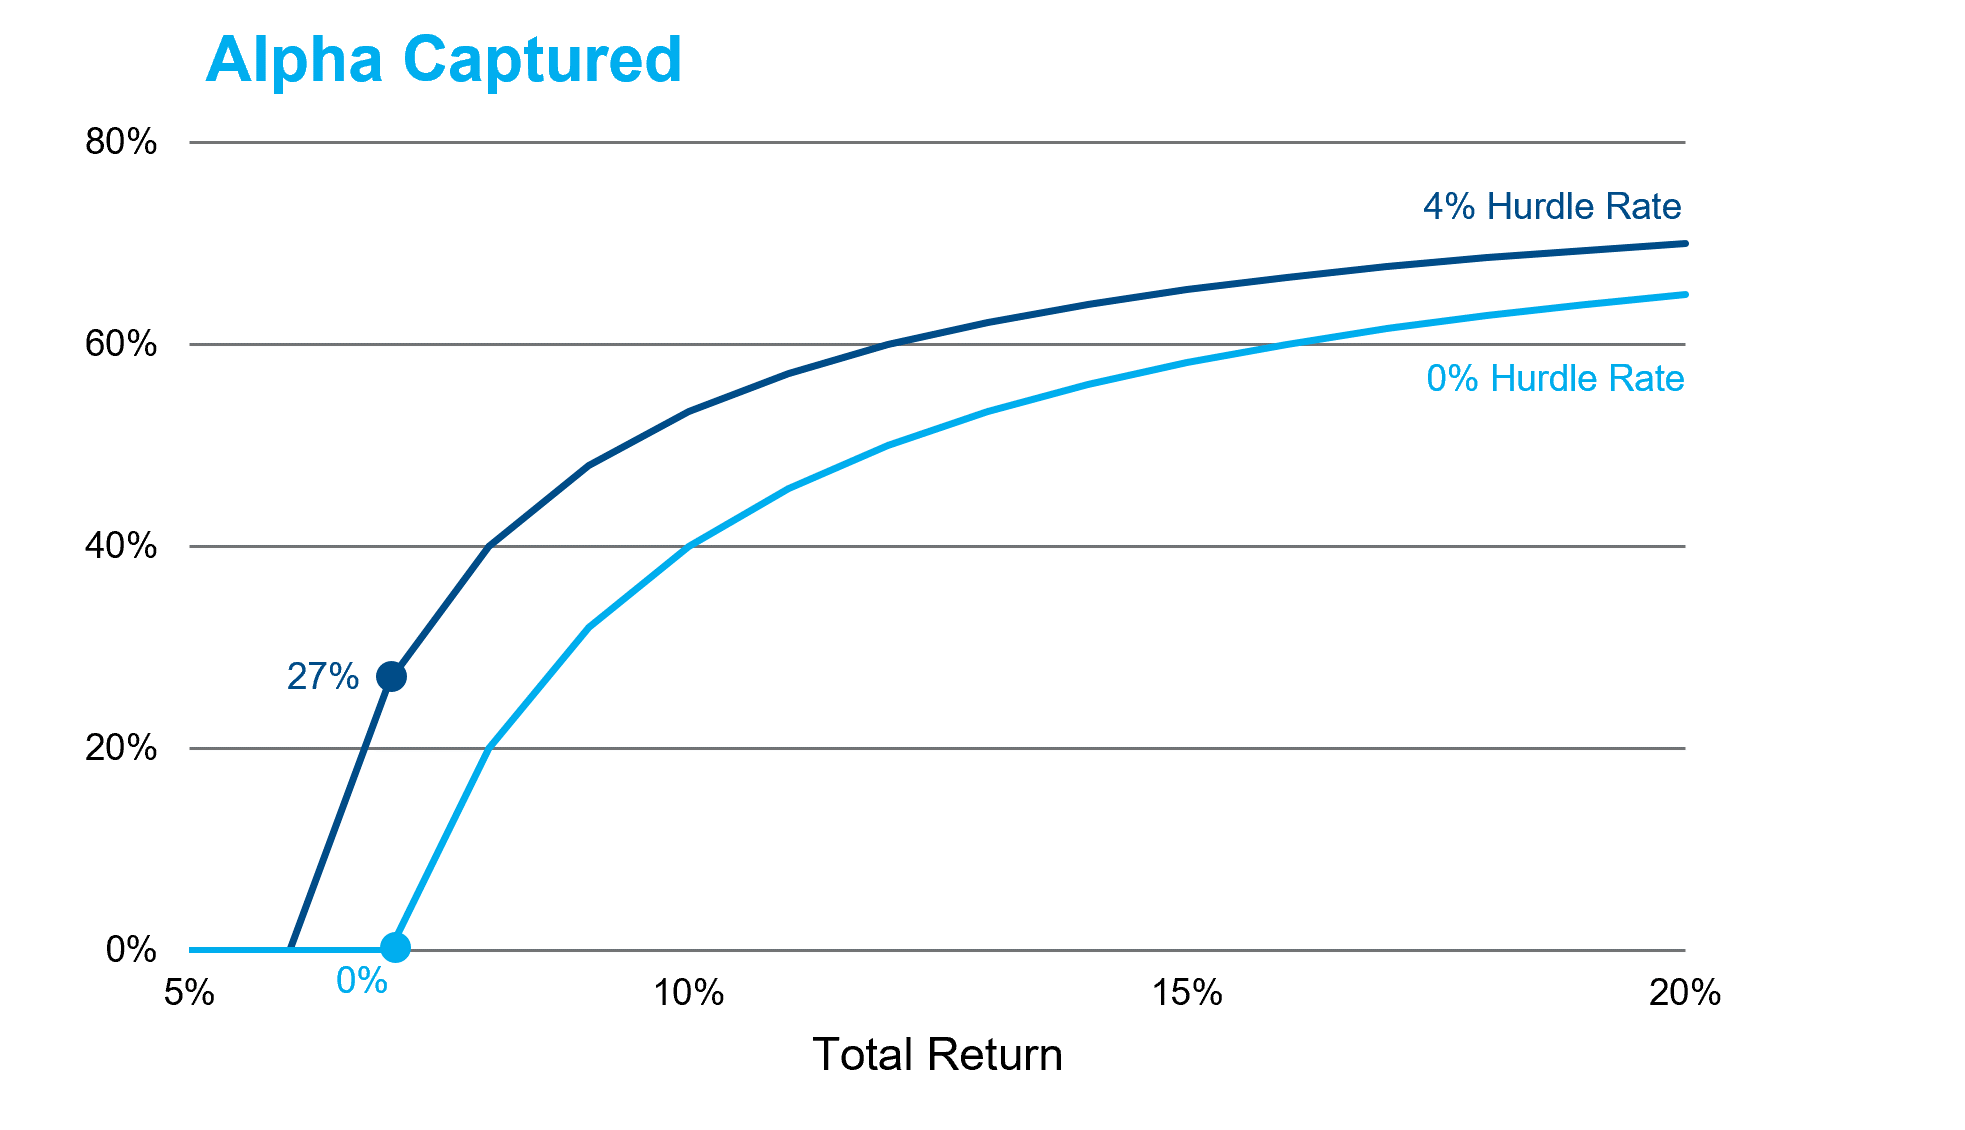
The underlying theme is straightforward: many hedge funds collect performance fees on the cash return, but let’s look at it through a few different lenses. A 0% hurdle rate significantly alters the effective performance fee and the share of investor alpha. Figure 1 shows the impact of different hurdle rates on investor performance, assuming a 2% base management fee and 4% T-bill rate. As depicted, a hedge fund with a 7% total return and a 0% hurdle rate collects 3% in fees (2% base fee + 1% performance fee), leaving investors with zero alpha. Alternatively, setting the hurdle rate to the T-bill yield reduces the performance fee from 1% to 0.2%—a 27% alpha capture ratio (0.8% alpha after fees / 3% gross alpha) for investors.
Figure 1: Zero Hurdle, Less Investor Alpha[3]
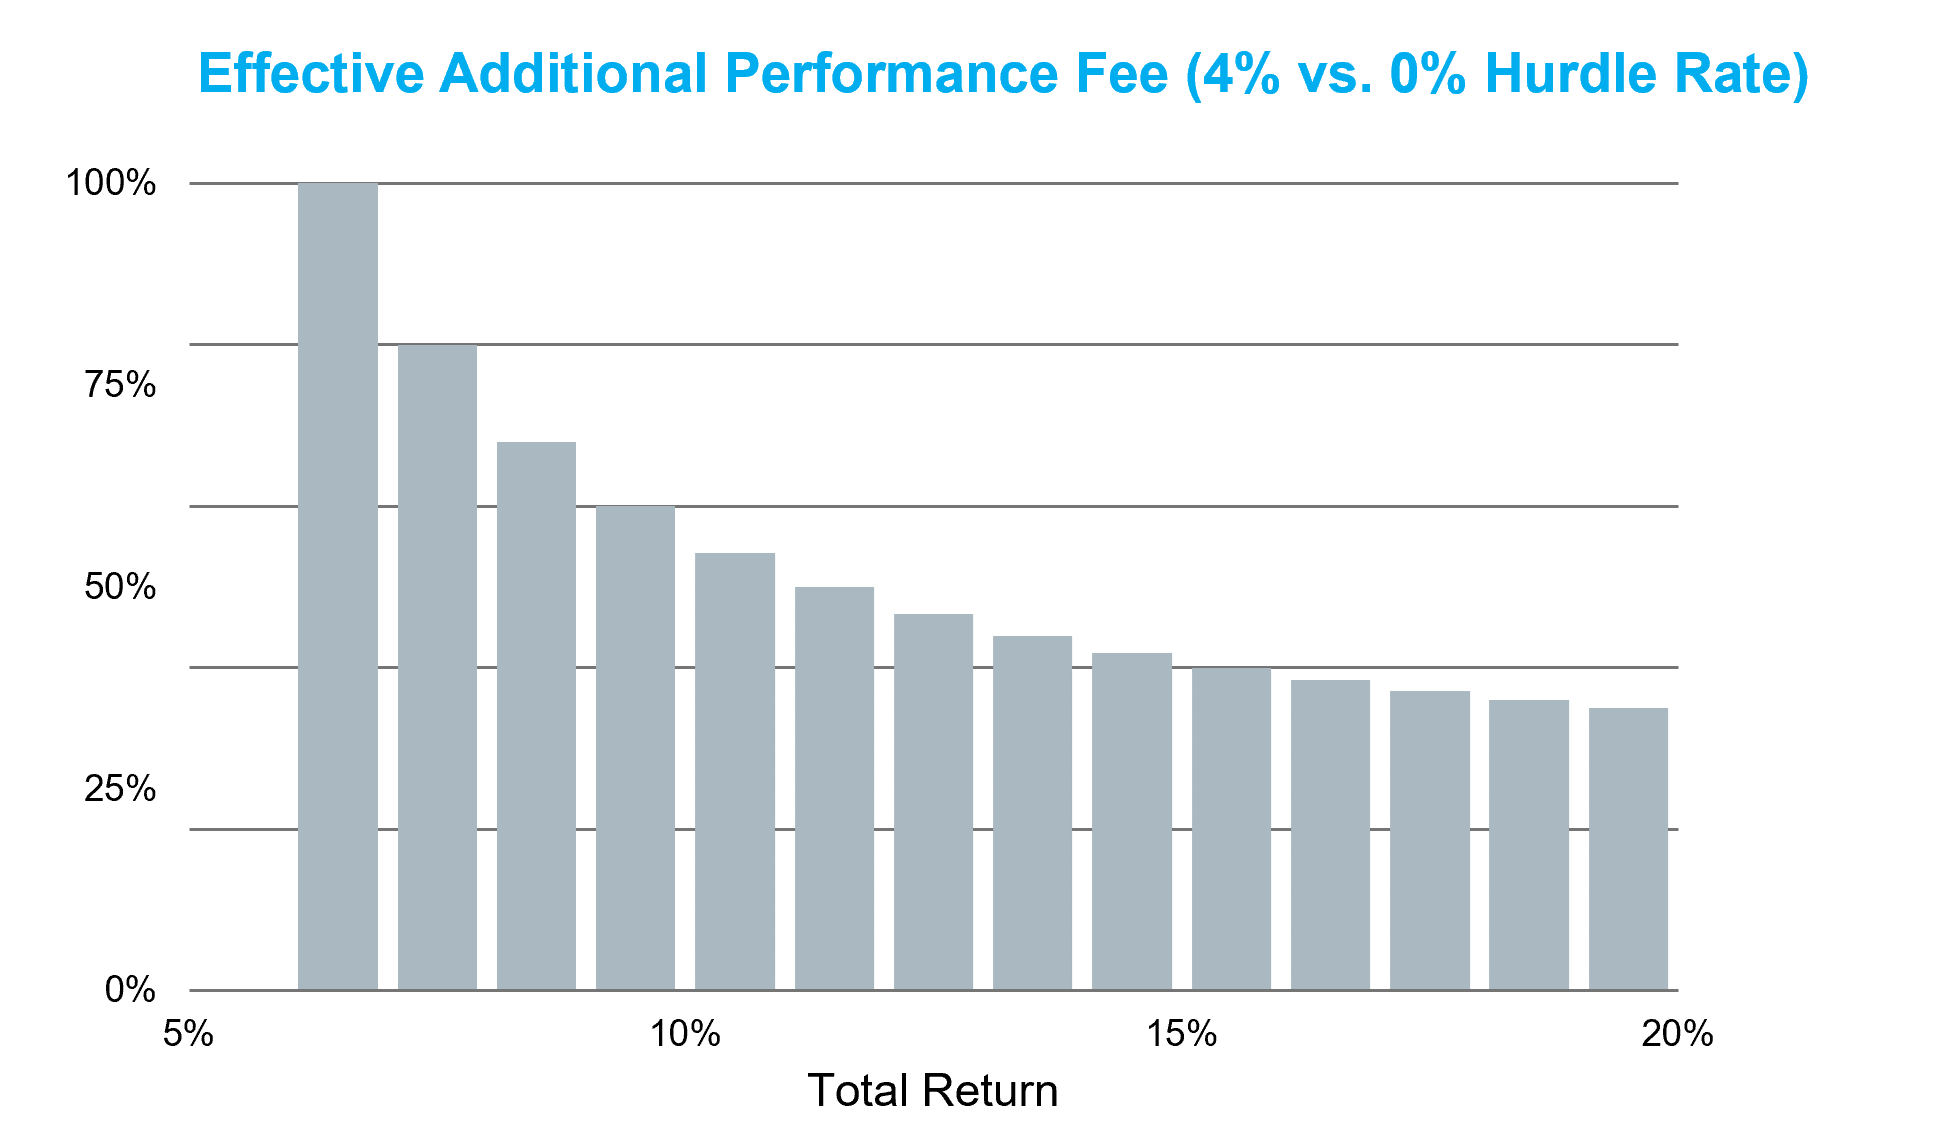
A different lens for viewing hurdle rates is to translate them into an effective performance fee. Figure 2 represents the performance fee that would make hedge fund managers indifferent between a “2 and 20” fee with a 0% hurdle rate versus a “2 and X” fee with a 4% hurdle rate. At a 7% return, the breakeven is a 100% performance fee! At higher returns, the breakeven falls to 25-35%. This wedge represents the impact of a 20% performance fee on the T-bill yield, in our example, 80 bps. An artificially low hurdle rate is just a performance fee in disguise.
Figure 2: The Cost of Easy Performance Targets
As hedge funds seek longer lockups, higher incentive fees and broader pass-through expenses, collecting a performance fee for buying T-bills takes egregiousness to a new level. Moreover, the arguments for low hurdle rates are superficial at best, challenge believability and turn a hedge fund problem into an investor problem. If you are paying performance fees, hedge funds should have to jump at least a little to clear hurdles.
[1] This is well known to many in the allocator community, and actions have been taken to address low hurdle rates. We believe this article provides an additional lens to view the cost of low hurdle rates.
[2] 2% base fee + (3% X 20% performance percentage) = 2.60% total manager fee.
[3] We have intentionally floored the alpha capture ratio at 0%.