Famous investor, academic and author Marty Zweig is credited with coining the phrase “The trend is your friend,” along with “Don’t fight the Fed.” A strategy initially popularized in the Chicago trading pits has today become a strategy not only much researched in academia, but also widely implemented by investment practitioners. Yet Trend apparently runs completely counter to market efficiency. It is a premium that historically delivers positive returns, including at some times when equity markets are in decline. This makes it an intriguing strategy that has the potential to play an important role in investors’ portfolios.
In a recent paper, “Diversification: How diversifying is it really?,” we demonstrated that no one asset class or strategy can be relied upon to deliver positive returns in equity drawdowns. Therefore, we suggested a portfolio of strategies was warranted, including long duration high quality bonds and Trend-following strategies (“Trend”). Trend seems to have a rather uncanny ability to not just hold up during prolonged equity drawdowns, but on occasion, positively thrive. In this paper, we will delve into some possible reasons why Trend has “worked,” and examine the dimensions of a Trend strategy. In a follow-up paper, we will discuss the implementation choices allocators face in building an allocation to Trend strategies.
What is Trend and why has it worked?
Trend-following strategies are structured by taking long and short positions, generally via derivatives, in stocks, bonds, commodity and currency markets in an effort to capture the direction of market movements. In the early days, Trend was implemented using only futures markets, as many strategies still are today, hence the common moniker “Managed Futures.” Following the Commodity Futures Trading Commission (CFTC) requirement that U.S.-based strategies be managed by Commodity Trading Advisors, the tag CTA also became popular and is today used interchangeably with managed futures (as we will also do here). However, while most CTAs are implemented using Trend-following signals, some are wholly discretionary, while others utilize a mix of [largely] mechanical signals. There is also overlap between Global Macro strategies and CTAs, though the former tend to be much more tilted to a discretionary approach. Global Tactical Asset Allocation (GTAA) strategies are more likely to be long-biased, often benchmarked to a 60/40 index. While many of these strategies are offered as private funds, e.g., limited partnerships, some CTA strategies are also available as separately managed accounts or even as listed products, e.g., ETFs, mutual funds etc.
Trend has long been a puzzle in investing as it runs counter to the efficient market hypothesis in its weakest form. Yet, as study after study has shown, whether applied within an individual market or across markets such an apparently simple approach has consistently yielded returns.[1] How can a strategy which simply gets long and short securities or markets based on prices seemingly produce positive risk-adjusted excess return? As we suggested in our diversification paper, a risk or economic argument for the existence of a Trend premium seems to be on shaky ground, given its tendency to perform rather well during prolonged equity drawdowns. As such, the existence of Trend likely comes from a risk beyond economic or market cycle risk – a behavioral risk premium – and therefore, particularly attractive in a portfolio context.
While human rationality is a general underlying assumption in much of finance, it may be hard to believe (and certainly hard to admit) that not everyone, authors included, are completely rational all of the time — at least not rational as defined by an economic text book. Humans, e.g., investors, have a tendency to underreact to new information and then overreact. Behavioral Finance, which marries human psychology to finance, provides some potential explanations for this. For example, humans (and presumably other animals) need time to assess new information as it becomes available and may initially anchor on prior expectations.[2] Additionally, humans exhibit herding behavior, perhaps to minimize the regret of doing worse than their peers. There is also a recognized tendency for investors to cash in winners, but let losers ride, a behavior referred to as loss aversion.
All of these human characteristics represent biases that may explain why Trend strategies may have positive payoffs. While in theory investors are supposed to incorporate new information into market prices instantaneously leading to a so-called “random walk” for prices, each of the behaviors we have highlighted combine to delay price adjustment to new information, prolonging price trends. Anchoring investors underreact to new information then overreact, prolonging a price trend. Herding investors are by definition followers – if the price is going up, they want some of the action and will tend to be buyers. Loss-averse investors may cash in winners early, but hold on to losers. This may delay the impact of positive news on prices on the way up, prolonging a rally and extending a decline as the loss-averse sell toward the end of a given price move. A Trend strategy purely focused on price assumes that past price trends can predict future prices. If prices are falling, Trend investors will be sellers. Trend investors simply don’t (for the most part) care about fundamentals. They mainly look at price. So, we can see that the returns to a Trend strategy are not likely to follow those of a fundamental investor (rational or not) and may indeed at times be negatively correlated.
How much variation is there in Trend strategies?
While the concept of Trend-following seems trivial (if it’s going up, buy it; if it’s going down sell it), it’s rather more complicated than that, as illustrated by the distribution of individual strategy returns in Figure 1. These strategies are current or former constituents of the SG Trend Index, a peer group benchmark of the 10 largest systematic Trend managers open to new investment, rebalanced annually.[3] In many years, the spread between the 25th and 75th percentile strategy has been as much as 10%.
Figure 1: Distribution of Annual Returns of SG Trend Constituents’ Products Reported to Nasdaq eVestment (2014-2023)[4]
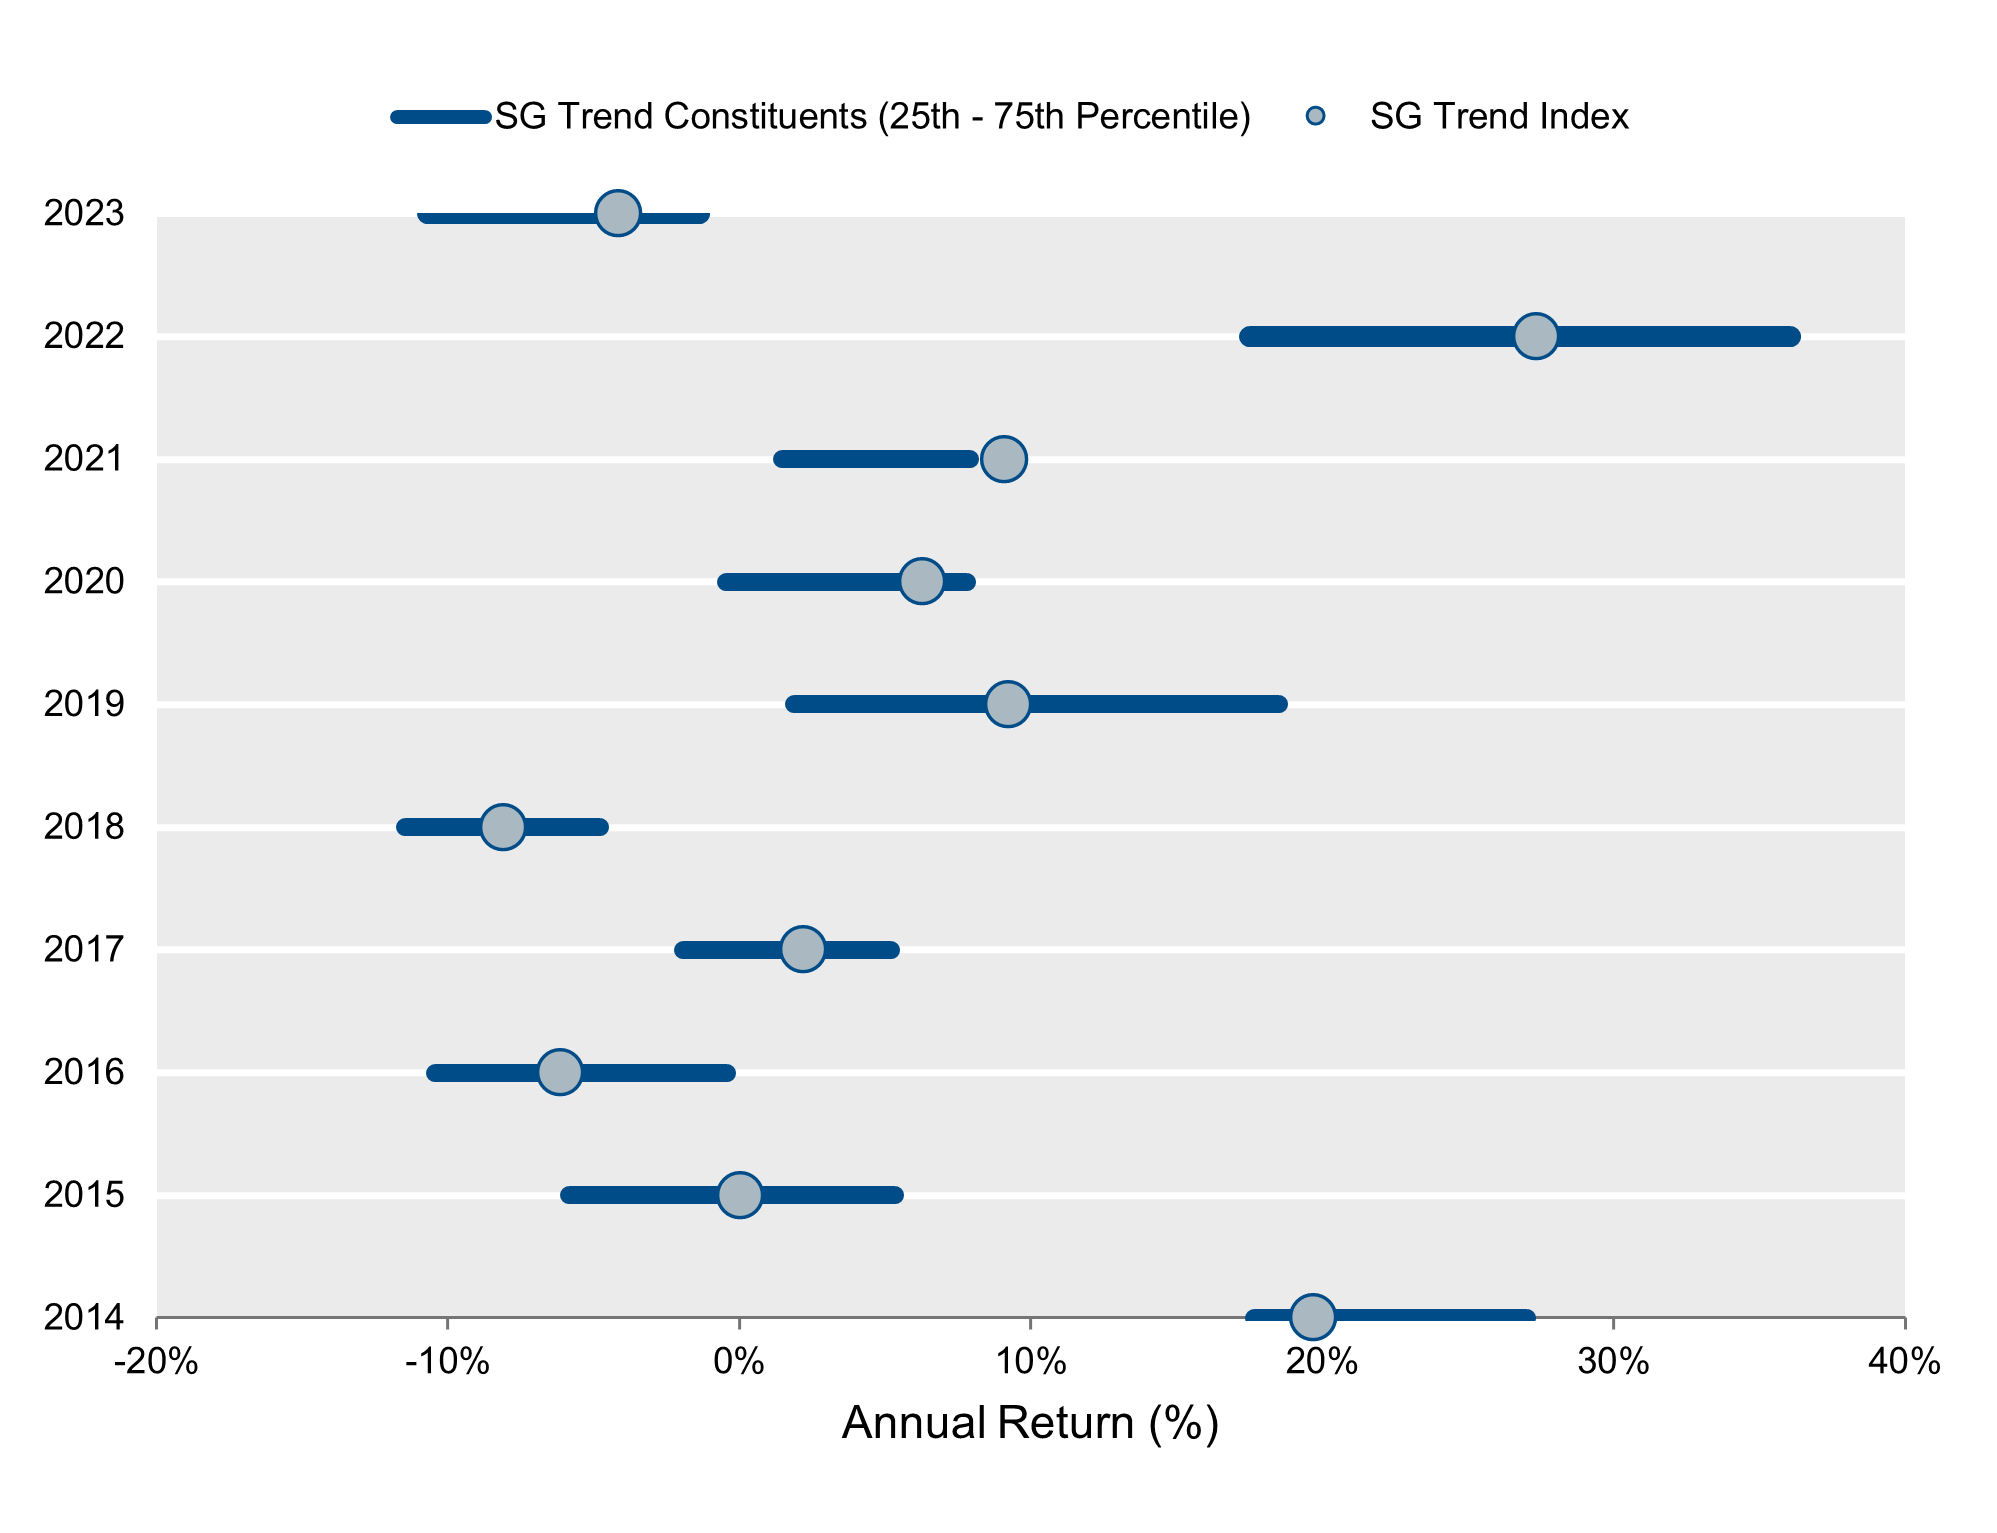 Sources: Nasdaq eVestment, NISA calculations.
The wide distributions of annual returns reflect the many potential dimensions of a Trend strategy:
- Instrument universe (50, 100, 200+?)
- Signal type, e.g., lagged returns, moving-average cross-overs, etc.
- Look-back periods, e.g., 1-month, 3-month, 1-year
- Risk-budgeting, e.g., total portfolio, instrument types
- Portfolio construction, e.g., de-risking triggers, leverage constraints
- Rebalancing rules, e.g., daily, weekly, monthly?
- Injection of other risk premia, e.g., carry
While all of these choices ultimately explain the variation in returns, a natural question arises: Is there an underlying Trend “factor” which is common to manager returns?
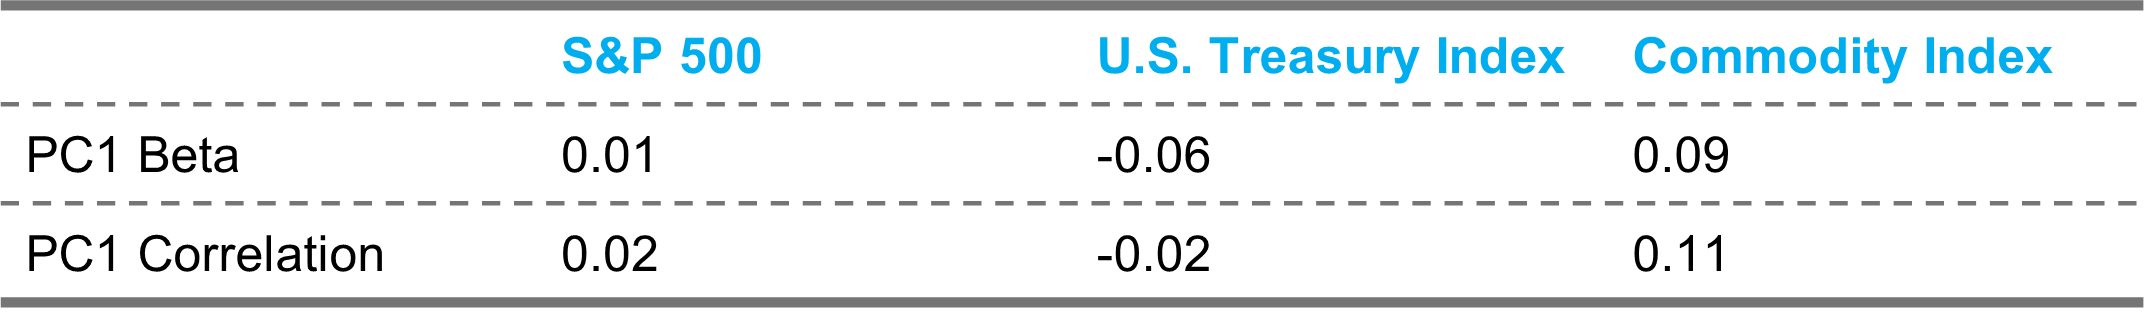
We use Principal Component Analysis (PCA) to identify independent factors that are common to Trend strategies that have been members of the SG Trend Index over the past 20 years, and report returns to the Nasdaq eVestment database.[5] Figure 2 below shows the percentage return variation of the Trend universe that is explained by the first five principal components (PC) over time. Overall, these five factors explained on average more than 90% of the variation in Trend returns. The first factor alone, which consistently explains more than 70% of return variation, supports the idea that there is a systematic Trend “beta,” or common factor to which most managers have significant exposure. In Panel B, the low sensitivities to equities, bonds and commodities from the first principal component provide further support for Trend’s potential as a total portfolio diversifier.
Figure 2, Panel A: Principal Components’ Decomposition of Variation in Trend Strategy Returns (1/1/2006-12/31/2023)
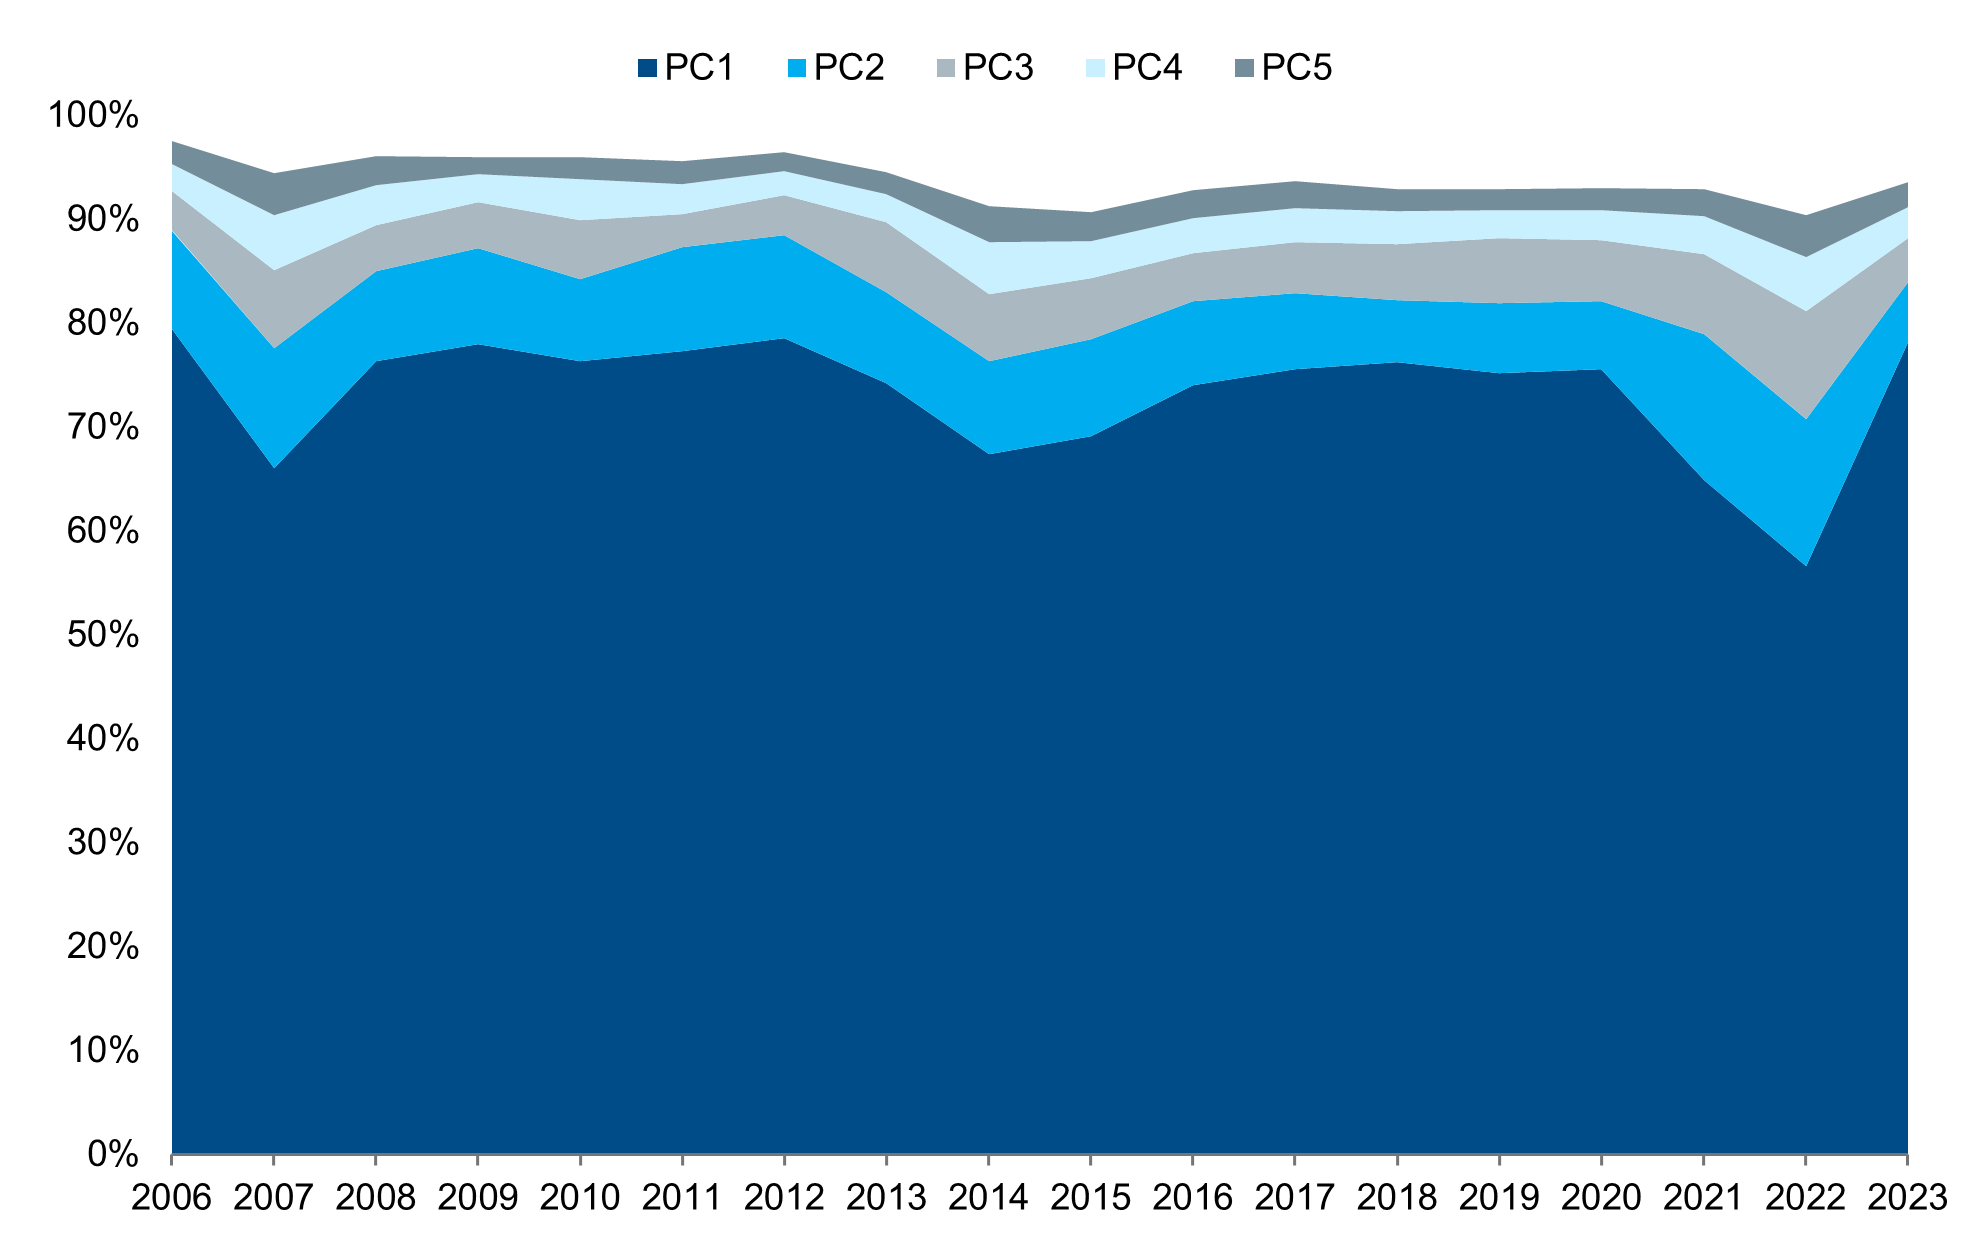 Sources: Nasdaq eVestment, NISA calculations.
Figure 2, Panel B: Betas and Correlations of PC1 to Market Indices[6]
What is Trend’s role in a portfolio context?
The performance of Trend strategies relative to equities is shown in Figure 3, plotting the quarterly returns of one against the other. For example, during the worst quarter for equities, with the S&P500 down more than 20%, the SG Trend index rose by more than 12%.
Figure 3: Quarterly SG Trend Index Returns Versus the S&P 500 Index (2006-2023)
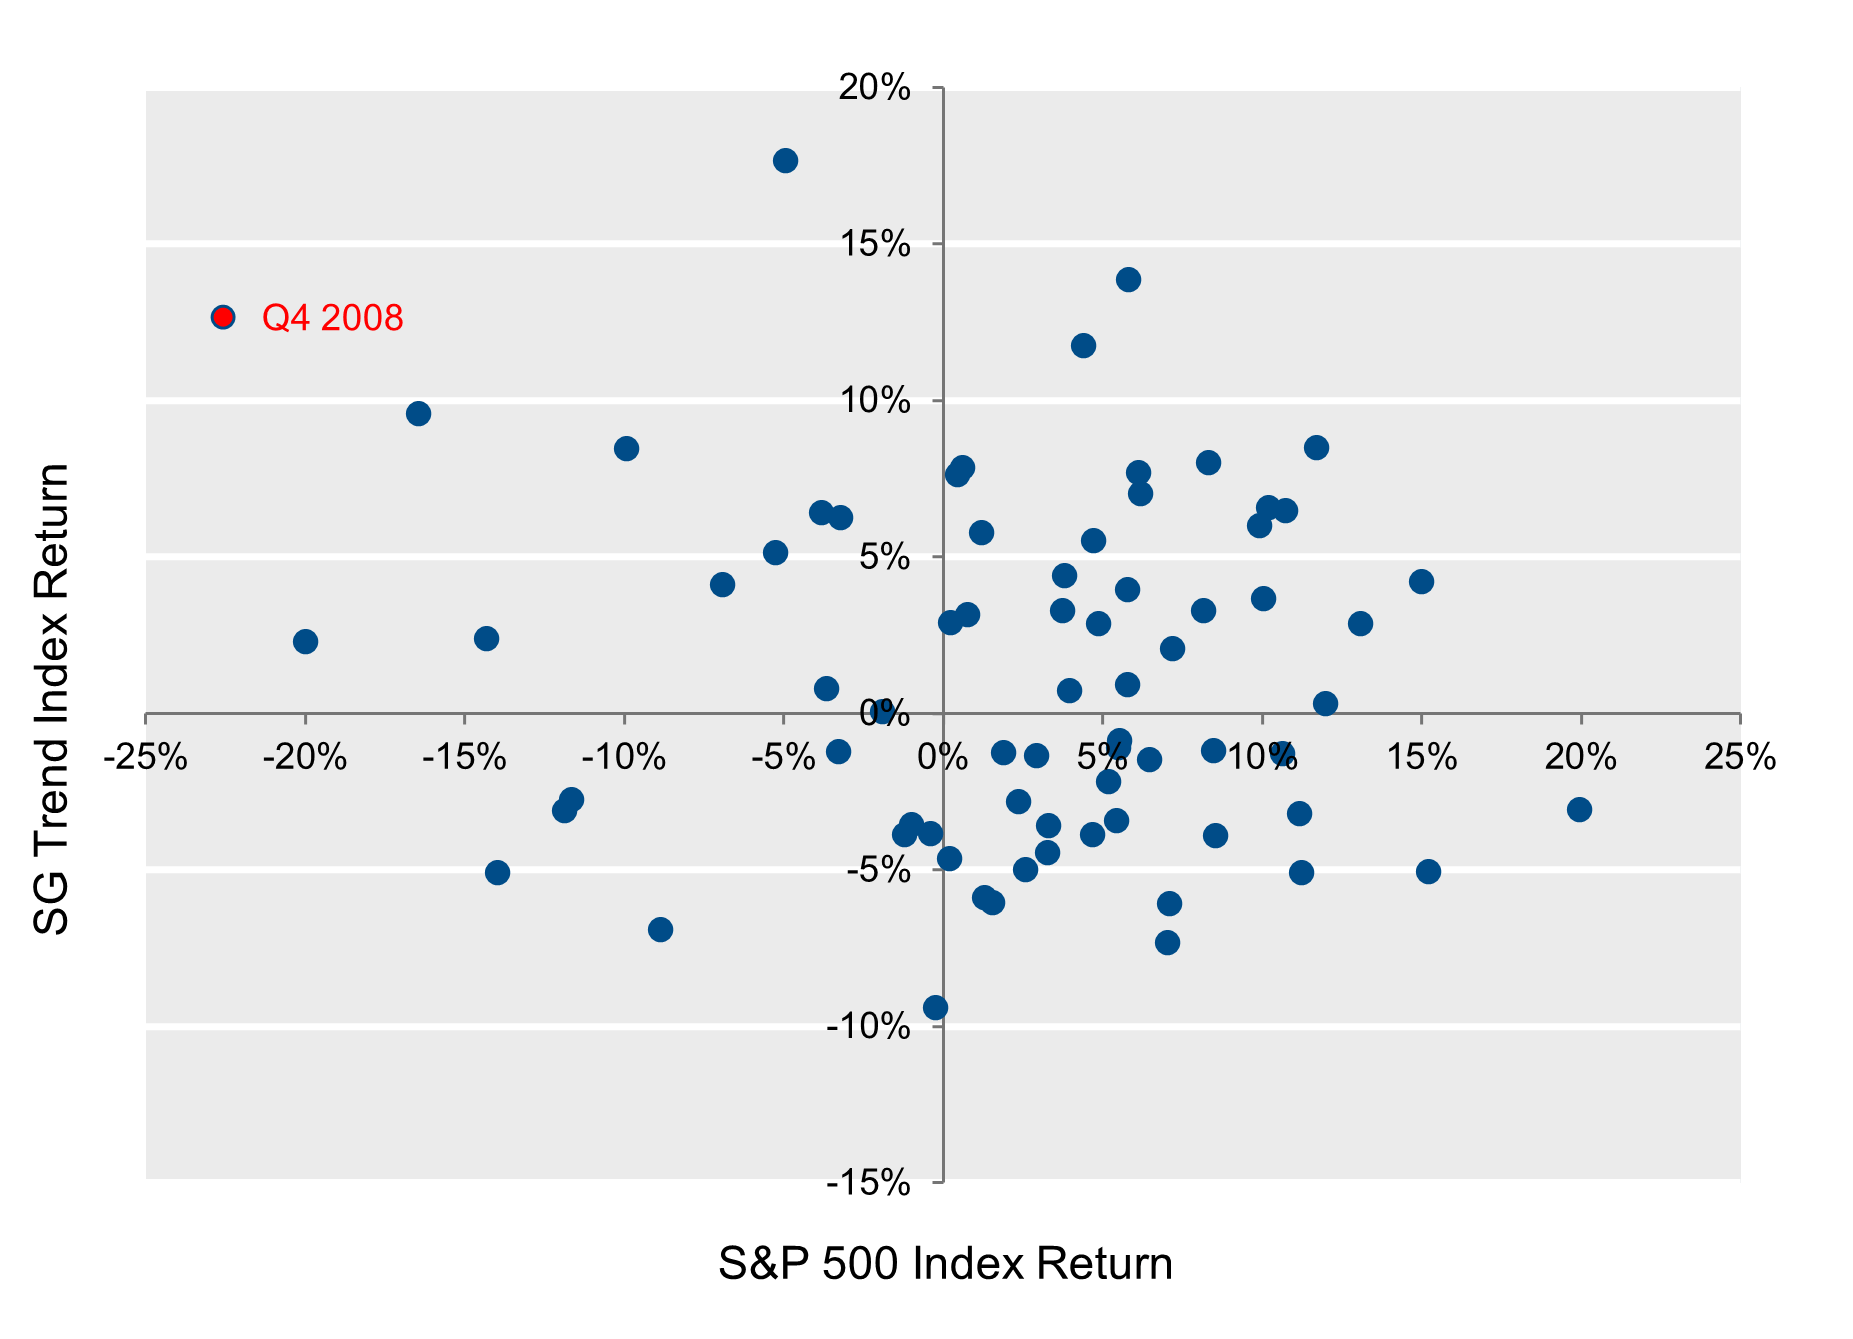 Sources: Bloomberg, NISA.
As Figure 3 suggests, resembling more of an inkblot than an illustration of any relationship between equities and Trend, this strategy has been an effective diversifier. As we demonstrated in our diversification paper, Trend has also performed admirably during equity selloffs, delivering returns that even in many cases outstripped equity puts. At times, such as Q4 2008, Trend has provided returns sufficient to earn the moniker of “Crisis Alpha.”
Trend can therefore play several potential roles in a portfolio: a diversifying strategy, a component of a tail-risk hedge or as part of an absolute return allocation. How Trend fits in a portfolio will likely come down to the objectives of each asset owner as well as their investment structure and governance. A strong aversion to large drawdowns (often for entities with large portfolios of illiquid private investments) may lead to a focus on the tail-risk hedging objective. A desire to diversify away from traditional market premia, such as equity and rates, may lead to examining Trend as part of a diversifying strategies policy allocation. For return-centric investors, Trend may play a role in an absolute return allocation given the attractive adjusted return and low market correlation.
There are few asset classes or strategies in this world that offer both a positive expected return and a potential hedge to equities, particularly during large drawdowns. Since this is apparently a behavioral phenomenon which has, at this point, been very well researched, isn’t it possible that this apparent “anomaly” disappears? In theory, yes, it’s possible. In practice, it seems we’re far from that point. Total assets managed by systematic CTAs are a little above $300b according to BarclayHedge 2023 data. The total value of equity and fixed income markets stands at approximately $240t.[7] Factoring in the size and depth of foreign exchange and commodity markets, the footprint of CTAs seems small indeed. Furthermore, as we have seen both from the dimensions of a Trend strategy as well as the distribution of manager returns, Trend strategies clearly don’t all move in the same direction at the same time. While their use of leverage and higher turnover than discretionary managers can amplify their impact, it seems we are a long way from the returns to Trend being arbitraged away.
Conclusion
Trend-following is in many ways a surprising strategy. While it breaks with the idea that markets are fully efficient, it has demonstrated its ability to generate attractive returns over longer periods of time. It seems investors are not fully rational, but are subject to behavioral phenomena such as loss aversion, anchoring and herding biases. Trend has shown low and sometimes negative correlations with traditional markets and at times even outperformed put options in declining equity environments.[8] A trend allocation provides investors with something different – an exposure to behavioral risk premia which are currently missing from many institutional investors’ portfolios – perhaps it is time to start a new trend!
Reading
Jegadeesh, N. and Titman S. (1993), “Returns to Buying Winners and Selling Losers: Implications for Stock Market Efficiency,” Journal of Finance
Kahneman, D. (2013), “Thinking Fast and Slow,” Farrar, Straus & Giroux, Paperback
Moskowitz, T., Ooi, Y., Pedersen, L. (2012), “Time Series Momentum,” Journal of Financial Economics No. 104
[1] Trend-following and its “cousin,” Momentum, which measures relative price movements of similar securities, have been widely researched in academia, e.g., Jegadeesh & Titman (1993) and Moskowitz, Ooi & Pedersen (2011).
[2] The fields of neurology and psychology increasingly suggest that the way we make decisions, formulating a model for how the world works, a “heuristic,” may be responsible. For example, see the description of “System 1” in Nobel-laureate Daniel Kahneman’s “Thinking Fast and Slow.”
[3] Data from 1/1/2014 – 12/31/2023 to represent ten full calendar years. Additional periods available upon request.
Sources: Societe Generale, Nasdaq eVestment. Note: There are shortcomings to using databases, including limitations on inclusiveness and survivorship bias. Benchmarks identified in the Nasdaq eVestment Analytics database are selected by the product’s investment manager and may not be indicative of the true product benchmark. The analysis is based on data from 1/1/2014 through 12/31/2023 from Nasdaq eVestment Analytics, Bloomberg, and Bloomberg Index Services Ltd. Neither NISA nor Nasdaq eVestment guarantee or warrant the accuracy, timeliness or completeness of the information provided by Nasdaq eVestment and are not responsible for any errors or omissions with respect to such information. NISA pays Nasdaq eVestment Analytics a standard fee for access to manager data.
[4] There are only 10 managers in the SG Trend Index in any given year and not all managers report in Nasdaq eVestment. All managers reporting in Nasdaq eVestment during this time period were included in the analysis.
[5] PCA is a mathematical technique used to identify factors that drive the behavior of a dataset, in this case the returns of Trend managers. Definitionally, each factor is independent of every other factor. In this analysis, we focus on the first 5 PCs, that is the ones that explain the largest variations in returns.
[6] Percent of variance explained by PCs of universe of Trend managers that have been members of the SG Trend Index and report returns to the Nasdaq eVestment database. Analysis conducted using monthly data from 01/2004 – 12/2023 for Trend strategies that had been members of the SG Trend index and were available in the Nasdaq eVestment database. PCAs were extracted over 24-month rolling periods. Indices referenced are the Bloomberg Treasury Index and the Bloomberg Commodity Index.
[7] Source: SIFMA 2024 Capital Markets Outlook. Note, this number does not include Foreign Exchange and Commodity markets, which are also important markets for CTAs. Futures markets provide further depth for CTAs, with more than $600t traded in equity futures markets in 2022 according to the World Federation of Exchanges.
[8] “Diversification: How Diversifying is it Really?” NISA Perspectives.