To paraphrase Tolstoy,[1] market ascents resemble one another, but each swoon is unique in its own way. Above-trend inflation, record Fed tightening and the invasion of Ukraine all conspired to deliver the worst year for financial assets in more than a generation in 2022 (see Figure 1). Can we learn anything from a year as unusual as 2022, or should we wave gratefully as it disappears further from view?
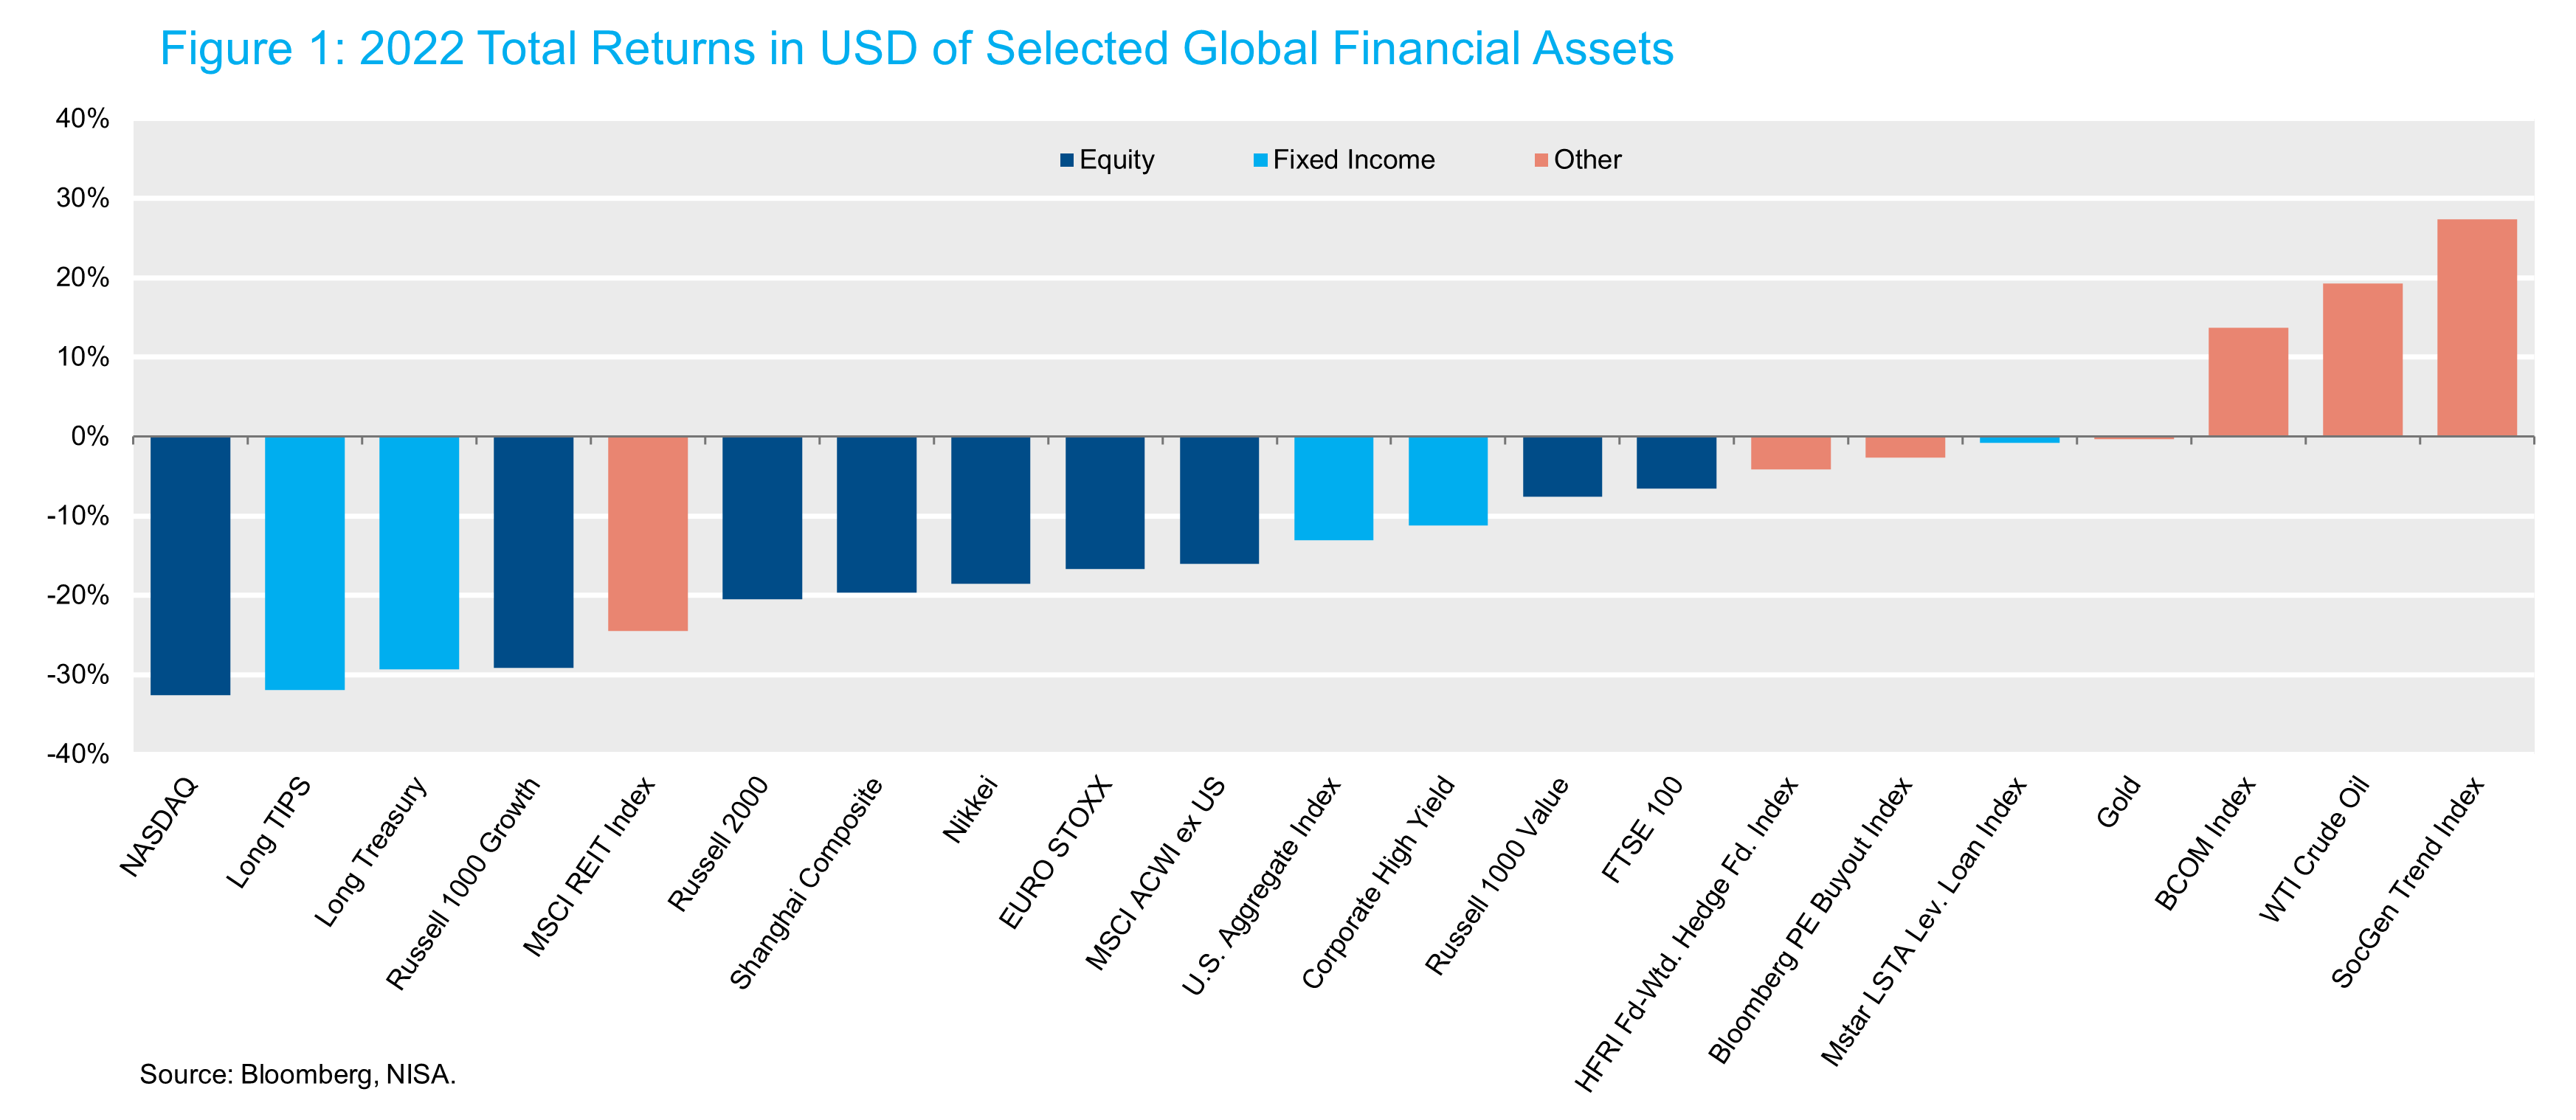
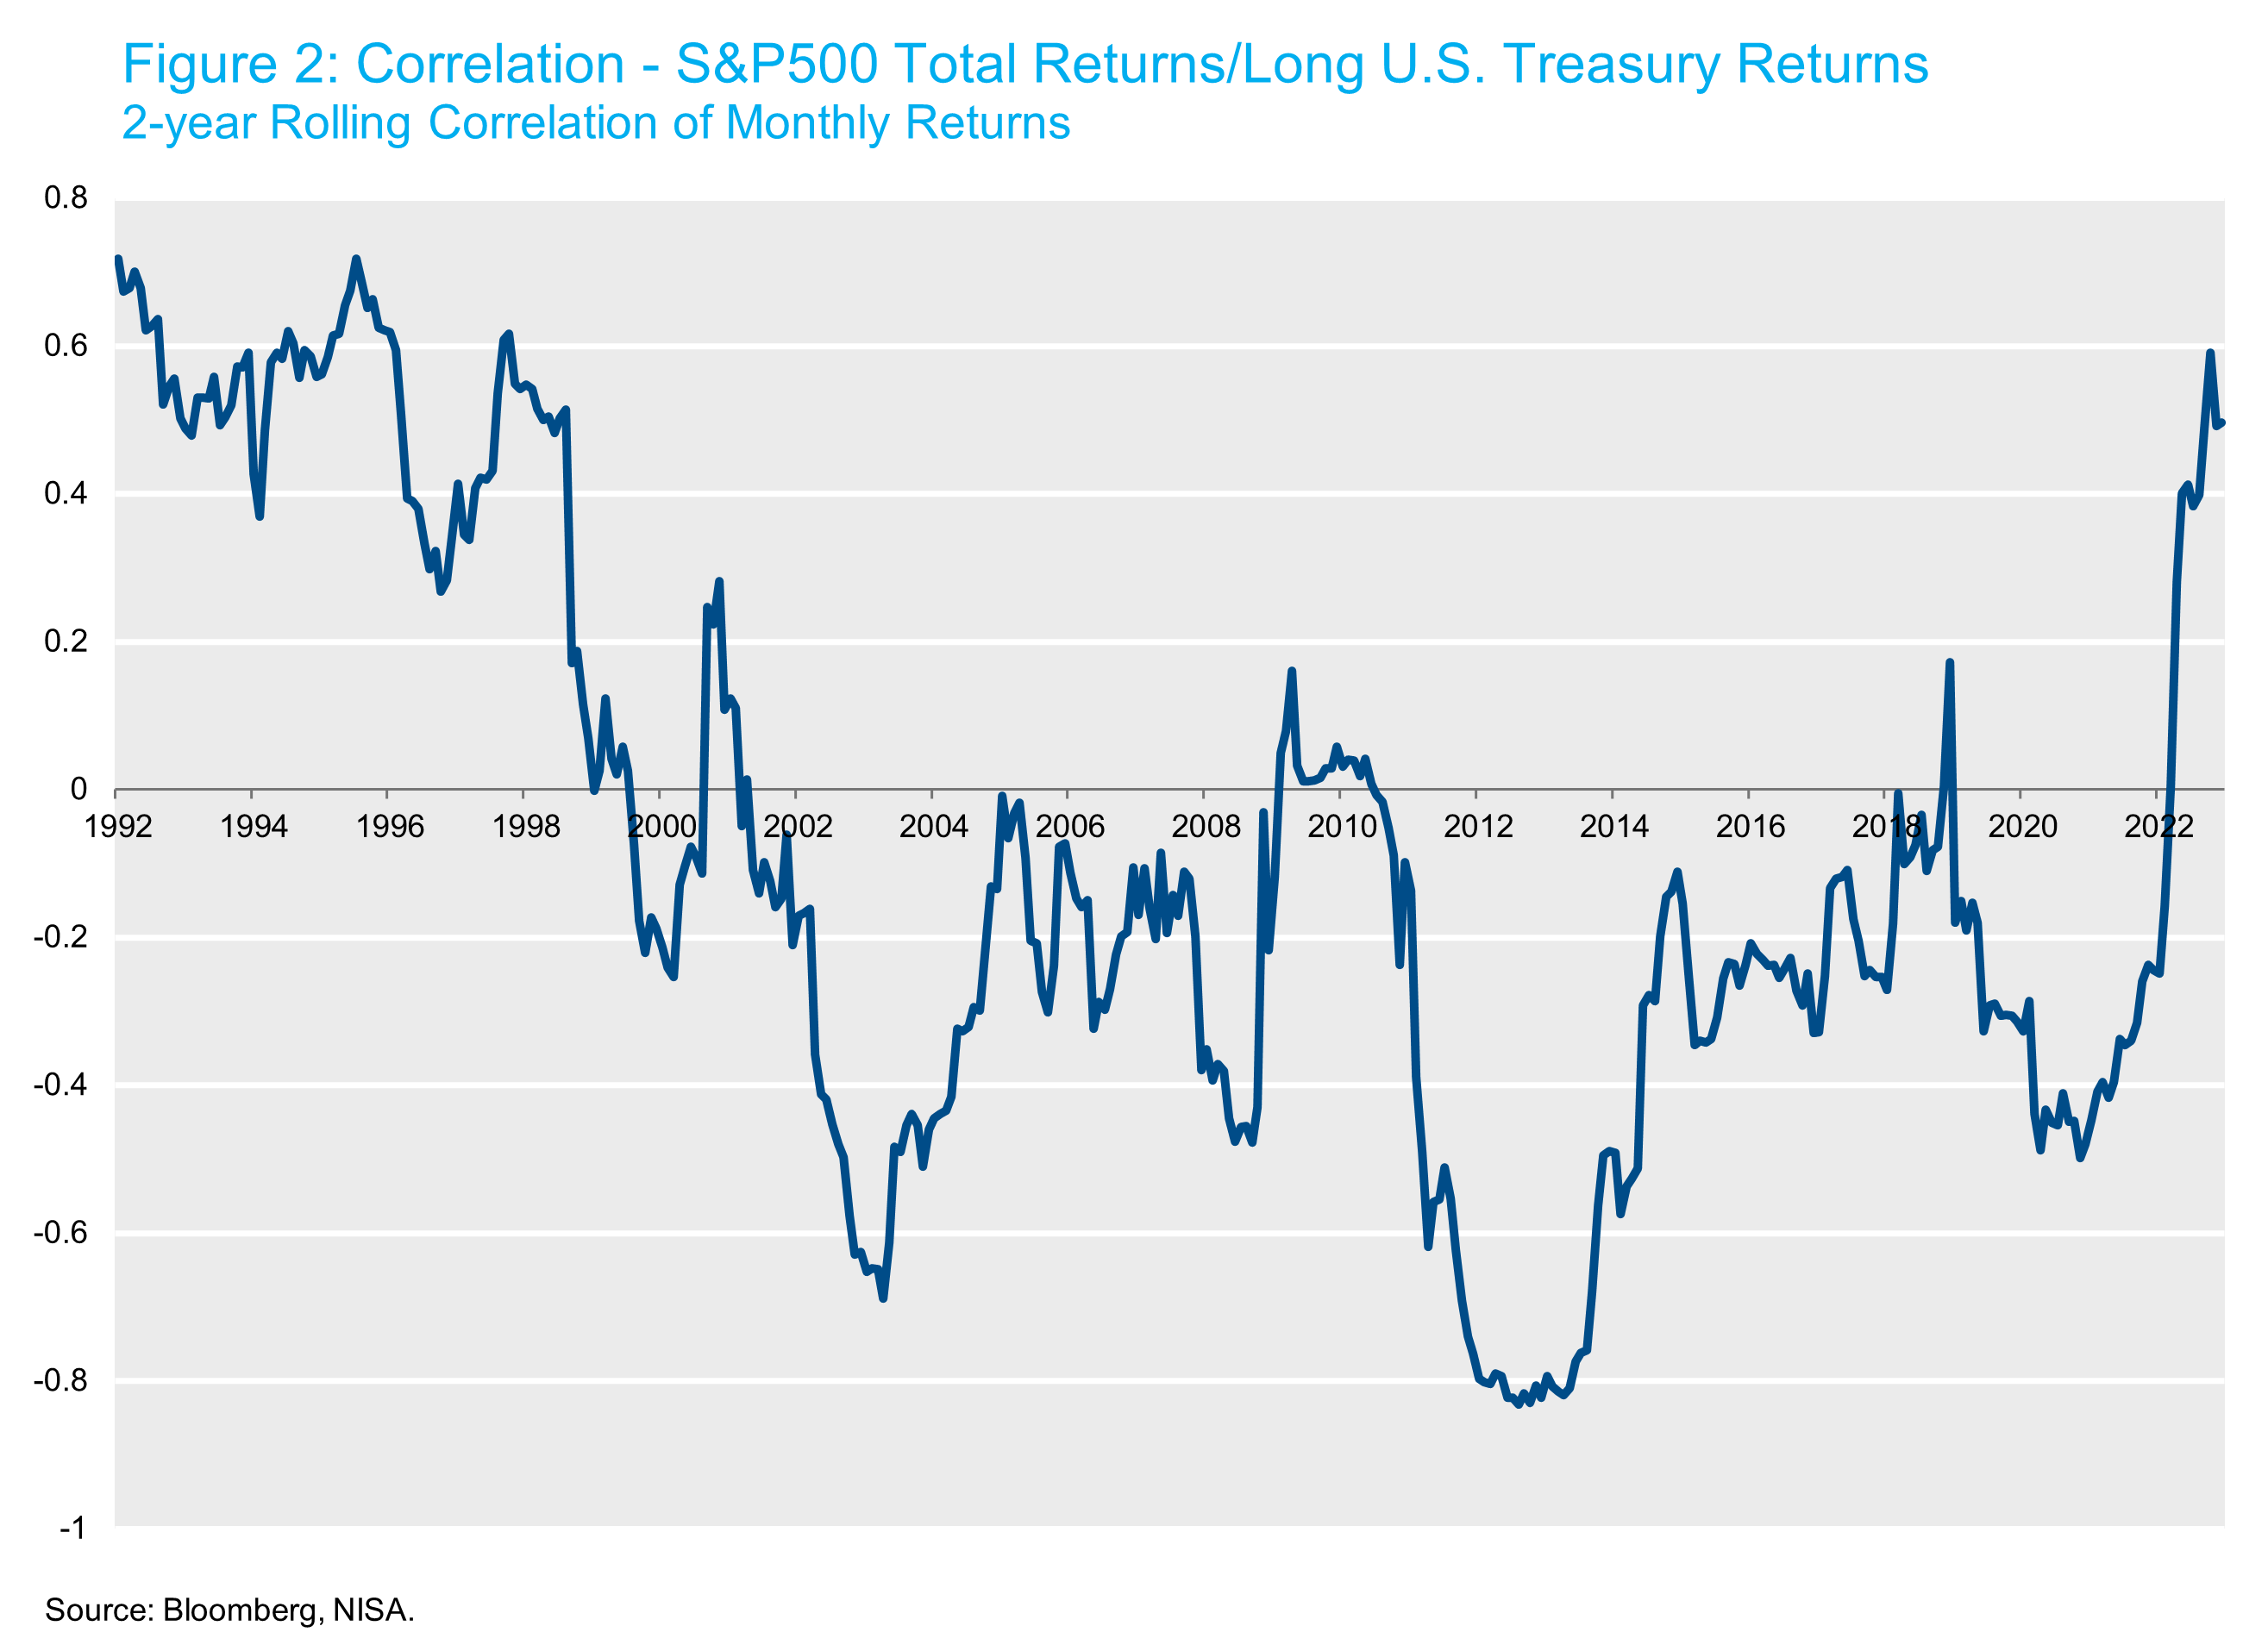
We are taught that diversifying asset classes or strategies (henceforth assets) is good. Diversification is frequently used to seek improved portfolio risk/return trade-offs. For most asset-focused investors, equity and equity-like assets are the dominant source of portfolio volatility, and we generally think of diversification with respect to equities. While the idea of an asset with attractive returns and a high negative correlation to equities is appealing, in practice such an asset cannot exist, as market efficiency would increase prices to force the return premium out of existence.[2] The best we can probably hope for are assets with around zero correlation to equities and a positive risk premium. The problem is that zero correlation on average does not mean zero correlation all the time. The relationship between equity and bond returns has been far from stable over time. While the correlation of monthly U.S. equity returns (S&P 500) and U.S. Treasury 10+yrs returns since 1990 has been -0.06, the rolling 2-year correlation of returns has been between +0.8 and -0.8 as Figure 2 shows. Those correlations have had the desired signs during the selloffs of 2008 and 2020, but had the “wrong sign” during the equity decline of 2022. While we will investigate this relationship in greater detail in a future paper (spoiler alert: inflation uncertainty is key), the most important message is that although high quality bonds have been one of the most consistent sources of equity diversification, in any given downturn, investors cannot rely on any specific asset class or strategy.
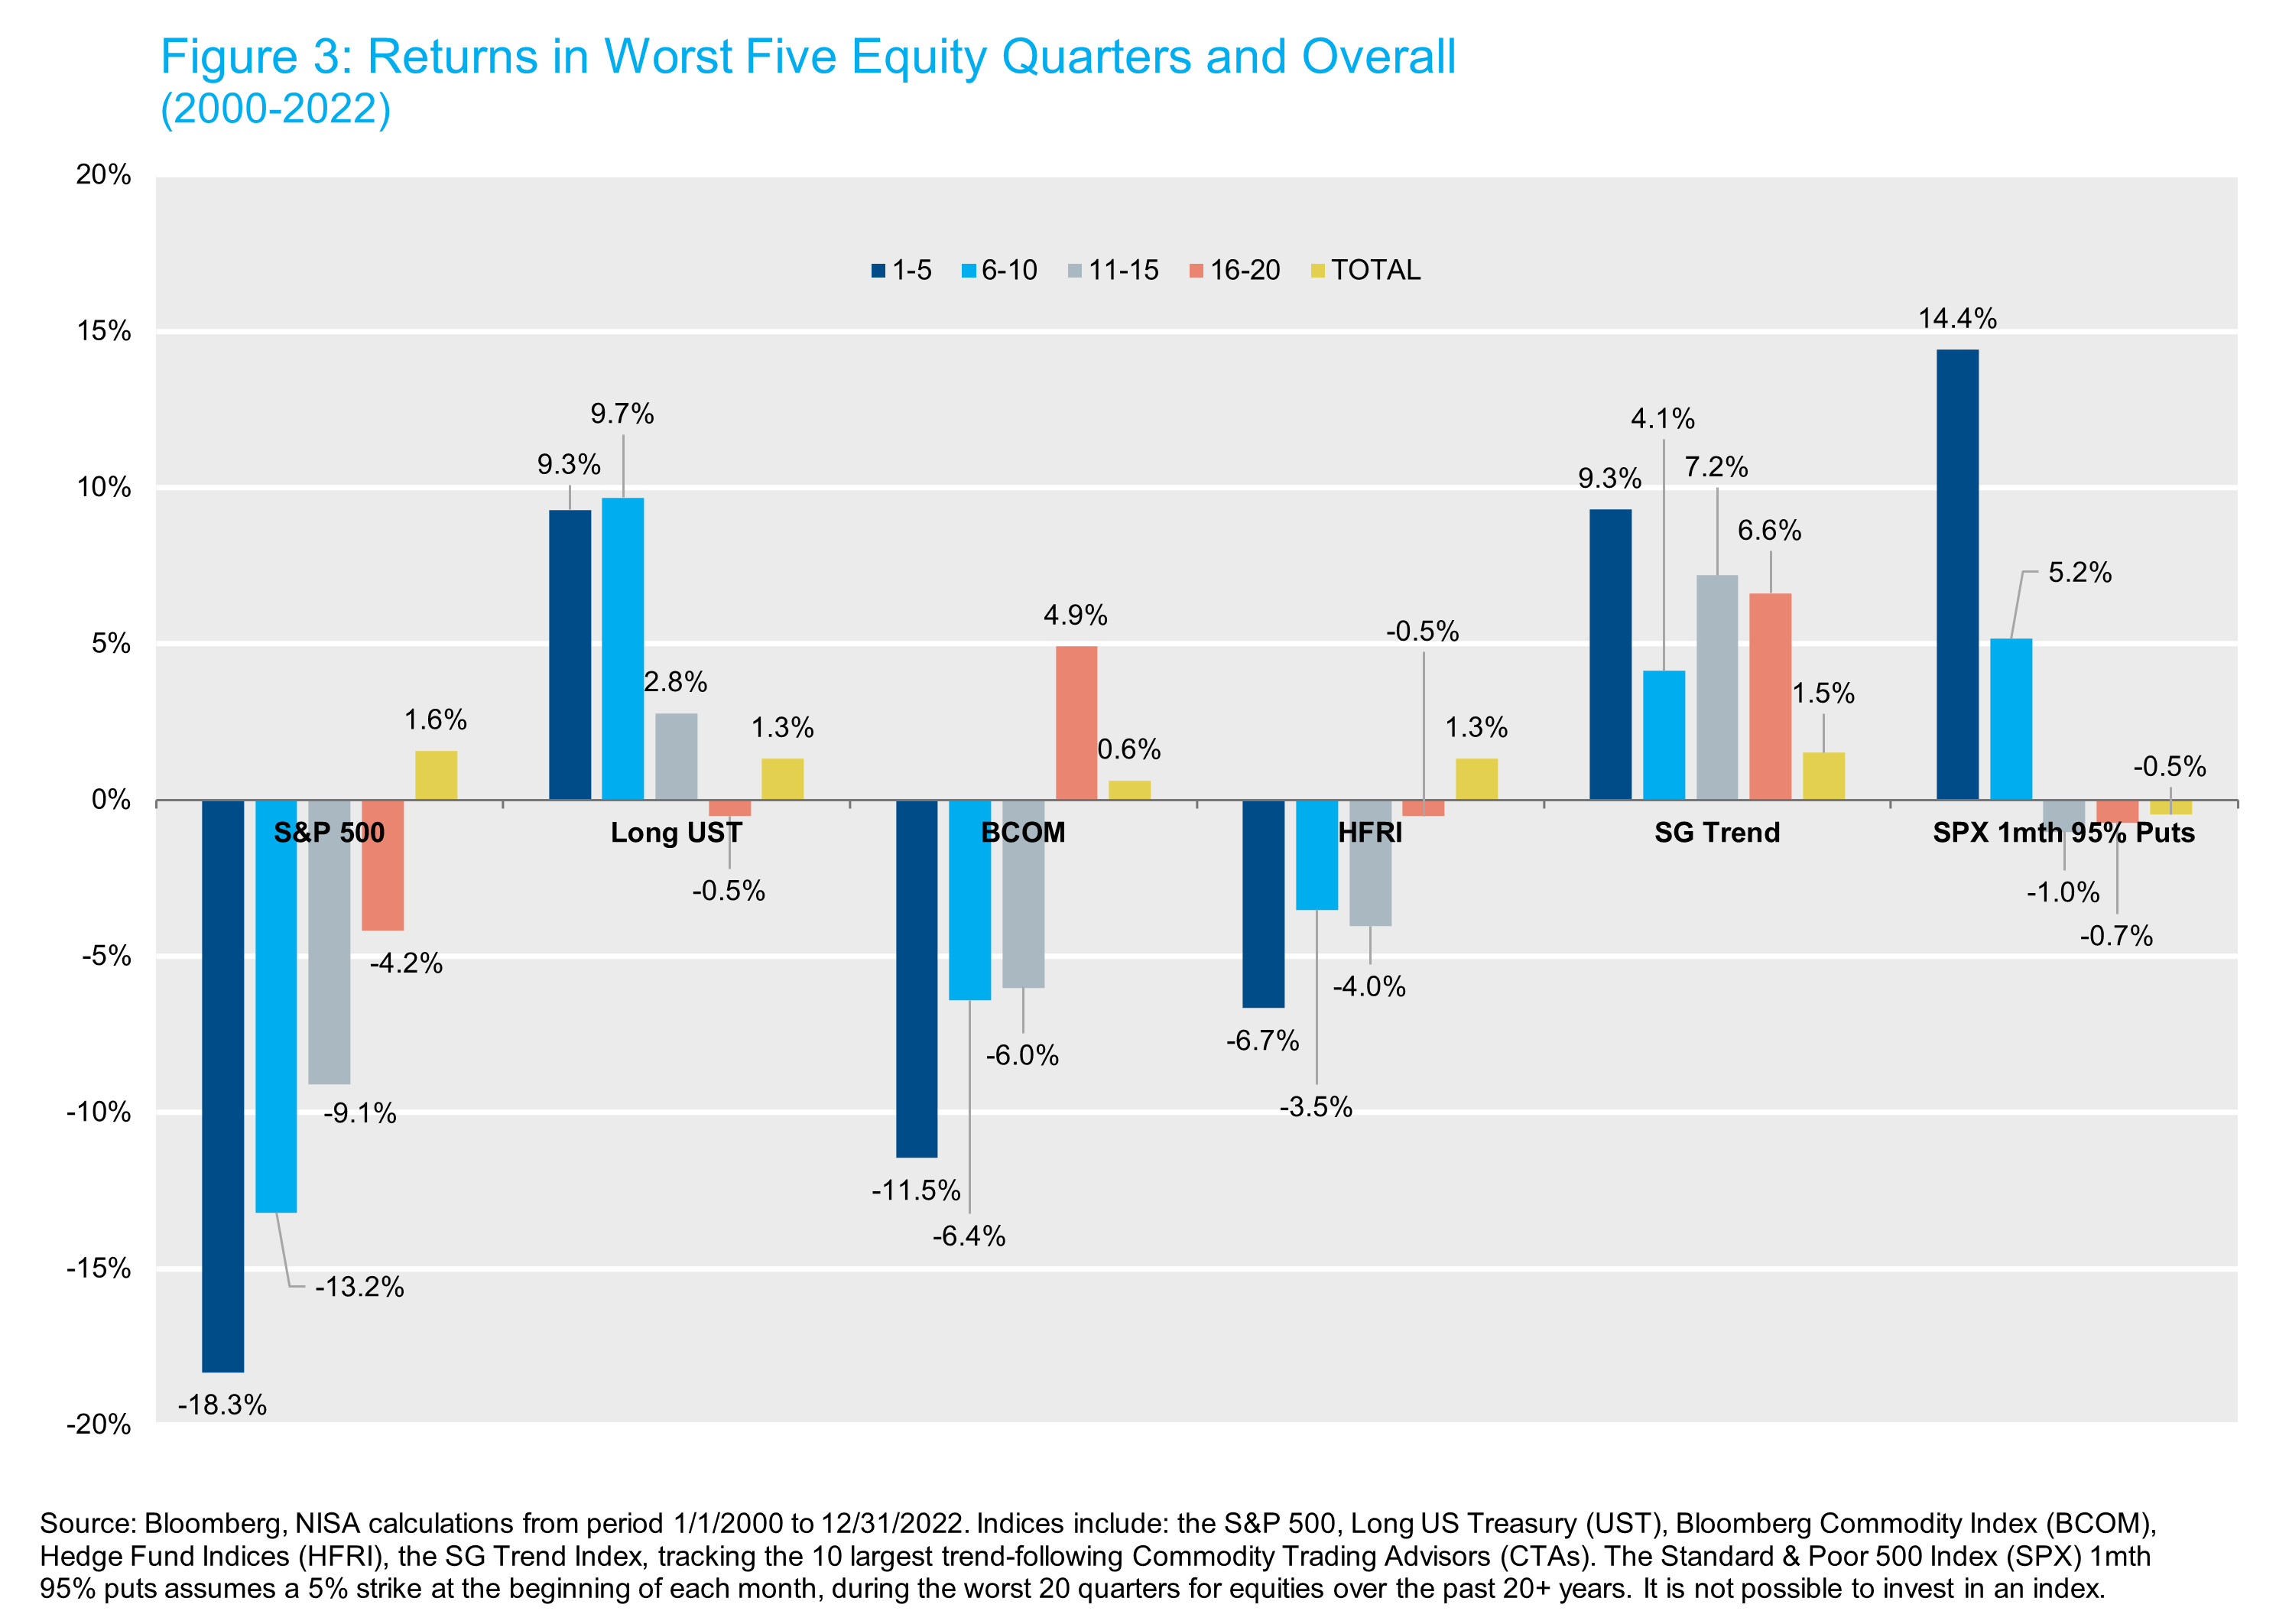
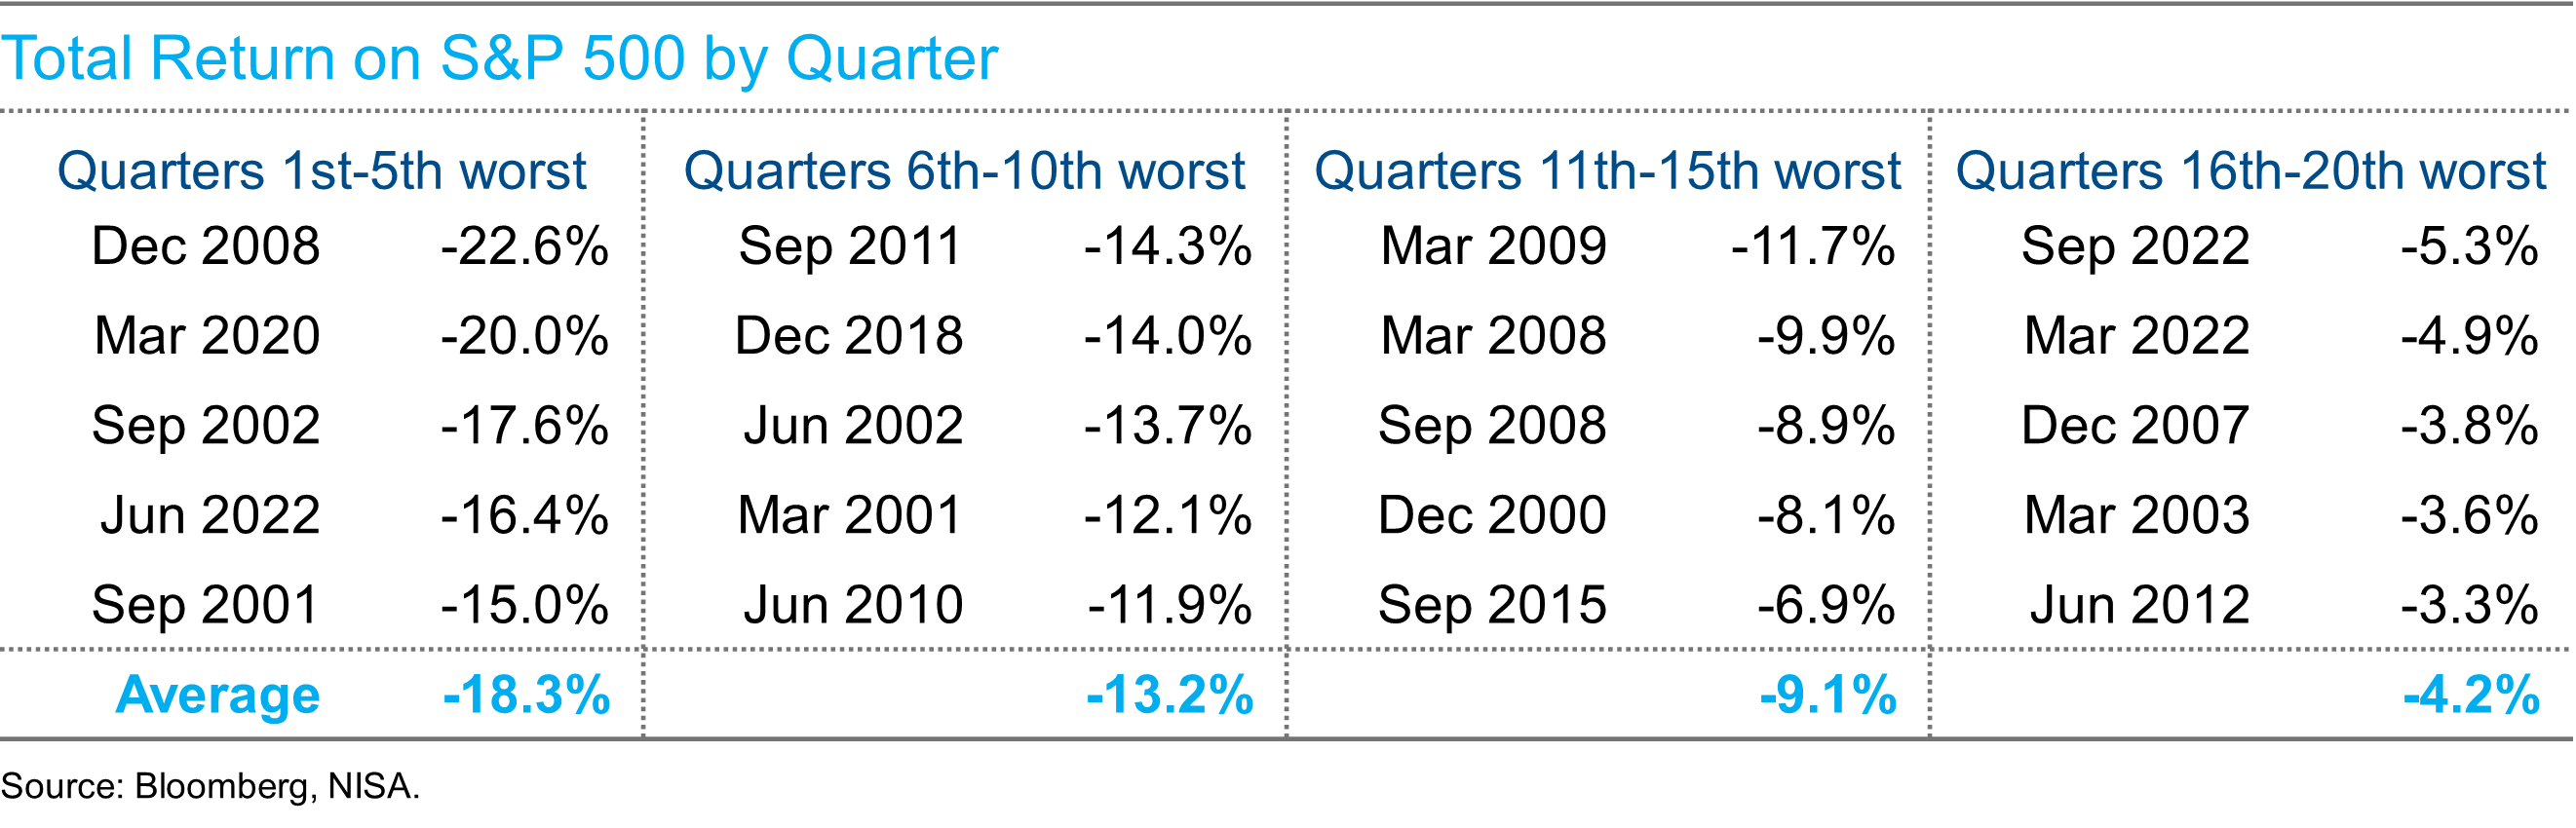
In 2022, rising inflation and other signs of an overheating economy led the Fed to the largest increase in short-term rates during the course of one calendar year since 1980. TIPS, whose prices are sensitive to changes in real yields, declined as much as nominal Treasury securities. Even at a time of rising inflation, a U.S. TIPS allocation disappointed.[3] The Global Financial Crisis gave rise to much analysis of strategies designed to provide a “tail-risk hedge.” Figure 3 analyzes the returns of the S&P 500 and other indices, which are traditionally considered “diversifying” since 2000, grouping together returns for the worst five quarters for equities, followed by the next worst five and-so-on.
U.S. Treasury securities had their aforementioned annus-horribilis in 2022, but apart from that have provided an admirable tail-risk hedge. During periods of rising risk aversion and/or in anticipation of economic downturns, they have generally been a haven for many investors, but that has not always been the case. Over ten days in March 2020, in the midst of a significant COVID-inspired equity decline, the Long Treasury index fell more than 15%, as market illiquidity could not cope with the volume of sales, until the Fed’s unlimited repo program came to the rescue. This, though has been an exception. Generally during periods of heightened market volatility and liquidity conditions, U.S. Treasuries have been the haven of choice as risk-premiums on other asset classes rise sharply.
Commodities on the whole have not been a beneficial tail-risk hedge, apart from 2022.[4] When energy prices rise sharply, as they did in 2022, commodities are generally an effective offset for declining prices of financial assets for two reasons. First, the energy complex (Oil & Gas) represents nearly 30% of the Bloomberg Commodity Index (BCOM).[5] Second, energy is by far the largest influence on CPI inflation of any commodity complex, both because of its weight in household consumption (heating oil, gasoline, etc.) and its volatility relative to other commodities. But commodity prices generally rise in response to increasing demand, showing the same pro-cyclicality as equities, during economic downturns as well as upturns.
Hedge funds have significantly outperformed equities in downturns since 2000 though their negative absolute returns in all of the periods above leaves plenty to be desired.[6] Their underwhelming diversification benefits likely stem from a long equity bias (e.g., long/short equity) or in style categories highly correlated to equities (e.g., credit hedge funds, vol-arb hedge funds). The broad use of leverage also can lead to higher correlations with equities when general liquidity conditions deteriorate (e.g., Q1 2020). A subcomponent of these strategies includes so-called alternative risk premia, which utilize a systematic approach to gain exposure to factors, including for example, Value and Momentum. While these have tended to outperform other hedge fund styles during equity declines, some components have shown a tendency to procyclical behavior (e.g., Value).
 Perhaps the most surprising data in Figure 3 are for equity puts. Any investor would be forgiven for believing that puts are the single most effective tail-risk hedge for equities. In the chart, it is assumed an investor purchased SPX puts struck 5% out-of-the-money at the beginning of each month, during the worst 20 quarters for equities over the past 20+ years. Sure, when equities fell sharply (e.g., Q4 2008) puts did quite well, offsetting a majority of the loss on equities. But even armed with a crystal ball to predict equity market declines, an investor would likely end up buying puts when volatility is very elevated. Figure 3 suggests that in half of the negative quarters we examined, the premium is too great to offset any payoff from falling equity markets during the same quarter. We would caution that the index we used, the CBOE Put Protection Index (PPUTSM), assumes rebalancing at the beginning of each month, as different timing of assumed put purchases would have yielded quite different results. That’s not necessarily reassuring for the predictability of a put protection strategy however!
Trend to the rescue?

Unlike the previous four assets, Trend is the only strategy that has positive returns in all of the periods examined above. Why has Trend performed so admirably? Trend-following strategies time markets, largely using price trends as inputs. Why does Trend generate a positive return at all, and why does it apparently work particularly well during equity market declines? The fact that Trend has generated positive returns seems to fly in the face of the Efficient Market Hypothesis, which, even in its weakest form suggests today’s prices reflect all data from past prices. Yet no less than Nobel laureate Paul Samuelson demonstrated that while individual stock prices can be efficient, the market overall need not be, since it’s much more difficult to predict valuations overall than those for individual companies. Behavioral Finance, which shows how human biases impact decisions, suggests that investors are prone to anchoring to existing views and so underreact to new information and also exhibit herding behavior. Both of these characteristics suggest why Trend does well during equity downturns. Equity prices respond only gradually to deteriorating fundamentals, and a Trend-following strategy should pick up that tendency.
Unfortunately, Trend isn’t entirely foolproof either. Just as 10 days in March 2020 saw large U.S. Treasury declines mirroring falling equity markets, 10 days in March 2023 witnessed large declines in Trend (the SG Trend index fell 11%) as the regional banking crisis and the fall of Credit Suisse unfolded, battering wrong-way short positions in bond futures (so, bonds up, Trend down). A Trend strategy encapsulates a set of choices, including range of instruments, signals (e.g., simple price movements, moving averages, breakouts etc.), and lookback windows, all of which can have a significant impact on returns.[7] This just underscores that even for a diversifying or tail-risk hedging approach, diversification pays.
Finding strategies to reduce the impact of equity drawdowns without the corresponding loss in expected return is inherently challenging. Equity puts protect a portion of an investor’s equity exposure, but that comes at a cost. Investors should always ensure they are comfortable with the level of equity risk in their portfolio and consider selling equities if they are not. However, most investors need a certain level of return to hit their investment objective and deploying strategies that are likely to mitigate downside equity risk may be a way to accomplish that objective. Both U.S Treasuries and Trend seem to, at least historically, exhibit this positive attribute. Government bonds still have several advantages over Trend: a long-term expected return over cash (term premium) which is a reward for bearing interest-rate risk, ease of implementation (cash bonds, strips, futures), and very low fees/transaction costs. Trend is a strategy that is not a traditional risk premium, but rather one that exploits investor behavior, is significantly more difficult to implement, and can be much more costly (some Trend strategies are still priced with hedge-fund like fees). But, there is an interesting implementation choice which may alleviate many of these concerns, which we will explore in a future piece.
Precisely because no market prognosticator can predict the type of unhappy market we will see, a portfolio of diversified strategies is ideal. Exactly how that manifests in portfolio construction, however, is a much richer question we look forward to addressing.
[1] Leo Tolstoy’s novel, Anna Karenina, begins with the famous words “Happy families are all alike; every unhappy family is unhappy in its own way.”
[2] The existence of such an asset would enable a nearly risk-free portfolio to be constructed with a significant expected premium above risk free rates.
[3] The Bloomberg U.S. TIPS index did grow by the ~7% increase in CPI. However, the increase in real yields more than offset the positive CPI prints, resulting in a total return of -12%. Importantly, depending on the specific duration of the TIPS portfolio, the realized outcome could be materially different.
[4] Energy exposure and commodities more broadly are generally seen as a hedge against a supply-side shock. However, shifts in commodity consumption patterns — notably the substantial decline in global oil intensity, as well as the significant decrease in collective wage bargaining power, has reduced the likelihood of such events.
[5] The S&P GSCI has a significantly greater weight to energy, and therefore at times of energy price spikes, has provided a greater offset to declining.
[6] This index includes hedge funds which utilize trend-following strategies. This undoubtedly makes the hedge fund universe look better than it otherwise would have, for reasons discussed above.
[7] For example, in 2022, while the SG Trend index delivered a return net of fees of 27%, the spread between the highest and lowest return was more than 30% of nine-out-of-10 funds that reported in eVestment. This analysis considered all SG constituents available in the eVestment database, and all returns were reported net of fees. There are shortcomings to using databases, including limitations on inclusiveness and survivorship bias. Neither NISA nor eVestment guarantee or warrant the accuracy, timeliness or completeness of the information provided by eVestment and are not responsible for any errors or omissions with respect to such information.