



September 2026
Get Insights in Your Inbox
NISA’s Pension Risk Transfer (PRT) Credit Risk Monitor is a market-based measure of the relative credit risk of common PRT annuity providers (“insurers”) designed to assist fiduciaries in identifying a “safest annuity available” PRT provider as required by the Department of Labor’s Interpretive Bulletin 95-1.
“Pension Risk Transfers May be Transferring Risk to Beneficiaries” details our approach and methodology. That paper concluded that there is a large range of creditworthiness among PRT providers. NISA’s PRT Credit Risk Monitor reports this range, by PRT provider, on a quarterly basis.
Economic Loss to Beneficiaries (ELB)℠

Average Issuer Spread
One limitation of using the market spreads of specific reference bonds is the episodic issuing patterns of each issuer. This can lead to differences in durations and maturity dates of the bonds in the analysis.
To provide a more robust measure of each issuer’s credit quality, the Average Issuer Spread dataset fits a spread curve to the entire universe of outstanding bonds for each issuer. Comparing the average issuer spread curve of PRT providers allows for a more like-for-like comparison across PRT providers by controlling for PRT variables such as maturity, issue date, dollar price, etc. The Average Issuer Spread ELB dataset re-calculates the ELB using this approach.
| Issuer | Average Issuer Spread | Market Price of Bond’s Risk Over Treasuries | Economic Loss to Beneficiaries (ELB) of Choosing Insurer |
|---|---|---|---|
| NY Life | 60 | 6.0% | 0.0% |
| PacLife | 60 | 6.0% | 0.0% |
| MetLife | 61 | 6.1% | 0.1% |
| Prudential | 65 | 6.5% | 0.5% |
| MassMutual | 65 | 6.5% | 0.5% |
| Principal | 74 | 7.4% | 1.4% |
| RGA | 81 | 8.1% | 2.1% |
| Corebridge | 84 | 8.4% | 2.4% |
| Athene | 114 | 11.4% | 5.4% |
| Global Atlantic | 121 | 12.1% | 6.1% |
| Fidelity & Guaranty Life | 145 | 14.5% | 8.5% |
Reported issuer spreads are 5-year, option-adjusted spreads implied from the spread curve fitted through the universe of FABN bonds, respective to each issuer.
Insurers chosen are based on “U.S. Pension Risk Transfer Update: 2024 Year In Review and Future Expectations,” AON, February 2025, who were identified as Mid-size/Large or Large/Jumbo participants and have issued securities at the policy level for the institutional fixed income market.
ELB Calculation
The ELB methodology uses readily available market spreads on bonds issued by PRT providers that are pari passu with policy holders, specifically, spreads on Funding Agreement Backed Notes (FABNs). Our measure utilizes the market’s ability, and incentive, to incorporate all other risk assessments (e.g., published ratings, capital ratios, etc.) into the FABN pricing and thus, more holistically assess risk.
We believe that reviewing market pricing for comparable investments/policies clearly aligns with ERISA’s prudent expert standard – i.e., the market is a competitive environment with a multitude of experts seeking to maximize their risk-adjusted outcomes. In fact, one could argue that market price is singularly sufficient for assessing the credit risk of a PRT provider, as all other information (rating, capital structure, portfolio quality, etc.) is available to all market participants, and therefore presumably embedded in the price.
Provider’s Average Issuer Spread Term Structure
The Provider’s Average Issuer Spread Term Structure is an interactive representation of the Option-adjusted Spread (OAS) of PRT providers. Lines represent the average spread to Treasuries of each PRT provider for bonds issued by that insurer at various maturities — higher spreads suggest higher credit risk. To view any one PRT provider’s issuer spread curve line data individually, click on the PRT provider’s name. On the individual view, dots associated with each line represent the bonds’ monthly average OAS. For reference, the gray zones represent one standard deviation boundaries around the fitted OAS of the full corporate universe for bonds of a given rating.
Sources: Bloomberg, NISA calculations. Data as of 09/30/2026.
Insurers chosen are based on “U.S. Pension Risk Transfer Update: 2024 Year In Review and Future Expectations,” AON, February 2025, who were identified as Mid-size/Large or Large/Jumbo participants and have issued securities at the policy level for the institutional fixed income market.
Top 5 Issuers determined by the amount of FABN outstanding as of 12/31/2024.
Provider’s Average Issuer Spread Time Series
Spreads fluctuate through time as the market digests new information and seeks to assess each issuer’s credit worthiness. Additionally, near-term market technicals (e.g., recent new issue volume, market liquidity, etc.) can impact spread levels. Accordingly, while the current spread level is the market’s latest assessment of credit risk, looking at historical spread relationships is often instructive. Historical insurer FABN spread levels are depicted in the Provider’s Average Issuer Spread Time Series chart below. The Market-implied Safest Available Annuity Spread reports the credit spread of the insurer with the lowest FABN spread at each point in time. Under this measure, the underlying market-implied “safest available” annuity provider may change from time to time.
The average insurer’s spread is determined using a dataset which fits a spread curve to the entire universe of outstanding bonds for each issuer providing a robust measure of each issuer’s credit quality. To view any one PRT provider’s issuer spread relative to the Market-implied Safest Available Annuity spread individually, click on the PRT provider’s name.
Sources: Bloomberg, NISA calculations. Data as of 9/30/2026.
Insurers chosen are based on “U.S. Pension Risk Transfer Update: 2024 Year In Review and Future Expectations,” AON, February 2025, who were identified as Mid-size/Large or Large/Jumbo participants and have issued securities at the policy level for the institutional fixed income market.
*Data points begin upon availability of FABN issuance program.
Liquidity in the Funding Agreement Backed Notes (FABN) Market
The 2025 Daily Trading Volume for FABN Securities Issued by Selected PRT Providers summarizes the liquidity of the FABN market by reporting the range of daily trading volumes for the PRT providers in this monitor.
2025 Daily Trading Volume for FABN Securities Issued by Selected PRT Providers ($mm)
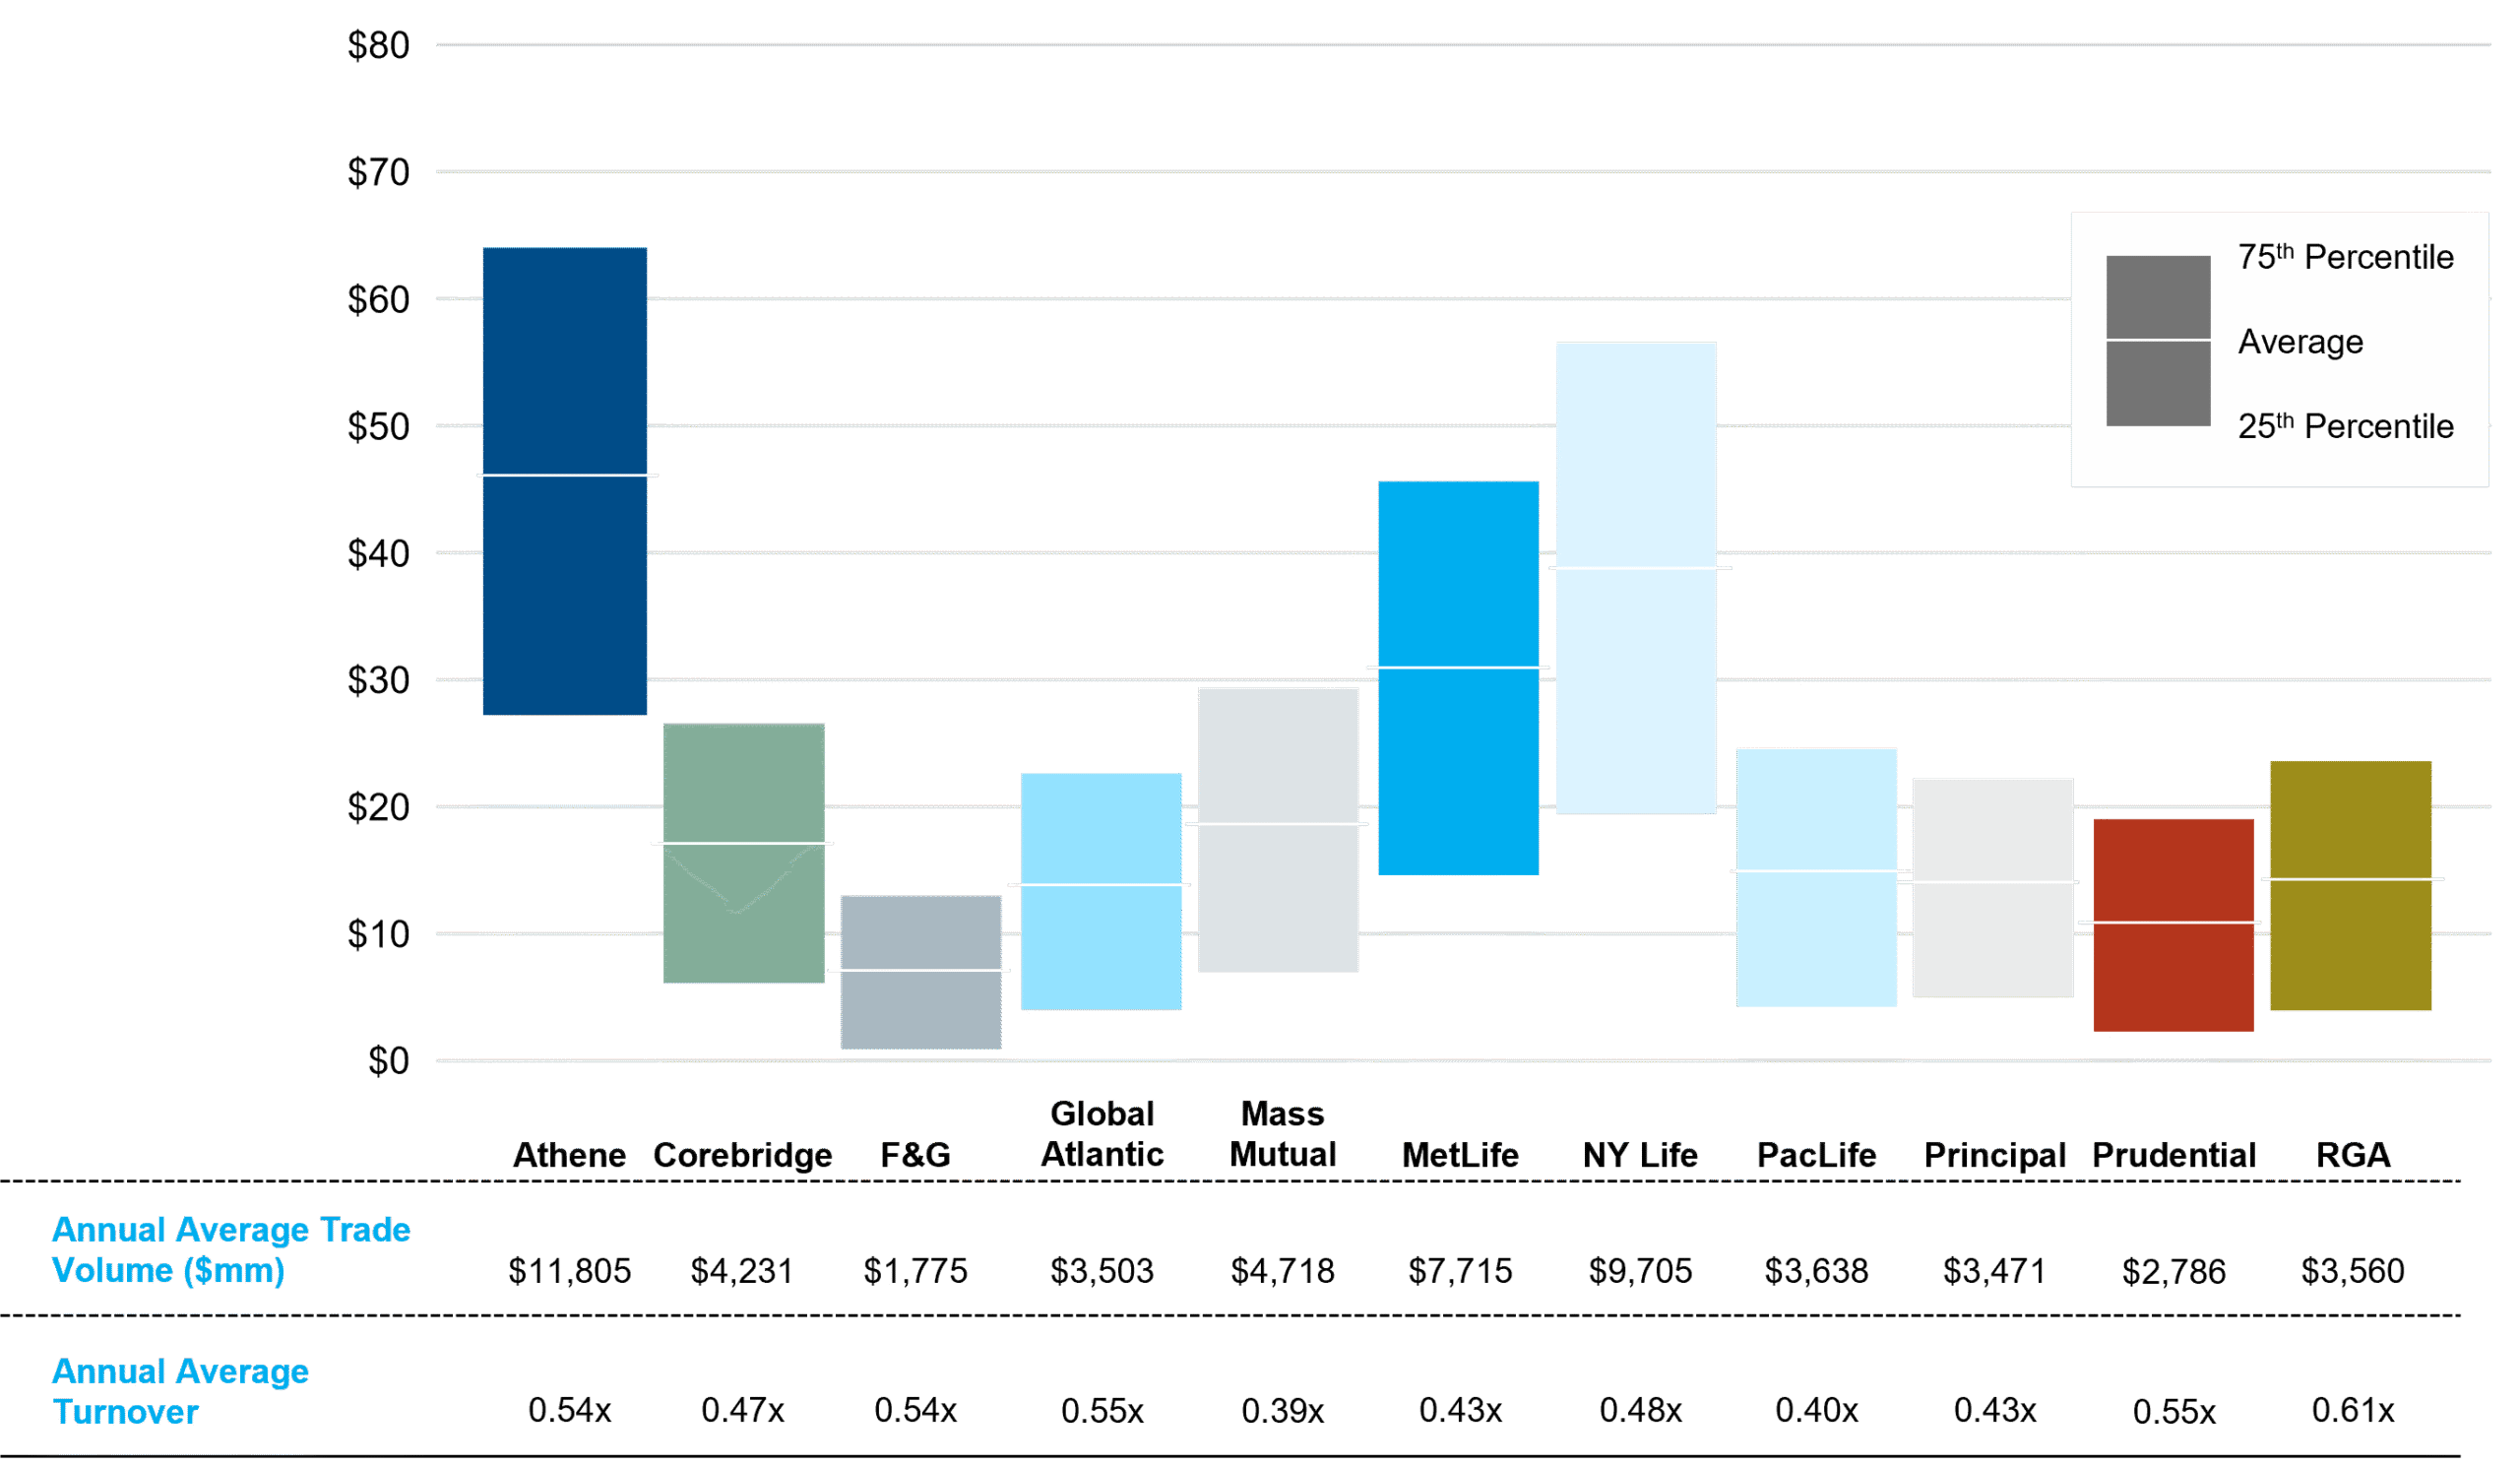
Sources: TRACE, NISA calculations. Data ranges from 01/01/2025 to 12/31/2025.
Reported transactions represent the trading activity of USD FABNs issued by the PRT providers listed in the table. Future trading activity may differ from historical trading observations.
Insurers chosen are based on “U.S. Pension Risk Transfer Update: 2024 Year In Review and Future Expectations,” AON, February 2025, who were identified as Mid-size/Large or Large/Jumbo participants and have issued securities at the policy level for the institutional fixed income market.
Additional Resources
For more background on the PRT market and our analyses, see our resources below. If you would like to discuss your particular situation in more detail, our client services team is available to assist.
Partner With NISA