Partial annuity buyout transactions (PRTs) inherently pit two groups of participants against one another – those in the transaction and those remaining within the plan. Fortunately, publicly available bond market data can help measure the potential harm to each group. This paper uses these data and standard bond math techniques to quantify the economic cost to each group. Notably, the methodology demonstrates that in all but extreme cases, fiduciaries seeking to balance the participants’ interests should choose the safest available provider as measured by NISA’s economic loss to beneficiaries (ELB)SM measure.
Introduction
As an unabashed free-market person, competition is always welcomed in my opinion. But inevitably, somewhere between chapter 3 and say 10 of any economics textbook the idea of externalities is introduced, specifically, the harm or benefit of a given transaction that accrues to a third party to said transaction. This is one example of many in economics where guard rails to the purely “free” market facilitate a global optimum.
NISA’s recent paper, “Liquidity Refinements to Potential Economic Loss to Beneficiaries (ELB) in PRTs,” discussed one such externality. In particular, we quantified the Economic Loss to Beneficiaries (ELB) associated with a Pension Risk Transfer (PRT). Or, said in the dismal language of economics, the ELB is the negative externality that accrues to participants when fiduciaries choose a lower quality credit PRT provider than the “safest available.” The role of addressing negative externalities typically falls on the government, and in this case, the Department of Labor’s (DOL) long ago issued IB 95-1 to do just that.
Per instruction from Congress via the SECURE Act, the DOL is reviewing 95-1. One area of clarification we would suggest relates to the following language:
The selection of an annuity provider for purposes of a pension benefit distribution… is a fiduciary decision governed by the …. In discharging their obligations … to act solely in the interest of participants and beneficiaries and for the exclusive purpose of providing benefits to the participants and beneficiaries as well as defraying reasonable expenses of administering the plan, fiduciaries choosing an annuity provider for the purpose of making a benefit distribution must take steps calculated to obtain the safest annuity available, unless under the circumstances it would be in the interests of participants and beneficiaries to do otherwise. [Emphasis added].
In the case of a full plan termination, this language is very clear. However, more commonly in the large plan market, PRTs are for only a portion of the liabilities. In these cases, the use of the plural “participants” and “beneficiaries” could lead to at least two possible interpretations:
- “Participants/Beneficiaries” refers only to those who are now facing the creditworthiness of the chosen insurer.
- “Participants/Beneficiaries” refers to all plan members– those directly involved in the PRT and those that remain behind.
The first interpretation is quite logical, after all, the guidance relates specifically to the choice of the annuity provider. But if a fiduciary chooses the second interpretation, they introduce tradeoffs among the two groups of participants. One way to address this tradeoff is to assert that all bidding PRT providers are identical in credit quality. In this case, the tradeoff then ceases to exist – the fiduciary chooses the lowest cost provider (thus leaving the remaining plan participants more well-funded) while not harming the transacted participants.
But as our prior paper points out, there is a vast range of credit quality among common PRT providers as measured by the bond market. Accordingly, if the key assertion above is inaccurate, we can’t simply conclude that choosing the lowest cost provider appropriately balances the interests of the two participant groups. This paper uses our ELB framework and related credit risk measures to provide a simple economic framework to make this tradeoff. Spoiler alert: the resulting model shows that in all but extreme scenarios regarding the plan sponsor’s health, the safety of the annuity provider is an order of magnitude more important than the resultant funded status impact on the remaining participants. Curiously, that is tantamount to using interpretation 1 from above.
A Two Insurer Example
Imagine an illustrative pension plan with a $1b liability that is 95% funded. Two insurers bid to purchase one half of the liabilities. Insurer A bids $525mm for the block of participants while Insurer B bids $500mm for the same block. Insurer B is a higher credit risk as measured by its ELB score – 4% relative to Insurer A, or $20mm[1]. The sponsor does not intend to make any contributions associated with the transaction. The sponsor is BBB-rated, with outstanding bonds that trade at a spread of 200 bps over U.S. Treasuries. Accordingly, if Insurer A is chosen, the residual plan will be 85% funded – ($950mm-525mm)/$500mm. If Insurer B is chosen, the residual plan will be 90% funded – ($950mm – $500mm)/$500mm.
Even a cursory review of this scenario suggests the “rooting interests” of the parties. Specifically, the participants being transferred to an insurance company clearly prefer the higher quality, Insurer A. The participants remaining in the plan prefer the lower price, Insurer B – as they have no risk to either insurer and, by picking Insurer B, the plan is 5% more well-funded. Finally, the sponsor prefers Insurer B as that choice results in smaller expected plan contributions going forward.
How do we quantify these rooting interests in an effort to help a fiduciary balance the interests of the various stakeholders? Because 95-1 makes clear the sponsor’s interest cannot be a consideration, that leads us to weigh the interests of the two participant groups. Our ELB estimate is of immediate use to determine the benefit/harm to the transferred participants. Recall, the ELB is in fact the estimated economic loss to the beneficiaries – in the form of uncompensated credit risk – of being put to a lower credit quality insurer, in this case $20mm.
Calculating the economic benefit/harm to the remaining participants involves a few more steps – which may feel hauntingly familiar to our ELB methodology. At first blush, it could appear that the remaining participants benefit by 5%, or $25mm, of funded status if Insurer B is chosen[2]. While the residual plan is 5% more well-funded, this increased valuation does not represent a $25mm increase in value to the participants. More accurately, it represents a $25mm smaller contingent claim on the plan sponsor. If Insurer A is chosen instead, this increased plan deficit of $25mm is equivalent to a receivable, i.e., bond, from the sponsor. Once again, simple bond math helps us estimate what this is really worth[3].
Choosing Insurer A over Insurer B harms the remaining plan participants by the difference between a $25mm claim on the sponsor versus $25mm in cash. As we discussed in the previous paper, the spread of a bond multiplied by its duration approximates the present value of compensation that an investor demands to accept the credit risk of that bond’s issuer. Accordingly, we can use the sponsor’s spread[4] to calculate the value of this contingent claim on the sponsor:
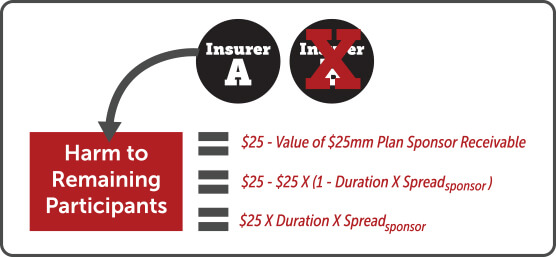
If we assume plan deficits are required to be funded over approximately 10 years, then the duration of this receivable is approximately five years. Accordingly, the net harm to the remaining participants of choosing the higher quality, higher cost insurer is $25mm times the expected credit loss due the sponsor’s credit risk, or $25mm X (5 X 200 bps) = $2.5mm.
To summarize, choosing Insurer B over Insurer A harms the transferred participants by $20mm. And choosing A over B harms the remaining participants by $2.5mm. Clearly, Insurer A is the appropriate choice to best balance the harm to participants and reduce the overall harm of the transaction ($2.5mm vs. 20mm)[5].
A Generalized Framework
It can be easily shown (see appendix) that the two participant groups’ interests are exactly balanced when the following equation holds[6]:

Accordingly, if the left-hand side of the equation is greater than the right-hand side, choosing the lower quality, lower cost insurer harms the transferred participants more than the remaining participants. And vice versa if the right-hand side is greater.
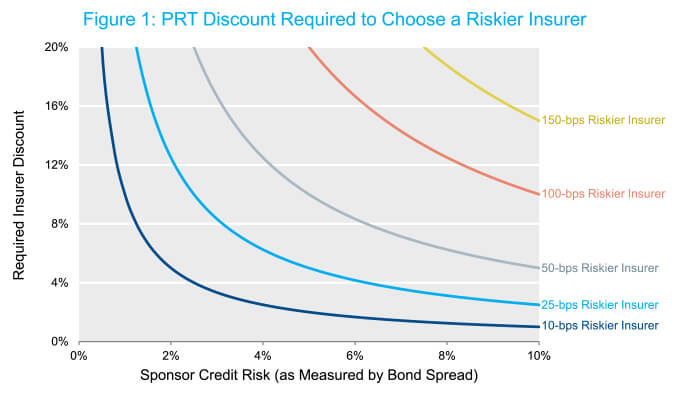
Another way to use this relationship is to plot indifference curves with respect to the choice of insurers in a transaction. Figure 1 below plots these curves.
The shape of the curves is quite intuitive – negatively sloped and very convex. For a given quality difference between insurers, the required transaction discount falls for higher risk sponsors (as measured by higher credit spreads). As a sponsor approaches being riskless (zero spread), the required discount rises exponentially.
These curves also demonstrate that the relative risks to the two groups differ by an order of magnitude. Again, this is intuitive as the relative riskiness of the insurers is applied to the entire transaction, whereas the risk of the sponsor is only applied to the difference in the two transaction prices.
For example, suppose the two bidding insurers are different in credit quality by a mere 25 bps. In that case, the transaction discount offered by the lower quality insurer must be a whopping 6.25% to balance the participant groups’ interests – even for a very risky plan sponsor whose credit spread is 400 bps. To provide context, a 25-bps difference in investment grade spreads is normally associated with a 1-2 notch rating difference and a 400-bps spread level is typically associated with BB-rated entities.
Conclusion
This framework provides fiduciaries with a quantitative, market-based way to balance the competing interests of different participant groups. But perhaps the most valuable conclusion from the analysis above is the identification of the extreme inelasticity in the relationship between insurer credit quality and the required transaction discount to choose a lower quality insurer. In practice, in all but extreme situations, simply choosing the highest quality insurer irrespective of price will be the prudent decision. De facto, this leads to interpretation 1 from above – fiduciaries should choose the safest available annuity, acting solely in the interests of the transacted participants.
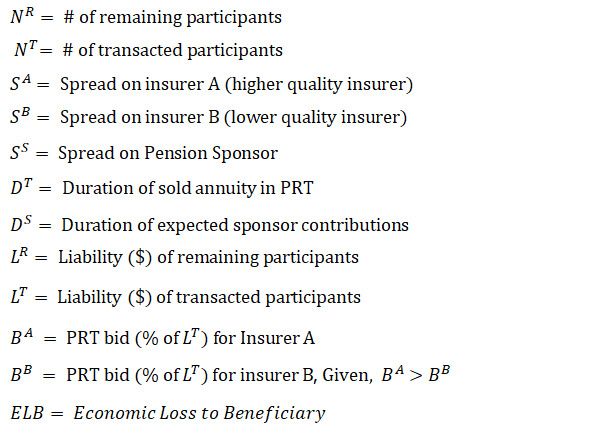
Appendix.1 Definitions
Appendix.2 – Harm to Transacted Participants of Choosing Insurer B (Less Safe)
The ELB measure was developed in our previous paper and represents the present value of the credit risk difference between the safest insurer and the chosen insurer. This estimate is based on the spread on the insurers’ publicly traded FABN securities.

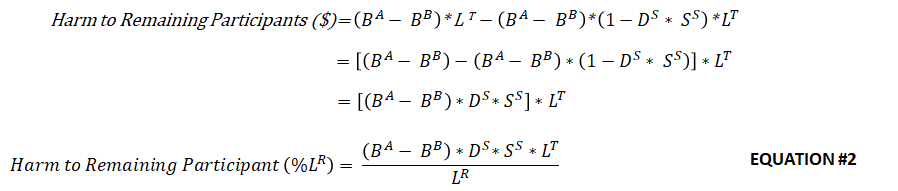
Appendix.3 – Harm to Remaining Participants of Choosing Insurer A (Safest)
Choosing the safer but more expensive Insurer A leaves the remaining participants less well-funded. The economic harm to these participants is equal to the dollar difference in the bid, adjusted for the credit risk of the sponsor. Similar to the ELB measure, we can use the fact that a bond’s duration times its spread is approximately the present value of the discount an investor demands to accept the corresponding credit risk – in this case, the sponsor’s spread times the duration of the expected contribution stream required to fund the incremental deficit caused by choosing Insurer A.
Appendix.4 – Balancing Harm to Participants
Using equation 1 and 2 above, we can define the relationship between key variables, such as the sponsor’s spread, the relative spread of the insurers and the PRT bid pricing.
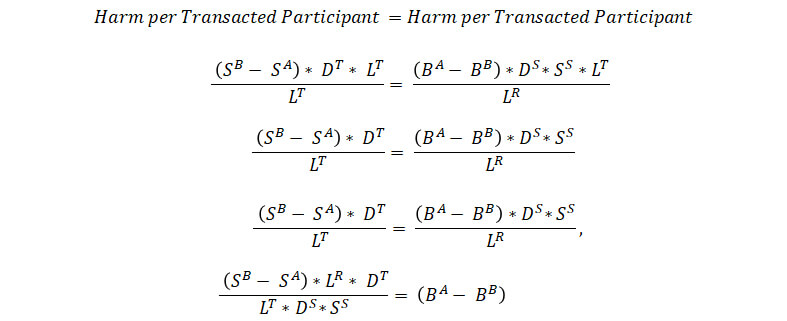
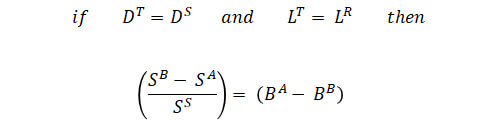
In the body of this paper, we made the simplifying assumptions that the duration of the transacted liability equaled the duration of the sponsor contribution stream and the liability size in each group was the same. That is,
[1] Throughout, we will assume the duration of the annuity being purchased is 10 years. So a 4% ELB corresponds to a 40-bps spread difference between the insurers.
[2] For simplicity, this example ignores the role PBGC benefits play in reducing the remaining participants’ risk to the sponsor. If the remaining participants’ benefits all fall below the PBGC limits, then they accrete no value from the plan being more well-funded. That is, they have no credit risk exposure to the sponsor. Accordingly, the fiduciary must pick the safest available provider to comply with 95-1.
[3] Extreme examples may help aid intuition. 1.) If the sponsor had no credit risk whatsoever (i.e., zero spread rather than the 200-bps spread), then the benefit to the remaining participants of the additional $25mm in funded status is actually zero – the sponsor will always be able to fulfill the obligations of the plan with additional contributions; and 2.) If the sponsor had defaulted yesterday with no recovery value (i.e., infinite spread), the benefit to the remaining participants is the full $25mm.
[4] Using the sponsor’s spread is a highly conservative approach with respect to the central point of this paper. The sponsor’s credit spread is the market price for senior, unsecured debt. But the receivable owed to the pension plan is higher in the capital structure than the sponsor’s marketable debt as a pension plan typically receives more favorable treatment in bankruptcy court. Accordingly, the appropriate spread to use in the formula above would be lower, leading to an even smaller harm to the remaining participants.
[5] It may seem odd that a fiduciary is permitted to harm any beneficiaries – seemingly a contradiction of the definition of fiduciary. This is where the role of the two agents (and the sequence of their actions) matters greatly. The settlor chooses first to settle the liability. The fiduciary acts second and must do their best to minimize the harm to the participants that results from the transaction.
[6] For simplicity, we assume the liability of the transacted participants equals the liability of the remaining participants and the duration of the annuity sold equals the duration of the sponsor contribution stream. See appendix for complete equation.