In a recent Perspectives post, “Pension Risk Transfers May be Transferring Risk to Beneficiaries,” we outlined our market-based measure of the creditworthiness of common Pension Risk Transfer (PRT) providers. Our article concluded that the large range of providers’ creditworthiness calls into question whether annuities of all PRT providers do indeed qualify as “safest available.” This post examines whether our market-based measure, and the resulting Economic Loss to Beneficiaries (ELB), is materially impacted by the size and liquidity of the insurer bond market.
As discussed more fully below, this detailed analysis of the FABN (Funding Agreement Backed Notes[1]) market confirms our original conclusion that the wide range of default risk for common PRT providers is too large for each such insurer to be considered the “safest available.” Moreover, as noted in our prior article, since a pensioner’s benefit is fixed, they are not compensated for bearing the risk of lower quality PRT providers; the ELB helps to quantify such uncompensated risk.
Background
We developed our market-based measure of the creditworthiness of common PRT providers and the resulting ELB to aid fiduciaries’ identification of the “safest annuity available,” per the Department of Labor’s Interpretative Bulletin 95-1. Using readily available market spreads on bonds issued by PRT providers that are pari passu with policy holders (specifically, spreads on FABNs), our measure utilizes the market’s ability, and incentive, to incorporate all other risk assessments (e.g., published ratings, capital ratios, etc.) into the FABN pricing and thus, more holistically assess risk.
In our prior article, we defined the wedge between the safest insurer and other insurers as the Economic Loss to Beneficiaries (ELB). That article concluded that the market-based range of the insurer’s credit-worthiness was a whopping 14% of the value of annuity transaction amounts and suggested that pensioners risk losing as much as $5b annually in the form of uncompensated credit risk to lower quality insurers.
An intuitive appeal of a fiduciary utilizing a market-based measure of creditworthiness is that one doesn’t need to be an insurance industry expert to understand differences in insurance companies, one need only believe that financial markets generally, and the FABN market specifically, are reasonably efficient. Given the over-the-counter nature of the bond market, a natural question is whether the observable FABN spreads are appropriately indicative of the credit risk of the insurers or are they impacted in a material way by the size and liquidity of that market? Examining transaction data from the FABN market helps us answer that question from two perspectives:
- Price discovery – Is there sufficient trading volume to safely conclude that prices reflect market participants’ valuations?
- Liquidity premia – Could varying liquidity across insurer bonds lead to a range of liquidity premia which could distort the ELB estimates?
The following analysis of the FABN market confirms our original conclusion that the range of insurer creditworthiness seems too great to all be considered “safest.” Though the refinements in this paper do move some PRT provider’s ELB modestly (up to 1.1%), there remains a 12.8% range between the safest and least safe insurer, as a percent of the value of the PRT transaction. Said differently, a participant receiving an annuity from the lower quality insurers is receiving a financial instrument that is worth as much as 12.8% less than that same annuity from the “safest” provider, based on market pricing.
Size of FABN Market
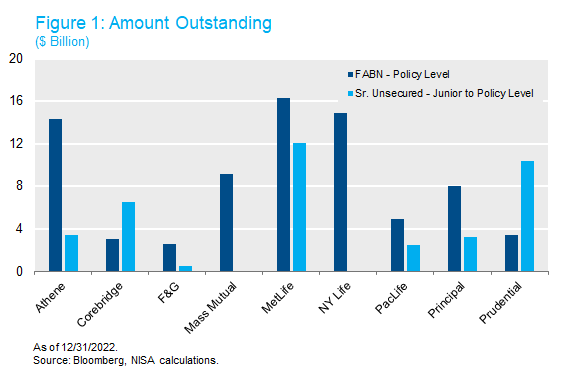
Admittedly, the FABN market is not the most well-known and would rarely (read never) grace the screens of CNBC or Bloomberg. But like many corners of the bond market, it is surprisingly large. As of year-end 2022, the total issuance in the market was roughly $160b, with the largest issuers having over $14b of bonds outstanding – hardly an odd lot market.[2] Based on this size, an average mispricing of bonds by 10 bps of yield would result in the market being over/understated by $700mm, assuming an average bond duration of 5 years. The scale of the market alone would suggest participants would intervene to take advantage of meaningful mispricings. But we can do better than simple reasoning by examining the actual transaction data.
FABN Primary Market
Bonds don’t just spring forth from the heads of the bond gods. Bonds are issued in the primary market, and by definition, the entire issue is sold at issuance. In the corporate market, this process begins with “price talk” between the underwriters and potential investors. When the new issue is ultimately brought to market, investors enter orders based on their willingness to accept the spread on the deal at time of issuance. A different way to think about the new issue market is that it is one large block trade – the issuer selling a large block of bonds to a group of investors at an agreed upon spread. For FABNs, these blocks can be quite large. The median issue size of the bonds in Figure 1 is roughly $500mm, with issues as large as $1.75b. So, each time a bond is issued the market sets the clearing price for that issuer’s credit risk, effectively via an auction. Clearly on the day of issuance, with hundreds of millions of investors’ dollars at risk on average, across many investors, price discovery is alive and well.
Secondary Market
Even if large amounts of bonds trade on issue date, liquidity could decline after a bond is issued. In fact, all else equal, a bond’s liquidity does deteriorate as it ages. So just how liquid is the secondary market for FABNs? Here again, our findings point to material daily volumes that support the use of FABN spreads as strong market indicators of credit risk.
To assess the liquidity of the FABN market, we examined TRACE[3] data for calendar year 2022 for the PRT providers from our original paper. Figure 2 presents the average trading volumes as well as the 25th and 75th percentiles.
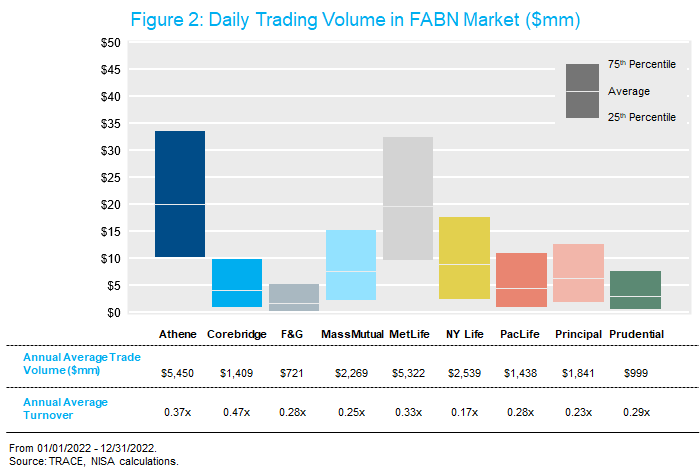
Average daily trading volumes range from $3mm on the low end to over $20mm on the high end. And frequently (as measured by the 75th percentile), daily volumes of some issues exceed $30mm. By comparison, daily volume of $20mm is comparable to household equity names like Hyatt, Lennox and Murphy Oil. Just as it would be hard to argue the stock price of these equities doesn’t reflect market sentiment, we can feel confident that price discovery occurs in the secondary FABN market.[4]
Whenever available, NISA always assigns much higher value to market data vs. other measures of value or risk (e.g., rating agencies, analyst recommendations, etc.). After all, market participants are required to, quite literally, put their money where their mouth is with respect to their views. So when, for example, $20mm exchanges hands on a daily basis for a given insurer, we would argue there is no better measure of credit risk than the clearing price of such transactions. After all, for each trade, the buyer and the seller both agree to the terms of the transaction – with full knowledge of all available information (e.g., ratings, recent news, capital ratios, etc.).
Directional Adjustments to the ELB Measure for Relative Liquidity
Clearly, there is ample trading volume in the FABN market to have confidence that market prices of the bonds reflect market participants’ valuations. However, while the trading volume may be sufficient for price discovery, it remains possible that the liquidity of a given issuer does influence its bonds’ traded spreads, and accordingly, our measure of credit risk. This is a subtle, but very important point in bond markets. Ample liquidity in FABNs reassures investors that quoted prices reflect marked-to-market valuations. But relative liquidity can in fact affect their valuations – where less liquid bonds demand a higher liquidity premium, i.e., higher spread all else equal.
Conceptually, a bond spread can be thought of as compensation for the issuer’s credit risk plus a liquidity premium. While liquidity premiums for investment grade bonds are generally a small portion of the spread,[5] it is useful to look further at the liquidity statistics to determine if they are helpful in refining our ELB. Importantly, for the purpose of evaluating issuers for compliance with 95-1, we are primarily interested in the relative liquidity of each issuer’s bonds. If the market demanded an equal liquidity premium from each issuer it would absolutely impact the spreads but would have no bearing on the relative credit risk of the insurers, and therefore have no impact on our ELB measure.
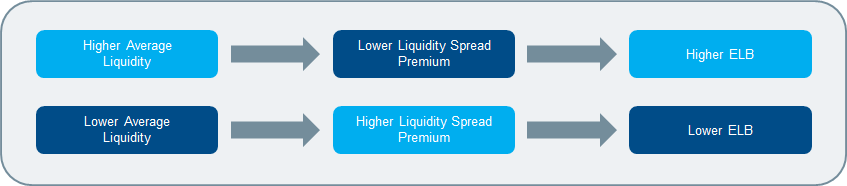
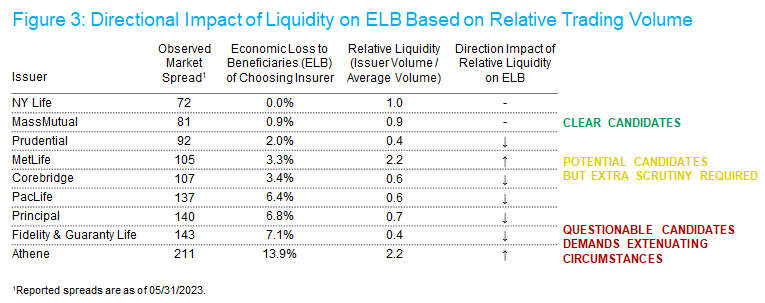
All else equal, less frequently traded bonds demand a higher liquidity premium via a higher spread. So, we can use the relative liquidity of the insurers’ FABN bonds to assign a relative liquidity premium.[6] The table below reports updated ELB calculations from the original paper and then assigns the directional impact of liquidity on each issuer. This adjustment is based on the ratio of the traded volume of each issuer to the average traded volume of the group of insurers. Since there is an inverse relationship between trading volume and liquidity premium and an inverse relationship between liquidity premium and the portion of spread that represents credit risk, there is a direct relationship between trading volumes and the size of the ELB. For example, for two insurers with the same observed spread, the insurer with higher trading volumes will have the higher ELB. Clear as mud? These relationships are outlined succinctly below with Figure 3 reporting the corresponding impact on the insurers ELB measure.
Quantitative Adjustments to the ELB Measure for Liquidity
While directional liquidity adjustments are instructive, a more concrete measure would be ideal. Fortunately, Liquidity Costs Scores (LCS), as published by Barclays help us do just that. Barclays defines the LCS as a measure of the cost of an immediate, round-trip transaction of a typical institutional size trade, expressed as a percent of the bond’s price.
The table below backs out an estimate of the liquidity premium for each insurer using the LCS of the reference bond used in the original analysis. To accomplish this, we divided the LCS by the duration of the bond – thereby translating a price measure of liquidity to a yield measure. We then subtract this yield bid/offer from the market spread of the bond. The resultant adjusted spread can be viewed as the compensation investors demand purely for accepting the credit risk of the issuer.[7] We use this spread to calculate the Liquidity Adjusted Economic Loss to Beneficiaries in Figure 4.
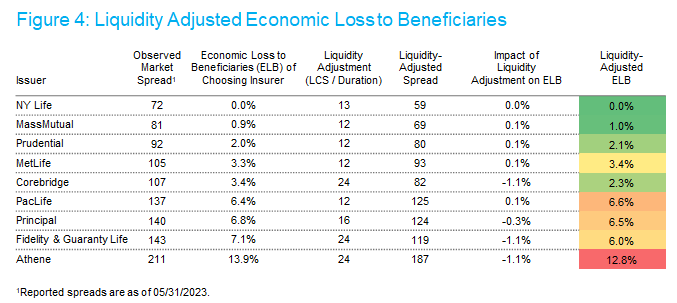
The liquidity adjustments reduce the ELB for some issuers by as much as 1.1%.[8] Importantly though, even after adjusting for market liquidity, the range of relative credit risk across PRT providers remains remarkably high. Using this adjusted measure, pension beneficiaries stand to accept uncompensated credit risk equal to as much as 12.8% of the value of their pension benefit.
Conclusion
In our previous paper, we introduced a market-based measure of the credit risk faced by annuitants in PRT transactions. This measure relied on the market pricing of FABN bonds issued by insurance companies that are pari passu with policy holders of the corresponding insurer. Given the over-the-counter nature of the bond market, a natural question arises regarding the reliability of the pricing data. Even a casual inspection of trading volumes suggests robust market activity – on average, $90mm of FABNs trade daily with some issuers alone exceeding $20mm of daily volume. This amount of activity allows us to confidently estimate market’s assessment of a given bond’s value and correspondingly, the credit risk charge that the market demands of each insurer.
Liquidity measures, notably Liquidity Costs Scores, can indeed be helpful to refine insurers’ ELB estimates. Using current data, ELB estimates can change by as much as 1.1%. Though this refinement has only a modest impact on the estimated range of creditworthiness of the various PRT providers at this time, it is an important improvement on the raw measure and is likely to have a larger impact during periods of high market stress where greater portions of spread could be related to market liquidity conditions.
Similar to our conclusion in the first paper, we believe our market-based measure of credit risk conclusively demonstrates an exceptionally wide range of default risk of the various PRT providers. Consequently, any reasonable reading of the “safest annuity available” standard in IB 95-1 would require narrowing the universe of potential PRT providers.
[1] FABNs are debentures issued by insurance companies backed or collateralized by funding agreements or depository-like agreements which guarantee a stated rate of return. Generally, the proceeds raised from the issuance of these securities are used to fund investments for insurance companies in an attempt to out earn the cost of funding. They are typically pari passu with policy holders – meaning they have the same standing as policy holders in the event of insolvency.
[2] Federal Reserve; Enhanced Financial Accounts; Funding Agreement-Backed Securities (FABS) Website, Historical Data as of 12/31/2022; https://www.federalreserve.gov/releases/efa/efa-project-funding-agreement-backed-securities.htm.
[3] The Trade Reporting and Compliance Engine (TRACE) is the FINRA-developed vehicle that facilitates the mandatory reporting of over-the-counter transactions in eligible fixed income securities. All broker-dealers who are FINRA member firms have an obligation to report transactions in TRACE-eligible securities under an SEC-approved set of rules.
[4] In many cases the average volume of FABNs surpass that of senior unsecured debt. See Figure 1 above.
[5] Like all risk premia, the liquidity premium is unobservable. But it is more observable than some. Importantly, this can be done controlling for other relevant pricing factors in corporate bonds (e.g., credit quality, maturity, etc.). For example, the spread between a corporate bond’s CDS (more liquid) vs. a like maturity bond (less liquid) can be a proxy for a given bond’s liquidity premium. In addition, as many corporate issuers have many issues outstanding, comparing two bonds of the same issuer that are close in maturity can be a good proxy of the liquidity premium. In either case, these exercises tend to lead to a relatively small portion of the overall spread being assigned to the liquidity premium.
[6] In the previous paper, we made the simplifying assumption that if any liquidity premium exists, it is the same across all issuers.
[7] We believe dividing the LCS by the duration of the bond is a reasonable translation of the liquidity cost of a bond to its spread. One way to interpret this approach is that the entirety of the bid/offer is demanded by investors and the average holding period is the duration (i.e., approximately weighted average life of the bond). Suggesting the entirety of the bid/offer spread will be returned to investors via spread likely overstates the liquidity premium as some bid/offer costs must be borne simply to gain access to the corporate bond market. Using the duration of the bond as the average holding period could of course be debated, but in this case it happens to align well with the turnover data. That is, the implied holding period from the turnover data (i.e., the reciprocal of the annual turnover) is reasonably similar to the duration of the reference bonds on average. This is probably just a coincidence, but a convenient one.
[8] LCS measures have at times been criticized as being too large on average. Accordingly, we looked at TRACE data, examining transactions that occurred in close proximity to calculate the effective bid-offer of each FABN. The resulting effective bid offer was, on average, about 70% smaller than that implied by the LCS measure. As such, using this approach instead of the LCS method would have a near trivial impact on the estimated ELBs.