While we have seen shifts from active to passive across public markets, most notably large cap U.S. domestic equity, the alternatives space has historically been insulated to this change. While this may remain true for a large portion of the alternative investment universe, we believe a development may be on the horizon; led by managed futures and CTA type strategies, often referred to as trend strategies. We would like to examine whether a more passive alternative exists with respect to these strategies and how an investor could potentially implement such a solution. We believe there is a growing sentiment that trend strategies are very similar (“Trend is Trend”), and passive implementation should be a viable approach. This passive alternative may provide a solution to another problem as well: there seems to be little information available for asset owners to evaluate the active strategies and higher fees typically seen in the marketplace. After all, if the managed futures space is just delivering another form of beta, why pay active fees in order to achieve the returns?
From NISA’s perspective, an increasingly popular way to obtain passive trend exposure is through systematic strategies, typically designed by either dealers or third party index providers. In this post we explore the merits of a strategy published by S&P, referred to as the Systematic Global Macro Index (“SGMI”) as a possible benchmark and passive strategy. Now, simply because an index provider produces an index, doesn’t mean it is a good representative of a particular investment space. Which brings us to an important question, is there validity to “Trend is Trend?”
The correlation matrix below compares three major categories of the market: active trend composites, systematic strategies, and traditional beta markets. A few important things to point out with the analysis presented below:
- Trend composites have very similar correlations with each other. This indicates to NISA a relative consistency in the types of active strategies being captured by these composites. In this analysis NISA used the Soc Gen CTA Index. Other composites (HFRX Macro Systematic Diversified CTA Index and the BarclayHedge U.S. Managed Futures Industry BTOP50 Index) produce similar results.
- Systematic strategies tend to have an average correlation of around 0.6 to one another and the trend composites. Again this points to similarities, but to be fair it also exhibits some differences between various providers. The SGMI is no exception.
- Across strategies we see similar correlations to rates, equities, and commodities. Given the common goal of utilizing a trend strategy to provide a diversified source of return, most of these strategies seem up to the task.
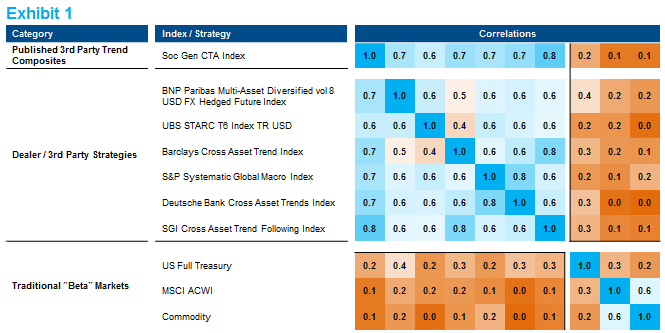
Source: NISA, Bloomberg. Past performance is not indicative of future performance.
Analysis from 02/28/2007 – 12/31/2018 to include the 2008 market crisis environment.
Selected strategies reflect standard published indices. Investors cannot directly invest in an index.
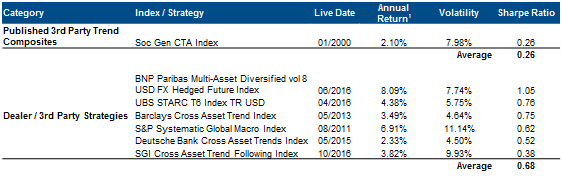
While correlation among risk strategies helps assess common risk factors, the risk/return tradeoff of a particular strategy is useful in assessing desirability. In trend space, looking only at return can be misleading since providers can pursue different levels of volatility as part of their strategy construction. For that reason, we find the Sharpe ratio a key measure for strategy comparison. In the graphics below we show the hypothetical growth of one-hundred dollars for the various trend strategies along with relevant statistical measures.1 Keep in mind, just looking at historical information can be tricky, especially considering third party strategies that may have a limited track record. The third party strategies that are shown in Exhibit 2 are those that have been “live” to NISA’s knowledge, since at least October 2016.
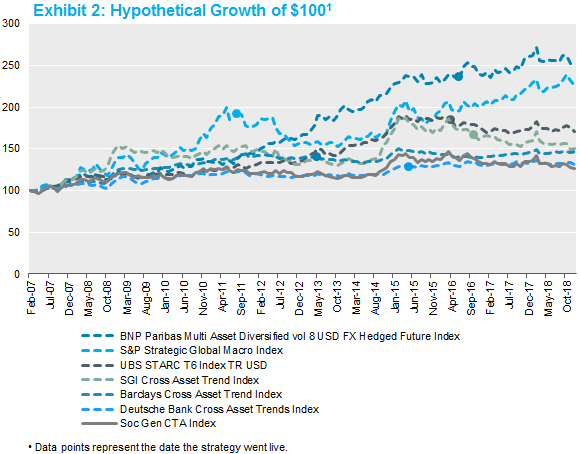
Source: NISA, Bloomberg. Past performance is not indicative of future performance.
Analysis from 02/28/2007 – 12/31/2018 to include the 2008 market crisis environment.
Selected strategies reflect standard published indices. Investors cannot directly invest in an index.
1As previously stated, the 3rd party strategies shown in this analysis have been “live” since at least October 2016. Data reported prior to a strategy’s live date are based on back-tested results of the strategy calculated by the index/strategy provider. Back-tested results are always achieved through a retroactive application of data with the benefit of hindsight, and different time periods would provide different results. Past performance should not be viewed as indicative of future results.
As with most strategies NISA implements, one of the benefits of determining a benchmark (and running against that benchmark) is the ability to have a framework to layer on customization and ultimately compare the results of that customization to the benchmark solution. Some topics, outside of the scope of this perspectives post, which may be interesting include:
- limiting long equity exposure as part of a trend strategy (most investors already have a fair amount of long equity exposure),
- inclusion of additional markets outside of the published SGMI benchmark (do more markets add additional diversification?), and
- adjusting regression lookback periods.
As mentioned at the onset, we believe an approach similar to the one laid out above that utilizes systematic strategies can serve as an attractive alternative to active trend products. Lower fees, daily liquidity, and full transparency represent additional attractive features over many active products. Even if a more passive trend instrument doesn’t fit within your objectives, consider utilizing a published benchmark as a way to measure your current stable of managers. Perhaps this starts a trend.