

CPI inflation printed above expectations for the month of April. The figure was biased higher by a statistical quirk dating back to the government shutdown, and there are good reasons to believe the underlying inflation trend is lower than recent readings suggest. Nevertheless, headline inflation at 3.78% y/y presents a challenging backdrop as Kevin Warsh advances through the confirmation process towards his first day on the job next week.
Headline CPI increased 0.64% m/m in April. The annualized rate in April and over the past three months is now above 7%. The Iran war drove energy prices higher by another 3.8% in April, following a 10.9% increase in March. Food inflation also picked up, rising by 0.5% m/m in April or 6.2% annualized, perhaps a sign of things to come if fertilizer prices remain elevated. Headline CPI has now increased by 3.78% over the past year. That headline figure will likely rise above 4% in May unless energy prices start to decline. We can explain away some of the heat in these inflation readings, but a fair amount of mental gymnastics is required, as you’ll see below. These wonky economic arguments will sway some FOMC members but will be ignored by most consumers as they drive past gas station signs reading $4, $5 and $6 per gallon.
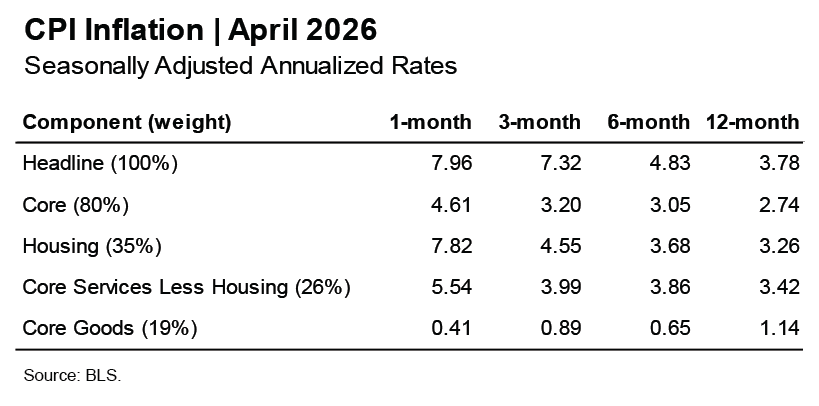
Core CPI increased 0.38% m/m in April, an annualized rate of 4.61%. Much of the acceleration reflects a statistical distortion in housing inflation that traces back to last fall’s government shutdown. The BLS measures rent inflation through six rotating panels, each surveyed every six months. One of these panel surveys was skipped in October during the government shutdown, which distorted the October inflation data lower. When this panel was surveyed in April, its responses captured 12 months of accumulated rent change instead of the usual six. This effectively doubled that panel’s contribution to the April print and pushed housing CPI to 7.82% annualized. This is statistical noise that should be ignored. It washes out of the 12-month measure, which spans both the missed October survey and the April catch-up. The underlying multifamily housing market remains soft, with vacancy rates elevated and market-based measures of rent inflation running well below pre-pandemic levels. We continue to expect CPI and PCE measures of housing inflation to trend lower through the rest of 2026 and into 2027.
Tariff Passthrough Looks Complete
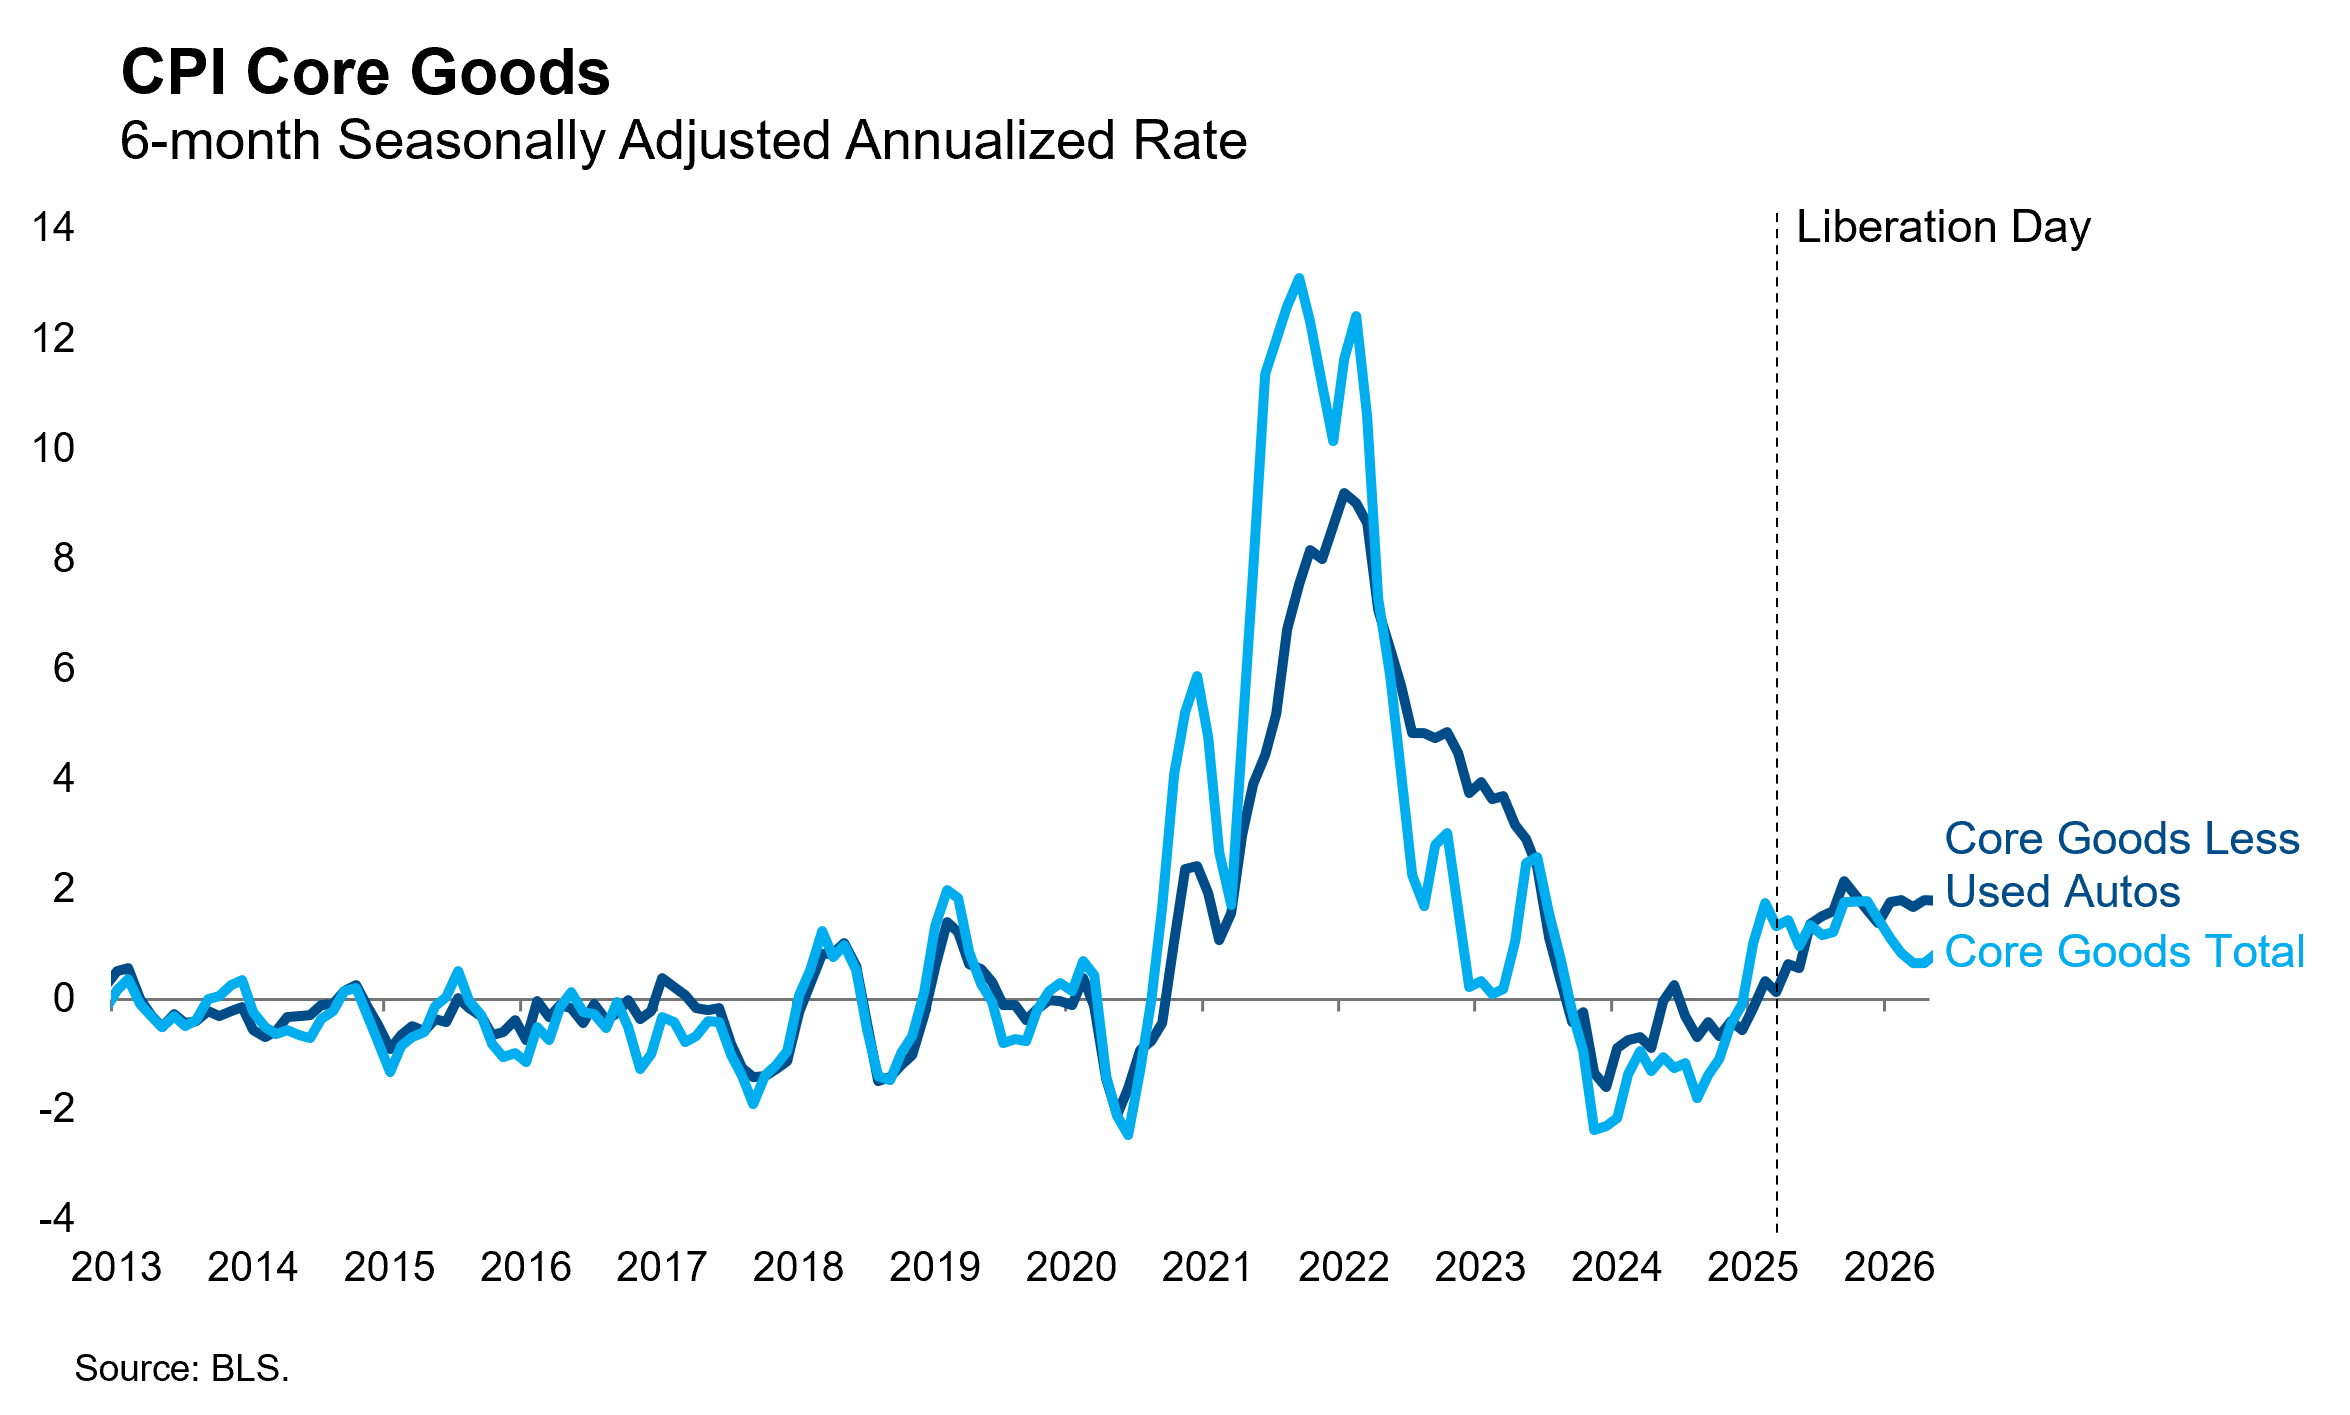
Core goods prices rose 0.03% m/m in April, the fifth consecutive month below 0.11% m/m. These figures were biased lower in all five of those months by outright deflation in used auto prices, which carry a large weight in CPI and are only indirectly affected by tariffs. Excluding used autos from core goods provides a cleaner read on tariff inflation. This measure doesn’t look quite as good, but it’s still trending lower since the peak in January. The April monthly figure was the lowest since before Liberation Day, raising hopes that the passthrough from tariffs might now be complete, right in line with our expectations. If confirmed in the months ahead, this will clear one of the roadblocks delaying further rate cuts. The other roadblock… er, Strait-block… remains firmly in place, with energy prices only slightly below their wartime highs. The Fed is unlikely to resume easing until energy prices have convincingly peaked.
Even after the hopefully transitory disruptions from tariffs and energy prices have dissipated, the Fed will have to assess the underlying inflation outlook. The most troubling news in that regard in the April report was the non-housing services component, which rose 0.45% m/m or 5.54% annualized and is on an accelerating trend since the shutdown. It’s possible that this reflects a new source of inflationary pressure, but we wouldn’t worry too much about this labor-sensitive component unless we saw the labor market tighten significantly. Furthermore, we expect that disinflation in housing and core goods will allow underlying core inflation to fall back towards 2% even if non-housing services runs hotter than the pre-pandemic norm.
As we warned, a fair amount of wonkery is required to explain away these elevated inflation readings. We think those explanations hold water, but they do not change the fact that headline inflation is running over 7% annualized over the past three months and is likely to top 4% in the y/y figure next month. With crude oil prices still above $100 as we write, there is little doubt that the war has delayed the Fed’s next rate cut. We maintain our view that the next cut will arrive in December, but each day the war drags on, the risk of further delay increases.