background swath

Chief Economist Updates

The Response Rate Crisis Is Overblown, for Payrolls Anyway

  • Contributors:
  • Stephen J. Douglass
Release Rates Graph

The large revisions in the July payrolls report have awakened the popular press to the response rate crisis that experts have been monitoring for more than a decade. Important context is sadly missing from the narrative. Response rates to government surveys are indeed falling around the world. It is a serious problem that needs to be addressed. But the crisis is mostly limited to surveys of households. As most readers will know, the monthly payrolls report (formally the Employment Situation Report) consists of two separate surveys: the household survey queries workers about their labor force status and produces the unemployment rate; the establishment survey queries employers about their headcount and produces the nonfarm payroll count and average hourly earnings.

The response rate for the household survey (which produces the unemployment rate) has declined sharply from 90% in 2013 to 67% in July 2025. Economists at the BLS and elsewhere have been studying this issue from the moment it began, and are addressing it with a multiyear modernization plan that began in 2023.

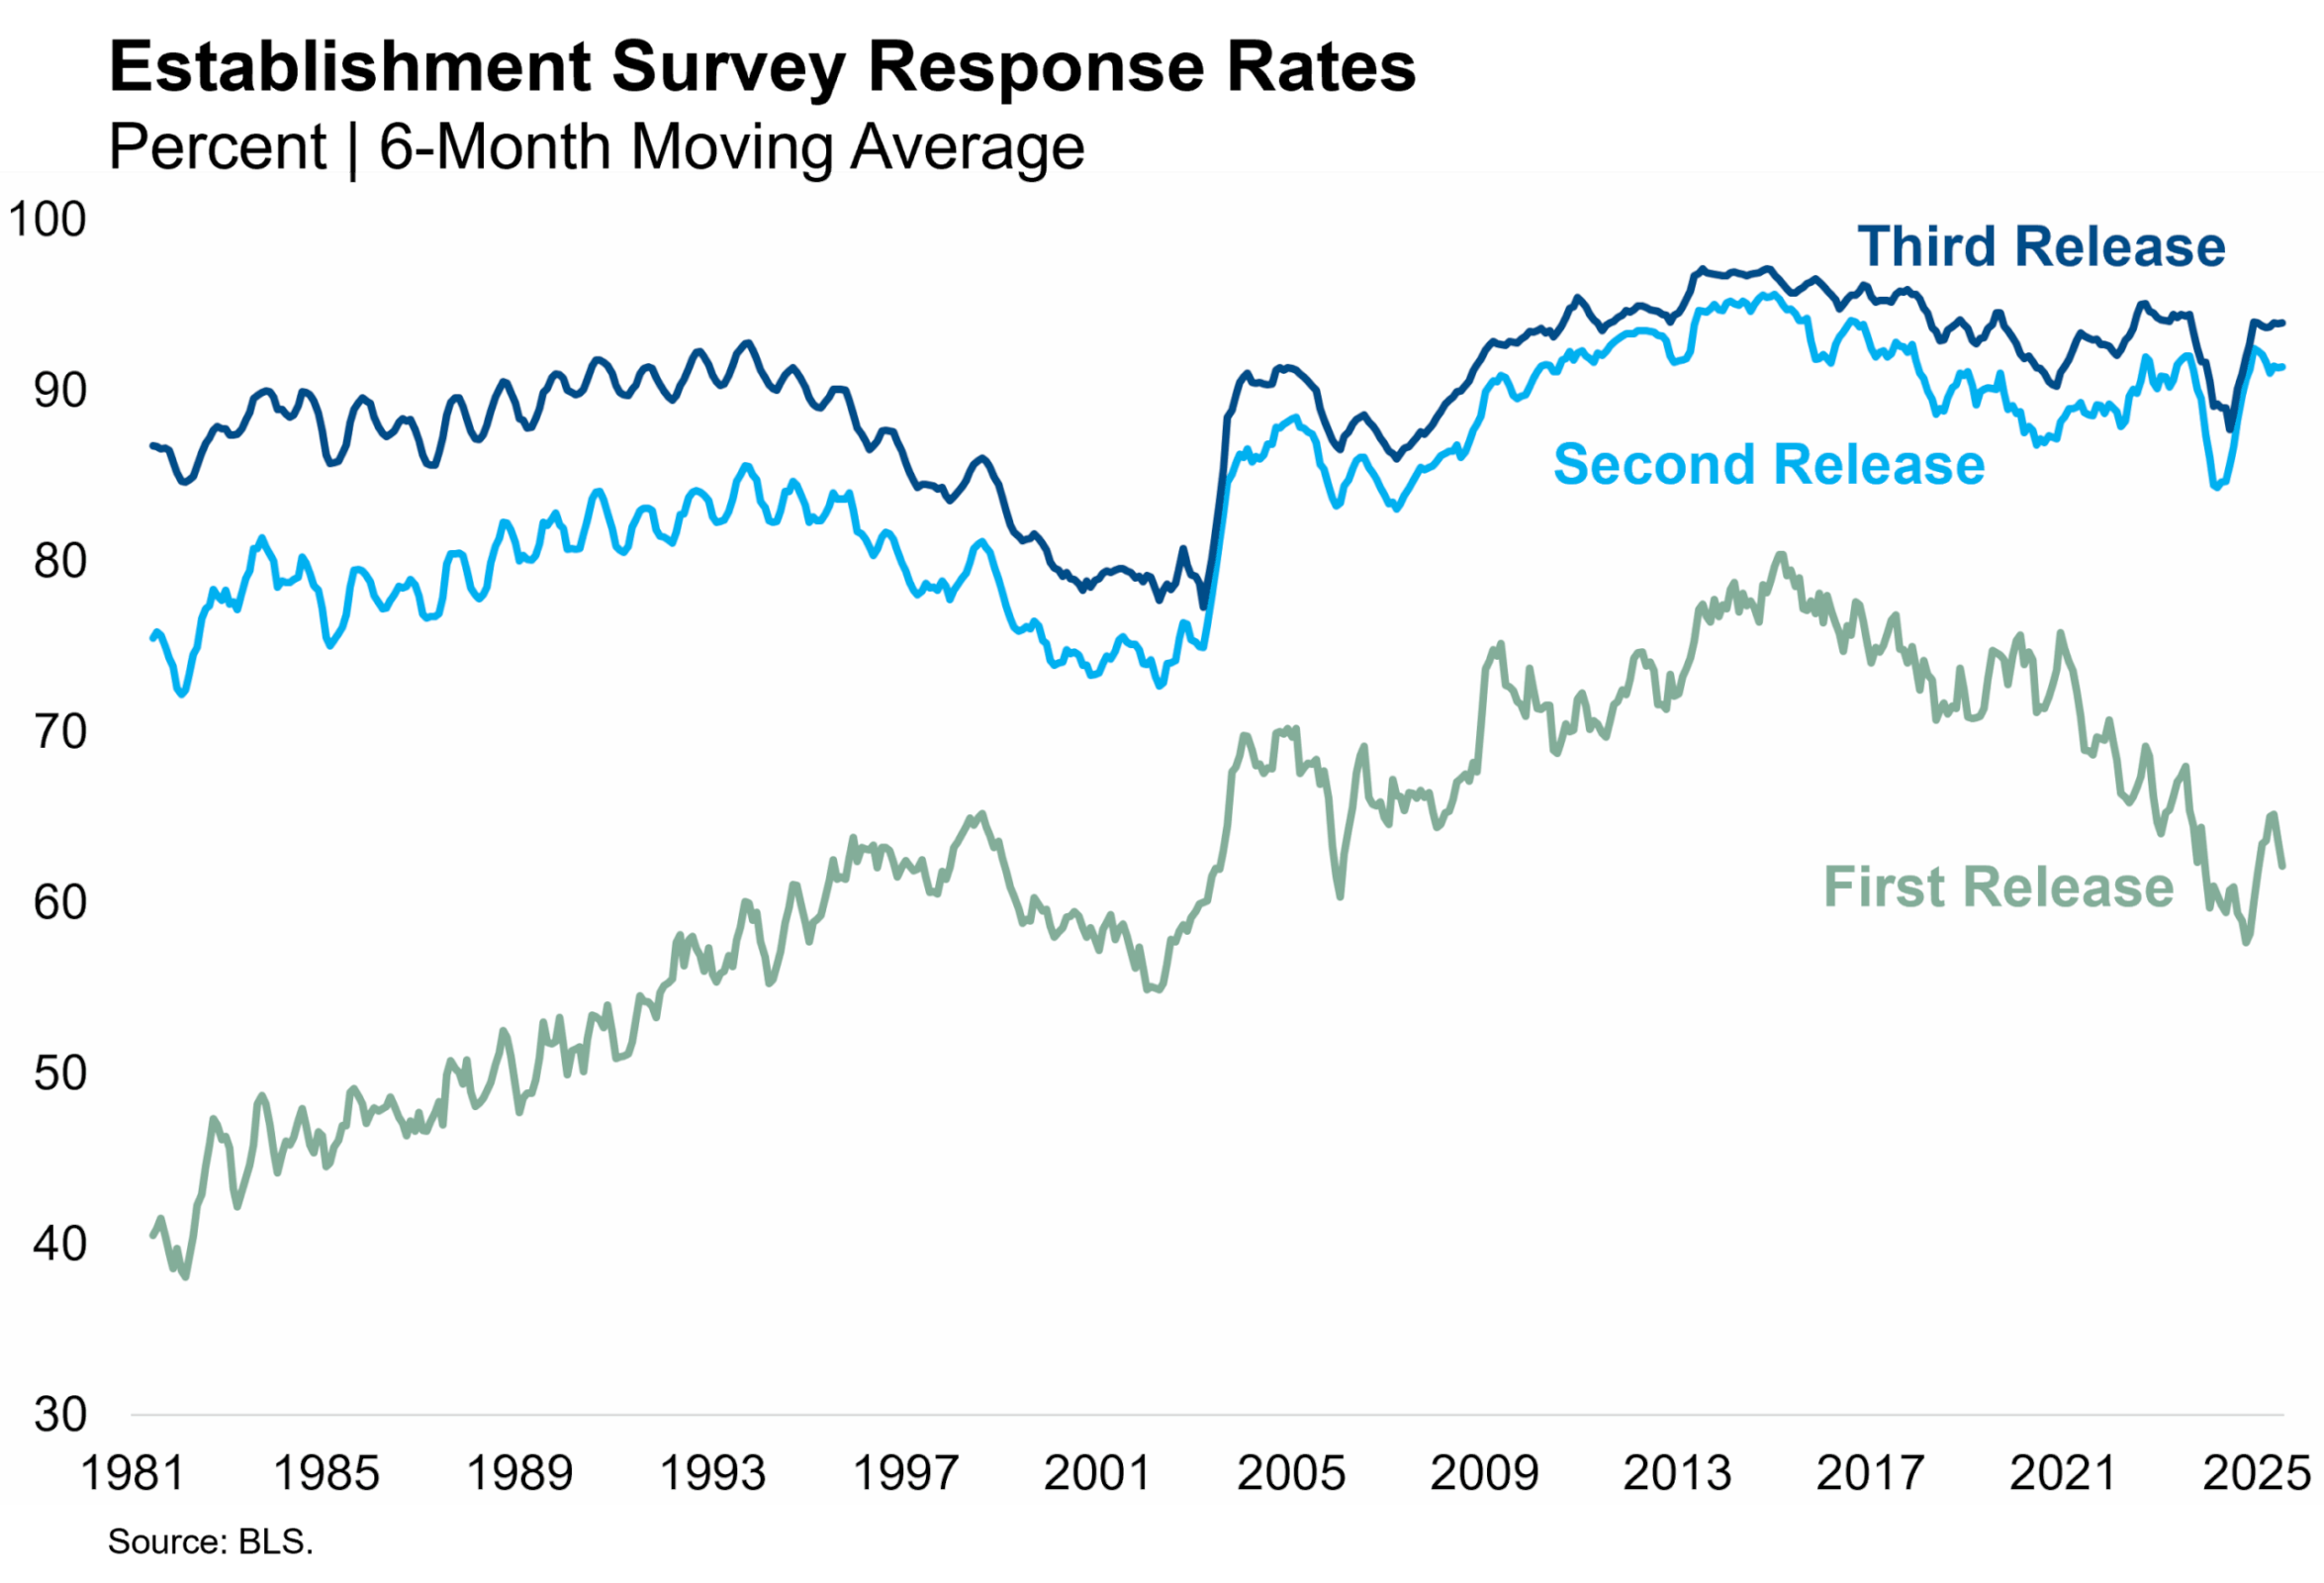
Given all the hysterics about the revisions to the payrolls report in recent weeks, you may be surprised to learn that response rates in the establishment survey are holding up quite well in comparison. As everyone is now well aware, the establishment survey collects responses for a given month over three consecutive months and revises the initial estimate twice as later responses arrive. The chart below shows response rates across the three releases since 1981 (the earliest data available). Response rates for the initial release have declined materially since reaching an all-time high in 2015. The BLS should increase efforts to raise those initial response rates (though this will require more funding). However, response rates for the second and third releases have rebounded from a brief pandemic decline and remain near all-time highs today. More than 93% of eligible participants have responded by the third release in every month of 2025.

The establishment survey does not have a problem of nonresponse. It has a problem of delayed response. This delay could increase the size of revisions as we saw in July, if the late responses are biased stronger or weaker than the early responses. The chart shows that the response gap between the first and third releases has always existed to varying degrees. This is why we say that the second and third releases are more accurate. Financial market participants might have to be a bit more patient, which is sadly not our strong suit. Most importantly for the economic outlook, average monthly payroll growth in May and June of 2025 is much more likely to be 16,500 as estimated in the later releases than the 143,000 average from the initial releases.

Release Rates Graph

Disclosure Information

By accepting this material, you acknowledge, understand and accept the following:

This material has been prepared by NISA Investment Advisors, LLC (“NISA”). This material is subject to change without notice. This document is for information and illustrative purposes only. It is not, and should not be regarded as “investment advice” or as a “recommendation” regarding a course of action, including without limitation as those terms are used in any applicable law or regulation. This information is provided with the understanding that with respect to the material provided herein (i) NISA is not acting in a fiduciary or advisory capacity under any contract with you, or any applicable law or regulation, (ii) that you will make your own independent decision with respect to any course of action in connection herewith, as to whether such course of action is appropriate or proper based on your own judgment and your specific circumstances and objectives, (iii) that you are capable of understanding and assessing the merits of a course of action and evaluating investment risks independently, and (iv) to the extent you are acting with respect to an ERISA plan, you are deemed to represent to NISA that you qualify and shall be treated as an independent fiduciary for purposes of applicable regulation. NISA does not purport to and does not, in any fashion, provide tax, accounting, actuarial, recordkeeping, legal, broker/dealer or any related services. You should consult your advisors with respect to these areas and the material presented herein. You may not rely on the material contained herein. NISA shall not have any liability for any damages of any kind whatsoever relating to this material. No part of this document may be reproduced in any manner, in whole or in part, without the written permission of NISA except for your internal use. This material is being provided to you at no cost and any fees paid by you to NISA are solely for the provision of investment management services pursuant to a written agreement. All of the foregoing statements apply regardless of (i) whether you now currently or may in the future become a client of NISA and (ii) the terms contained in any applicable investment management agreement or similar contract between you and NISA.

Agree to Terms

Please review and accept the following to proceed. I have read and agree to the Terms of Use, Disclaimer, PSRX Disclaimer and Privacy Policy. I am either (i) an investment professional and an employee of an institutional investor, or a consultant to an institutional investor, or (ii) an employee of, or a student in, an institution of higher learning and I am involved in the study, research or teaching of subjects related to investments, finance, or economics. I reside in the United States or Canada. I understand that the information is not and should not be regarded as investment advice or as a recommendation regarding a course of action. By clicking “Accept” below, you hereby acknowledge, understand and accept the foregoing.