



The AI infrastructure boom is reshaping a lot of things—equity markets, capital spending, even the power grid. Add one more to the list: the yield curves that corporate pension plans use to discount their liabilities.
When discounting their liability, these pensions typically use yield curves based on AA corporate bonds. These days, an increasingly large share of the AA-rated universe is now issued by hyperscalers—the small group[1] of tech giants driving the buildout of cloud and AI infrastructure.
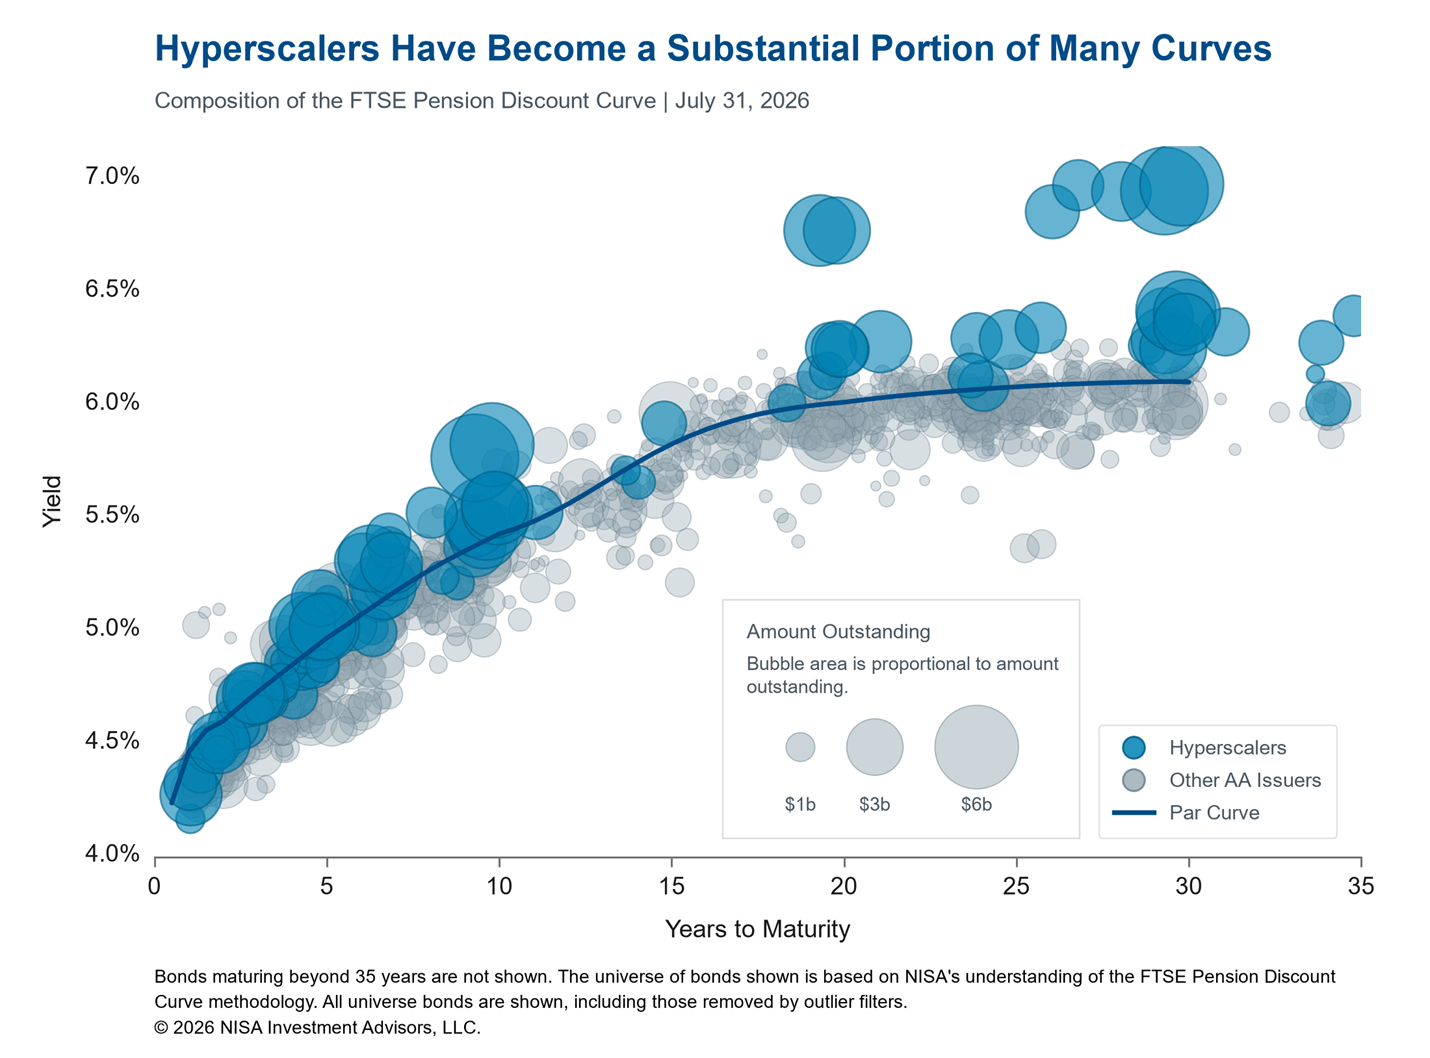
The chart below shows the constituents of the current FTSE AA curve, with bonds issued by hyperscalers highlighted:
While these companies were already a large part of the AA universe historically, the AI boom has caused them to issue considerably more debt, and the spreads of that debt have widened relative to other AA bonds:
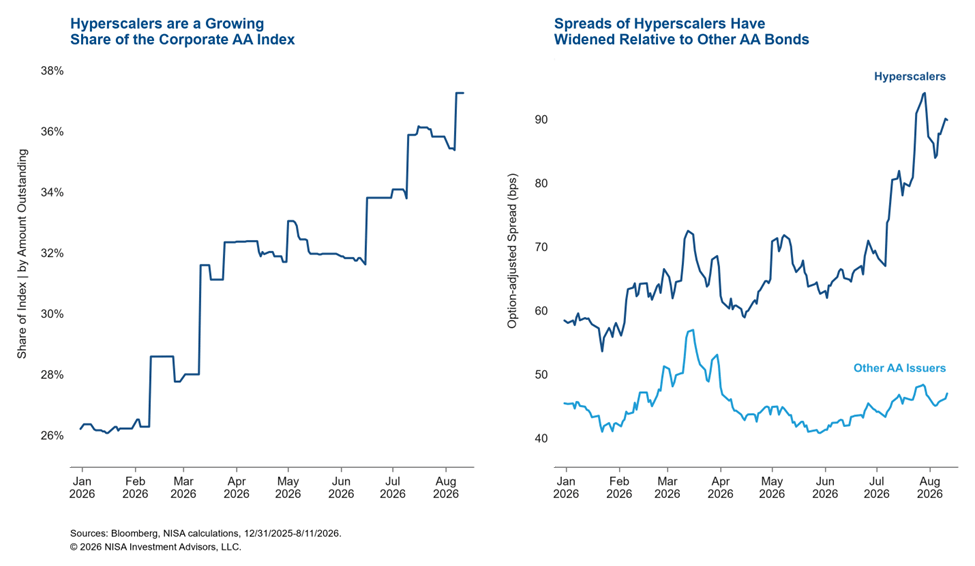
This has pulled many pension discount curves higher, resulting in reduced liability present values and an improvement in funded status, all else equal.
Downgrades: A Double Headwind
When a bond makes up a large portion of a pension’s discount curve, an investment manager may feel pressure to hold it to track the liability closely. But this creates a concentration risk with an asymmetric downside.
If that bond gets downgraded, the investor gets hit twice. First, the bond’s spread widens and the investor holding it takes a mark-to-market loss. Second, the downgraded bond drops out of the AA curve universe entirely. Because bonds getting downgraded often trade at higher yields than their AA peers, the remaining curve tightens—pushing up the present value of the liability, meaning the portfolio loses value while the liability grows.
We wrote about this topic in 2017, when GE was downgraded. At the time, GE bonds represented 7-8% of the FTSE AA curve. However, today’s hyperscaler concentration is considerably larger, depending on which curve is used.
Curves are All Different
There are a few providers that each develop their own pension discount curves, and the curves are often proprietary.
The following chart shows the exposure to hyperscalers for 12 commonly used discount curves (based on NISA estimates) for a generic 13 duration liability. It also shows the estimated change in the liability PV if the hyperscaler bonds were to drop out of the curve:
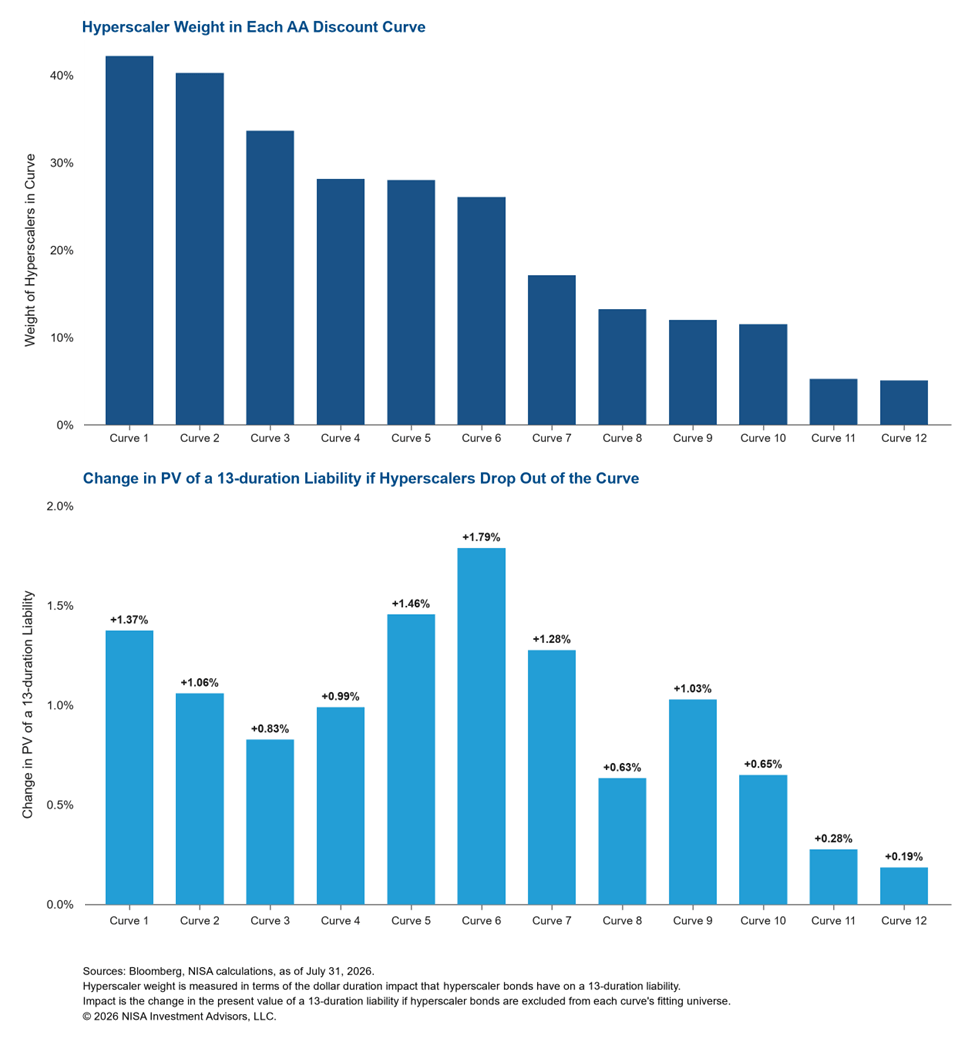
While the chart above demonstrates that the concentration of hyperscalers significantly varies by curve, we believe there are some general trends:
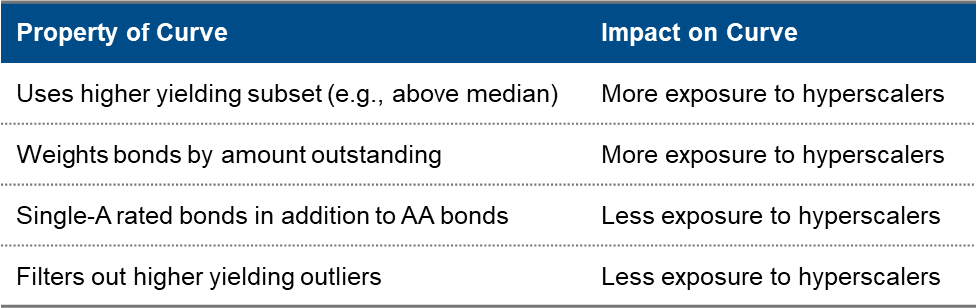
The growing presence of hyperscalers in pension discount curves is not inherently good or bad, but it is a concentration risk that plan sponsors should understand. The impact varies significantly depending on which curve is used, and the downgrade risk is real and asymmetric.
Sponsors should work with their advisors to understand how exposed their curve is to these issuers and whether their LDI portfolio is positioned to handle a potential dislocation. At NISA, this is something we monitor closely across the full landscape of discount curves.
[1] There are actually only three hyperscalers that are AA-rated (Amazon, Google and Meta). For the purposes of this analysis, Nvidia was also included as it is a closely related supplier of AI infrastructure. Other names that are commonly referred to as hyperscalers don’t end up in pension discount curves for various reasons. For example, Microsoft is rated AAA (and only included in some curves), while Oracle is rated BBB. Also, some data center bonds issued by other entities have been issued as 144-A bonds or have sinking provisions, which typically exclude them from pension discount curves.