‘Tis the season for both giving and receiving, and for pension plans it’s been an especially great season for receiving. Since the beginning of the year, equity returns are up 15-25% and the average pension plan’s funded status is up 4-5%.1 At the risk of sounding like Scrooge, however, we wanted to highlight a small wrinkle in the liability discount rate that will likely appear when the year-end discount curves are published.
As most are aware, pension liability discount curves are created based on corporate bond yields. While the rules for inclusion vary by provider, most of the curves will only incorporate securities that have at least one rating of Aa or higher. These discount curves are ostensibly treated as if they were “risk-free,” yet their underlying constituents are inherently risky. Passively owning the exact same assets to hedge the liability will eventually lead to under-performance as the assets suffer from the negative price performance of downgrades while the liability simply excludes those higher yielding bonds during the next monthly reset. Furthermore, these discount curves are often market value-weighted, meaning larger Aa issuers will have an outsized representation in the discount curve. This issuer concentration further makes a perfect hedge of the liability imprudent—few would suggest allocating 11% of their assets to Apple bonds, for example. The challenge of appropriate diversification, as well as the inevitable bleed from downgrades, leads to hibernation strategies with 1% – 1.5% annualized volatility, rather than the nearly 0% volatility that could be achieved by owning Treasuries against a Treasury-discounted liability.
The catalyst for this reminder is the downgrade of General Electric to below Aa by all three ratings agencies.2 GE is the latest of a long line of major issuers to migrate from Aa to A or Baa. Of course, this downgrade is fully priced into the spread of the bonds.3 So while we expect no particular price performance of GE bonds at month-end, these downgrades mean that GE bonds will be knocked out of the Aa quality discount curves. Unfortunately for pension plans, GE was the third largest issuer in the Aa universe. GE bonds accounted for ~7% of the Aa universe and ~8% of the contribution to duration in the FTSE (formerly Citigroup) Pension Discount Curve. GE bonds were 30 – 35 bps wider than the average Aa quality bond on 11/30/17 (corroborating evidence that the market had already priced in this change in quality). If the GE bonds had been excluded from the discount curve on 11/30/17, we would have expected a curve that is on average 2.4 bps lower than the existing curve (see Exhibit I below).
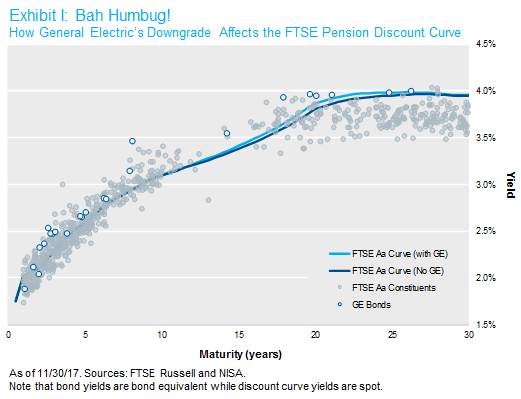
While a 2.4 bps decrease may not seem like much, on a 14-year duration liability this would lead to roughly a 35 bps increase in the present value of the liability. Importantly, inclusion rules (including credit quality, maximum exposure by issuers, yield percentiles, etc.) vary by provider and could magnify or lessen this impact, depending on the specific discount curve.
These issues of perfectly matching discount curves have always existed, and there are plenty of tools that can be used to limit the impact of downgrades or defaults on your liability discount rate. First and foremost is active management, because good managers can add alpha to offset or exceed the losses that come from downgrades. Secondly, diversification of credit exposures, whether by an allocation to return seeking assets or Baa rated bonds instead of single A or higher bonds, can help cover the return gap that will develop over time relative to a passive liability hedging strategy.
None of this should be overly surprising or concerning, and for most would likely go unnoticed during a year when equity returns have spread such good cheer. Still, it’s one of the larger moves we’ve seen in the Aa universe in quite some time, and worth a brief mention.
With that said, we wanted to wish you happy holidays from everyone at NISA and hope you have a great 2018!
1As estimated by NISA’s PSRX Index as of 11/30/2017. Click here for more information.
2On 12/4/17, S&P downgraded GE from AA- to A while Fitch moved GE from AA- to A+ on 11/28/17. Moody’s downgraded GE as well on 11/16/17, though it had rated GE below Aa3 since 4/10/15.
3In point of fact, it’s worth noting that we are currently overweight GE in most of our portfolios.