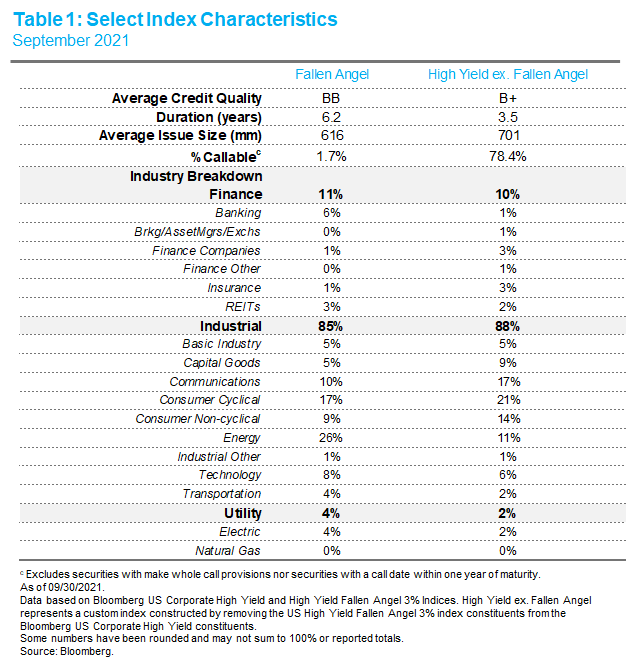
If it wasn’t for the “high yield” classification or the less flattering term, “junk,” fallen angels (i.e., bonds downgraded below investment grade) may not need to fall as far. While high yield may seem like a homogenous asset class, upon further inspection fallen angels would stand out in a “high yield” crowd. While part of the high yield universe, these securities tend to exhibit very few similarities with their original-issue, high yield brethren. Their typical violent exit from the investment grade universe tends to lead to long term differences in performance characteristics and, when combined with other structural differences, may create a strategic role for these securities in an institutional investor’s portfolio. In this paper, we argue for a rethinking of how a high yield allocation is structured.
As a starting point, the Exhibit 1 splits components of the high yield universe across two dimensions:
1.) credit quality segments and, 2.) fallen angels (FA) vs. original-issue high yield bonds (OIHY).
The vertical axis represents the excess return for holding a sub-component of high yield against the broad high yield benchmark and the horizontal axis represents the tracking error to the Bloomberg US Corporate High Yield index.
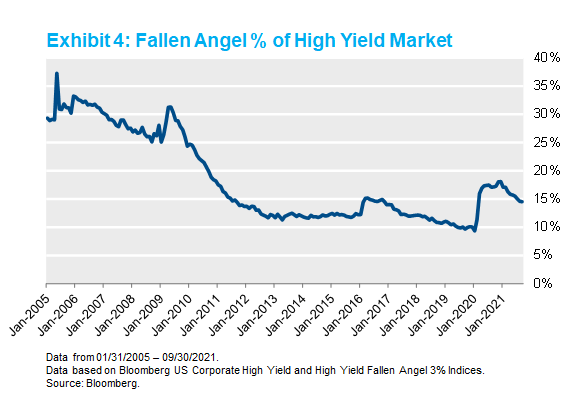
While the credit quality segments had performance between +/-1% of the stated benchmark, the fallen angel benchmark (subject to a 3% issuer cap) had an average annual excess return of 3.3% with a tracking error of 3.5%, resulting in a ~0.93 information ratio. Immediately, this suggests something is different about fallen angel securities. A notable difference is duration. As such, an additional duration-adjusted fallen angel point is included. This adjustment results in modestly lower performance given the decline in interest rates over the time period.[1] Of course, given enough permutations of an index it wouldn’t be uncommon to find that a certain subsection simply outperforms by chance. However, the persistence of the outperformance over 10+ years along with the size of the fallen angel market (~15% of the high yield index[2]) indicates that this segment may have unique attributes.
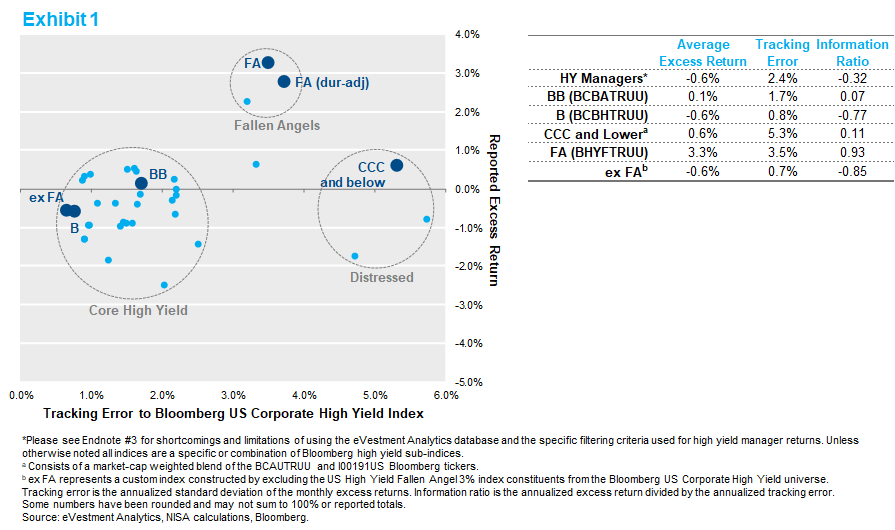
The light blue dots represent active high yield managers reported net-of-fee returns in the eVestment database. Another interesting observation is that the median manager underperformance was -60 bps. When we examined the source of these managers’ excess return, only two had statistically significant positive exposure to fallen angels.[4] This lends credibility to the position that despite this phenomenon being well documented, few managers may have an investment style allowing them to capitalize on the opportunity. Based on optics alone, high yield could be described as having three distinct components: Core High Yield composed mainly of BB/B original issue high yield bonds, Fallen Angel securities, and Distressed consisting of CCC and below securities.
While the structure of fixed income benchmarks along with institutional constraints create the abrupt exit of fallen angels from investment grade portfolios, these securities typically enter the Bloomberg US Corporate High Yield benchmark at high spread levels (depressed prices) and have subsequently outperformed the other high yield securities over the last 10 years. Exhibit 2 compares the relative change in spreads between fallen angel securities and other BB-rated bonds over the specified number of months following the downgrade. While not all fallen angel securities will enter the high yield index with a BB rating, this credit quality is the appropriate comparison for the vast majority of securities.[5]
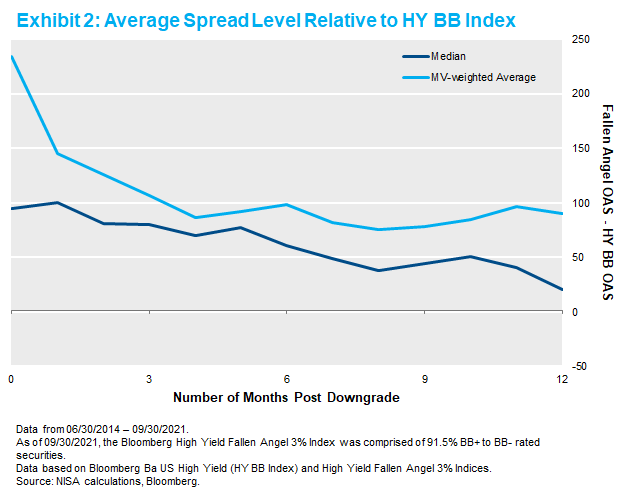
A key observation from this chart is the significant spread tightening that occurs in the first few months following the downgrade. However, the spread tightening has historically continued, albeit at a modestly slower pace, over the remainder of the year following the downgrade event. Even at the end of this period, fallen angel securities average 95bps of higher yield than their original issue BB-rated counterparts. Larger fallen angels have exhibited more tightening (as evidenced by the relative tightening of the MV-weighted time series) and a longer-term dislocation than the median issuer.
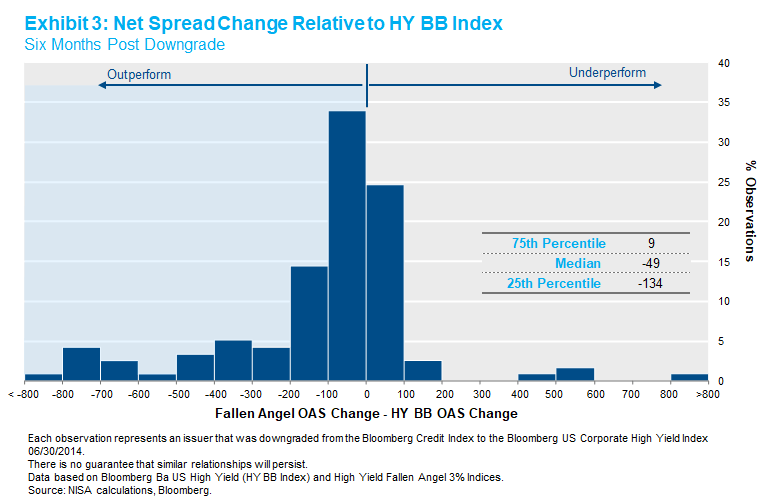
Exhibit 3 below depicts OAS changes in high yield securities six months following the downgrade going back to June 30, 2014. Of course, some fallen angel securities could fall further, but 50% of securities experienced a 50bps-or-more spread tightening in the six months immediately after the downgrade, and only 28% experienced a spread widening at all.
This data supports the conclusion from a previous post regarding how the fixed income market structure creates a dislocation for fallen angels securities. The elevated yield of fallen angels versus similar high yield securities seems to persist indefinitely over OIHY bonds. This is especially surprising considering the high proportion of OIHY bonds with call features versus fallen angel securities. All else equal we would expect these differences to result in lower fallen angel spreads vis-à-vis OIHY bonds.
While our high yield posts have predominantly focused on market segmentation as a driver of fallen angels spread differences, structural differences may play a role as well. The duration, coupons, maturity, and call features differ materially from OIHY bonds. The lack of existence of various features may make these bonds less than perfect fits in a traditional High Yield manager’s portfolio.
LDI note: The longer duration of fallen angel securities coupled with a higher average credit quality allow these securities to have the potential to fit in an LDI-focused strategy better than traditional high yield securities.
We believe fallen angels should be utilized as a key component of a high yield investment strategy. Based on the eVestment analysis discussed above, it appears this market has been used less frequently as an enhancement engine by active high yield managers. While good reasons like manager style may explain the notable absence, we believe approaches exist to incorporate the episodic nature of fallen angels into a high yield investment strategy. Given the positive attributes of fallen angel securities, they seem deserving of another chance in investors’ portfolios.
Appendix
Fallen angels have comprised between ~8%-37% of the high yield market since the index inception.
After controlling each credit subcomponent for duration, fallen angels still exhibit an outsized excess return per unit of tracking error.

[1] See Appendix for chart showing the duration adjusted return of the credit quality sub-indices.
[2] See Appendix for time series of Fallen Angel market cap expressed as a % of the High Yield market.
[3] *HY Manager data referenced throughout this publication data is from eVestment. There are shortcomings to using databases, including limitations on inclusiveness and survivorship bias. Benchmarks identified in the eVestment Analytics database are selected by the product’s investment manager and may not be indicative of the true product benchmark. The analysis is based on data from 10/31/2011 through 09/30/2021 from eVestment Analytics, Bloomberg, and Bloomberg Index Services Ltd. NISA included High Yield Manager product data meeting the following criteria: 1) separate account product 2) benchmarked to High Yield 3) data available between October 2011 and September 2021. Gross-of-fee data was then adjusted by managers stated fee. NISA removed one outlier from the data; that manager had an excess return of -4.6% with a tracking error of 14.9%; this datapoint did not impact the conclusions reflected in the analysis. Neither NISA nor eVestment guarantee or warrant the accuracy, timeliness or completeness of the information provided by eVestment and are not responsible for any errors or omissions with respect to such information.
[4] The fallen angel factor is defined by the excess return on the Bloomberg U.S. High Yield Fallen Angel 3% Index. Regression analysis on historical returns was used to estimate the exposure of each manager to the fallen angel factor. A manager’s exposure to fallen angels was considered statistically significant if the p-value of the fallen angel factor was less than 0.05.
[5] More than 90% of the Bloomberg US High Yield Fallen Angel 3% Index (3% issuer cap) are BB rated securities.