On Dec 21st 2020, Tesla entered the S&P 500 with a market value of around $600 billion, representing ~1.7% of the index. Tesla became one of the five largest stocks by market value in the S&P 500. Newsworthy to be sure, but such transitions between indices due to eligibility are much more disruptive in the bond market. When a corporate issuer is downgraded by rating agencies and forced to leave the investment grade universe, it joins a high yield benchmark.[1] Depending on the amount of debt outstanding, this issuer can represent a significant portion of the high yield market. In March 2020 alone, the high yield market value grew by 5.4% on the downgrade of 12 issuers.
What makes the Tesla story so newsworthy? Why is this much less common in the equity market? Typical shifts from the large to mid to small cap indices are driven by the value of the organization. When a large cap stock declines in value enough to enter the small cap market, while larger than the average security, it isn’t outsized compared to the remaining equities. Tesla had long since satisfied the S&P size criteria, but the lack of four trailing quarters of positive earnings didn’t meet the criteria. In fixed income, the rule-based index criteria determine where a bond resides and how it shifts from one benchmark to another, not market forces.
Several factors can influence whether a bond will be included in a benchmark: issue size, call features, maturity, etc. These features are known in advance and generally do not change over the life of a bond. The same can’t be said for credit rating. A rating agency’s change to the credit rating of a security can effectively move a name from an investment grade to a high yield benchmark in abrupt fashion. Another nuance related to the vast majority of non-financial debt is that the more debt a corporation issues, the more likely they are to subsequently be downgraded into the high yield space given increasing balance sheet leverage. This market structure fuels the dislocation in movement between the investment grade and high yield bond markets. We are not suggesting a better alternative, but are simply pointing out the events that compound the market dislocation on the fall to high yield: the lumpy nature of downgrades, the market environment when downgrades occur, and institutional constraints that lead to an outsized impact on the fall of fallen angels.
Policy Allocation and Governance
Every bond that is issued will ultimately have a buyer, but not necessarily the same buyer. Drawing on comparisons from the equity world where benchmarks are more likely to represent the “full” market (e.g., Russell 3000), in fixed income there are many investors who hold a partial slice of the U.S. corporate bond universe. Said differently, investors’ bond portfolio allocations are different than the market portfolio allocation to corporate bonds. For example, if high yield represents 20% of the U.S. corporate bond market[2], the market neutral portfolio would hold 80% investment grade and 20% high yield securities. A 32% investment grade allocation would indicate an 8% high yield allocation. Ideally, as bonds leave the investment grade universe, policy allocations would drift slightly to allow for a larger high yield allocation.[3]
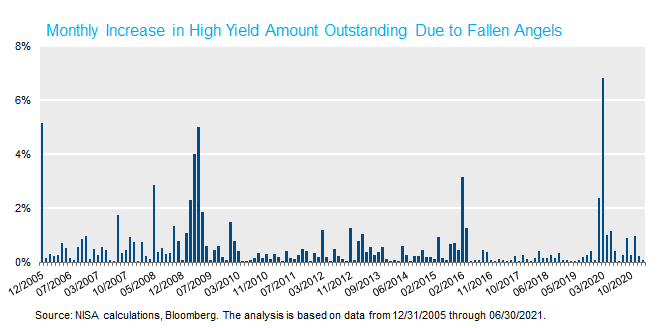
The chart below shows how the weight of high yield has drifted in the U.S. corporate bond market over time, ranging from a low of ~19% to a high of ~28%. Additionally, the right axis represents the percent of market value shifting from high yield to fallen angels in a given month. For example, a 1% shift in market value from investment grade to high yield, assuming high yield is 20% of the market would indicate a 5% growth in high yield policy allocations. Thus, a 10% high yield policy allocation would translate to a 10.5% forward-looking high yield policy allocation. In practice, this is not how policy allocations are set; they tend to move gradually over time, which inherently would cause greater pressure on the spread of a high yield bond.
The U.S. corporate bond market is more unique because of investor segmentation. U.S. corporate defined benefit plans hold substantially more investment grade corporate bonds relative to high yield bonds given their method for valuing liabilities. Alternatively, U.S. public defined benefit plans and endowments are more likely to have larger high yield allocations than the market portfolio may suggest. This is not necessarily cause for concern; after all, every bond has an owner, but it does provide conditions that seem ripe for a dislocation.
Investment Grade Manager Constraints
Downgrades impact more than just pure credit mandates. Any benchmark which contains only investment grade or only high yield securities will be impacted by investment grade downgrades (e.g., U.S. Aggregate, Gov/Credit). How a manager reacts to a downgrade and the impact that it has on client portfolios will be a function of whether the mandate is active or passive.
Passive managers typically respond by selling investment grade securities when they leave the benchmark, usually at the end of the month, not when the actual downgrade occurs. Passive managers’ guidelines and approach can be too restrictive to allow the managers to deviate in a material way from the benchmark methodology.
Active managers often have the flexibility to hold downgraded investment grade securities, but may choose not to for a variety of reasons. In some cases, the length of time a manager can hold the security will be limited, managers may have high yield allocation limits imposed by the guidelines, and depending on the manager style (and other active positions) holding the security may lead to higher tracking error than desired. Moreover, active managers are trying to avoid securities that will eventually be downgraded, which means, in many cases, that these positions may have already been moved from active portfolios.
Cyclical Nature of Downgrades/Liquidity Considerations
While downgrades may occur at any time, the episodic nature of downgrades tend to clump during illiquidity events (Financial Crisis, COVID, Tech Bubble, etc.). These events by their very nature are associated with lack of liquidity in the corporate bond market and at the portfolio level. As mentioned above, investors may not have the ability to modestly shift their portfolio allocations to represent the growing size of the high yield market during these types of environments. This may also occur at a time when cash levels are reduced and a heightened equity selloff may reduce the ability to allocate additional assets to fixed income.
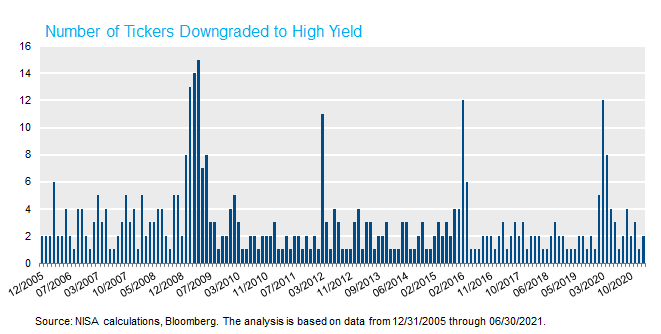
The chart below shows the market value of downgraded bonds by month. Note the general “lumpy” nature of downgrades surrounding the COVID crisis (early-2020), Energy Concerns (early-2016), and the Financial Crisis (late 2008-early 2009). The total increase in high yield market value from February 2020 to June 2020 was over 10%, and represented 32 tickers. In contrast, the four months from September 2019 to January 2020 represented <1% of the high yield market, and totaled four tickers.
These factors lead to a perfect storm for downgraded investment grade securities, or “fallen angels,” and help to explain the dislocations when they fall. This isn’t the end of the story; in our next post on high yield bonds, we examine what happens after these bonds fall and why in many respects they still look much closer to their former investment grade colleagues than their new high yield ones.
[1] This is an oversimplification, not all bonds will join the flagship U.S. High Yield Index. Select bonds (e.g., sovereign bonds or foreign agencies) in the U.S. Credit Index do not enter the High Yield Index upon downgrade.
[2] For simplicity, think of the U.S. corporate bond market as the U.S. Credit + U.S. High Yield Index.
[3] The U.S. Universal Index is an example of a benchmark where migration from investment grade to high yield would be better absorbed by the market. In our experience, this benchmark is seldom used in practice.