Stable value investment options have experienced an evolution. Immediately after the Great Financial Crisis 13 years ago, wrap insurance providers, without exception, reassessed the risk implicit within the contracts they issued. They recalibrated risk budgets, developed stricter investment guidelines and raised fees, leaving stable value managers with something of a “take it or leave it” contract option. As time passed and markets settled, stable value managers sought again to rework wrap contract provisions to improve the relative position of participants and plan sponsors. They had some success in loosening some of the contractual stipulations. Their work ultimately benefited plan participants.
With this ongoing evolution, it is worth revisiting how the structure and design of a stable value program and its investment strategy can be updated to improve participant outcomes. In the following, we examine how benchmark design, manager selection and potentially small allocations of equity can be used to strengthen the stable value offering. By examining strategy decisions, in addition to contractual considerations, sponsors can keep stable value fresh – yet stable.
Benchmark Design/Selection
The single largest driver of stable value experience is the fixed income benchmark. Frequently, such benchmarks reflect the fund’s legacy, rather than an intentional desire for a specific portfolio makeup or sector allocation. The ongoing use of broad-based benchmarks, such as intermediate aggregate or intermediate gov/credit, may be something of a relic from the past, a time when stable value funds were transitioning from traditional guaranteed investment contracts (GICs) to diversified, separately-managed, wrapped bond portfolios. Consider alternatives to relying on the universe of broad market benchmarks with specific maturities and sectors, which have little to do with fund objectives. More custom benchmark blends provide opportunities to evaluate how each particular sector contributes to the overall portfolio in an effort to enhance yield.
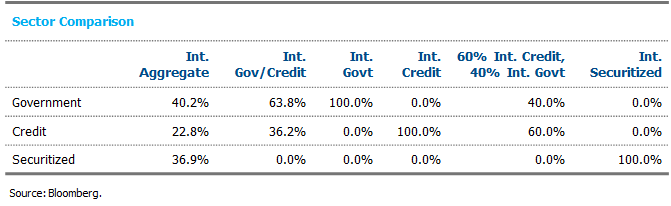
In the following tables, we show the weights of traditional benchmarks’ underlying components: government, credit and securitized. Substantial differences in yield can be observed among the sub-components, and reweighting components based on risk tolerances may enhance the crediting rate.
Intermediate Aggregate and Intermediate Gov/Credit Sector Allocation
As of 03/31/2022
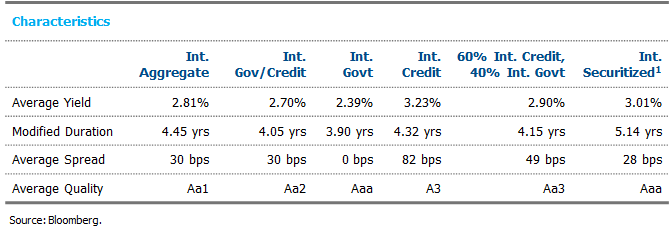
Wrap providers are comfortable with credit and securitized portfolio allocations higher than those seen in broad-based benchmarks. As markets change, sectors should be reviewed for their ongoing utility within a stable value program. As an example, moving from an intermediate gov/credit benchmark to a 60% intermediate credit/40% intermediate government increases the average spread on the portfolio by 19 bps, while likely still maintaining wrap requirements.
Wraps also include portfolio minimum average credit quality measures as part of the contract requirements, and such measures have historically influenced the benchmark decision. More granular benchmarks that target a specific credit quality (e.g., “A or better”) or specify the credit allocation as a fixed weight of the benchmark can allow for an increase in the portfolio yield, while still adhering to the wrap contract requirements. Likewise, using the Treasury portion of the portfolio to meet the overall portfolio duration target can allow for credit allocations that otherwise may not fit in the program; for example, a 5-to-10-year credit allocation paired with 1-to-3-year treasuries can achieve the overall duration requirement while also increasing spread levels and therefore the crediting rate in the portfolio.
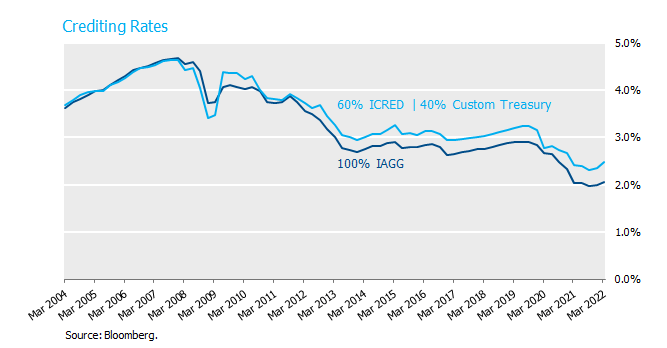
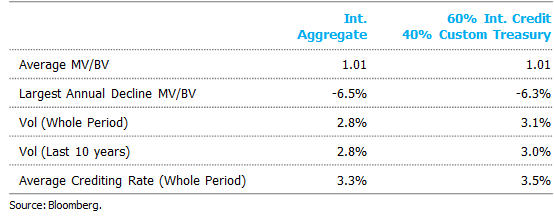
To illustrate, we show below how an intermediate aggregate benchmark would compare to a more custom benchmark of 60% intermediate investment grade credit and 40% custom treasuries.[2] Importantly, given the declining-rate environment over the past 15 years, we controlled for duration differences between the two benchmarks by allowing the Treasury duration to change. This approach will account for duration differences between the intermediate aggregate and the custom portfolio.
Manager Specialization
Additional enhancement can exist by allocating to managers who specialize in particular sectors (e.g., government, credit, securitized), even while maintaining a broad-based benchmark for the overall program. This approach enables managers who specialize to play to their strength and also better separates beta from alpha within manager excess performance.[3] If a program uses, say, the Intermediate Aggregate as a benchmark, this could mean hiring three managers, each of whom specializes in either the government, credit or securitized portion of the benchmark. This approach makes it inherently easier to deviate from the market value weights of broad-based benchmarks by adjusting the allocations to each manager in the program.
As an aside, having unique benchmarks across managers could introduce reporting complexity. Such an issue can, however, be readily handled by the stable value program manager. The program manager also can structure the wrap contracts to better allow for manager specialization. This likely means having each contract provider wrap a portion of the total program as opposed to just an individual manager.
Equity in Stable Value
At first pass, including equity in a stable value portfolio seems to run counter to the idea of stable value. This would certainly be true if equity allocations are large. In small doses, however, equity can improve both the return and risk profile of a stable value program by way of diversification versus traditional fixed income allocations. Historically, this would have benefitted participants through higher crediting rates and lower portfolio volatility, and wrap providers through modestly lower portfolio volatility. In practice, this means an allocation of less than 10%, which keeps stable value consistent with its original intent.
From a wrap fee perspective, smaller equity allocations (e.g., less than 5%) are unlikely to result in changes to wrap fees, whereas higher levels (e.g., approaching 15%) would likely result in a fee increase.
An equity allocation will require an adjustment to crediting rates and amortization formulas. For fixed income, the inputs are obvious and reflect the yield and the duration of the portfolio. For equities, wrap providers are comfortable using dividend yield or a Treasury rate plus expected return as the yield for calculating a crediting rate. With respect to the amortization period, more diverse approaches are seen, including setting the duration equal to the fixed income portfolio, stipulating a fixed duration, or varying duration based on the market-to-book value ratio of the fund.[4] Because wrap providers have differing views on how equity impacts the crediting rate mechanism, this is something that the program manager would evaluate as part of the wrap selection process.
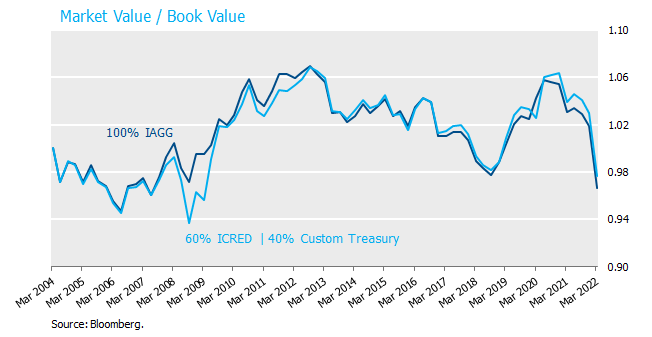
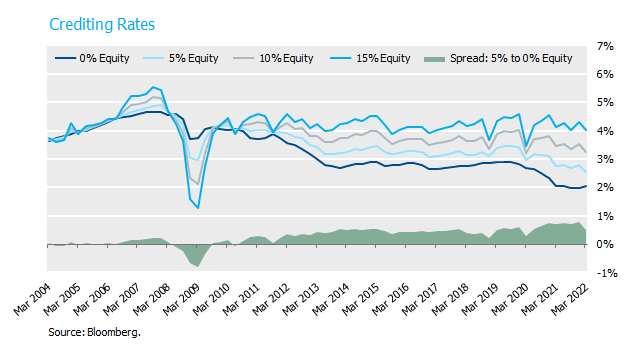
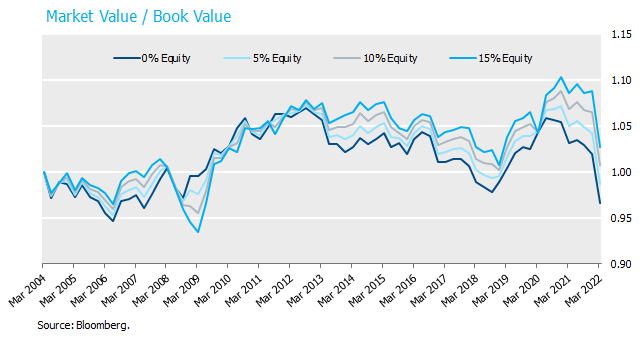
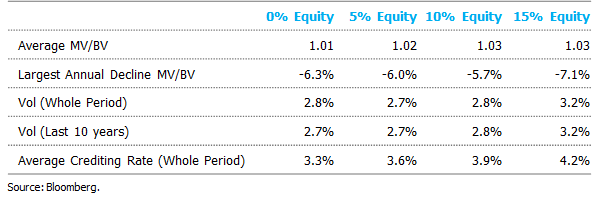
The chart below illustrates how equity allocations invested in the S&P 500 (SPTR Index) impact both the crediting rate and market-to-book ratio through time. For purposes of this analysis, fixed income assets are invested in the intermediate aggregate. Over the illustrative period, modest equity allocations provided a higher crediting rate while maintaining relatively stable market-to-book values.
The 5% equity allocation results in a smaller drawdown (Largest Annual Decline MV/BV) than a portfolio without an equity allocation and has the lowest portfolio volatility since 2004.
Conclusion
With the right implementation, adjusting the stable value investment strategy can provide participants with higher crediting rates while still fitting within wrap providers’ risk constraints. This is expected to result in better outcomes for participants by improving returns and reducing volatility. Much has changed since many programs were designed. Changing market conditions together with an evolving wrap market mean there are opportunities to reevaluate prior design decisions. As steady, predictable growth for participants is an objective of stable value, programs should strive to evolve over time to continue to meet their goals.
[1] Intermediate Securitized represents 99.9% of the securitized benchmark.
[2] For the purposes of this analysis, the yield of the custom portfolio was measured as the Treasury yield of the Intermediate Aggregate index plus 60% of the Intermediate Credit index spread. A 60% Intermediate Credit index weight was chosen as it was the greatest allocation to credit that allowed for a long only Treasury allocation.
[3] See previous NISA Perspectives Posts “There’s Beta in My Alpha!” and “There’s Beta in My Alpha! (Part 2)” from May 20, 2016 and June 8, 2016, respectively.
[4] For this analysis, the equity allocation was assumed to have the duration of the Intermediate Aggregate index. For the yield input from equity, we bound the yield to a range of 2.5% and 6.5%, and interpolated based on the prior quarter’s MV/BV ratio.