

When envisioning any new strategy, it is human nature to skim over the details. Previous posts in this series outlined the strategic rationale and practical applications of a different way to think about and approach asset allocation. As sometimes happens, it is easy for the “what” and “why” of a new strategy to take center stage, while the operational details of the “how” can fall by the wayside.
Yet these details—where the rubber meets the road—are critical to the success of any strategy. In this series, “how” pertains to the selection of the appropriate asset class to overlay and the specific derivative instruments to employ. In strategies where the alpha generated in a physical allocation is modest, these considerations have the potential to materially impact returns. To cap this series, let’s explore the details of the “how” and, in doing so, demonstrate its importance.
Selecting the Overlay Beta
The first step in a beta overlay strategy is to decide which asset class to overlay. To illustrate, consider a cash securitization strategy where an asset owner maintains a balance of cash for liquidity needs but has a 0% policy allocation to cash. Assume a policy asset allocation of 50% Large Cap Domestic Equity, 25% International Equity, and 25% US Aggregate. The asset owner must decide from where to source the cash and how to subsequently replace the exposure with an overlay. The asset owner considers four overlay replication strategies: Large Cap Domestic Equity, International Equity, US Aggregate, and a pro-rata blend of the existing policy allocation.
Exhibit I, below, shows the estimated costs of these strategies.
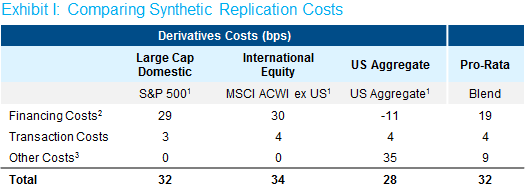
Source: Bloomberg and NISA calculations as of 9/30/18.
If the analysis stopped here, the conclusion would be to source cash from the US Aggregate allocation and replace that exposure with an Aggregate replication strategy. Note, while a pro-rata blend may seem easier from an implementation perspective, it is more costly than simply picking the single lowest cost asset class. Two additional considerations, however, should be taken into account.
First, it’s necessary to understand the tracking error of each replication strategy vis-à-vis its asset class. In our experience with the asset classes outlined here, tracking error is fairly minimal. Furthermore, given that tracking error can be either positive or negative, it’s usually less of a concern for asset owners. Cost, on the other hand, is always negative, meaning most decision-makers ascribe a higher significance to transaction costs. We have generally seen asset owners willing to accept 3 to 4 units of tracking error per unit of cost.
Second, it’s also necessary to understand the opportunity costs associated with physical assets, including manager alpha and securities lending revenue. These costs are often overlooked. Exhibit II, below, presents illustrative opportunity costs associated with the physical asset allocations. This illustration reflects passive large cap domestic equity, active international equity and active fixed income. Securities lending revenues are assumed to be constant but can vary based on assets lent and market conditions.
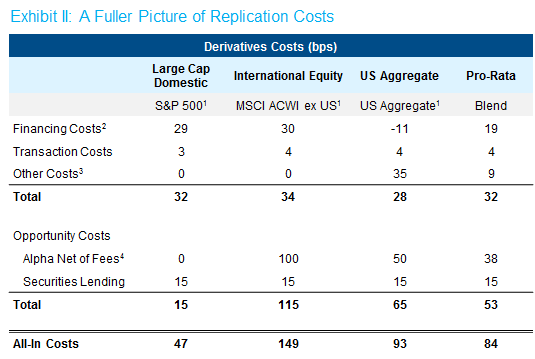
Source: Bloomberg and NISA calculations as of 9/30/18.
All in, selecting the wrong asset class could impact the total program by around 100bps! To be sure, these estimates change over time and are dependent on a specific asset owner’s portfolio. That is, a seemingly similar question can produce different results depending on the asset owner’s particular situation.
Selecting the Overlay Instrument
Once the asset class is selected it may seem like the work is done. However, one last consideration must be addressed. For many asset classes there is more than one way to implement the synthetic exposure. Even for something as straightforward as the S&P 500, multiple replication methods exist, for example, both (or either) futures and total return swaps could be utilized. While the financing costs of these two instruments are highly correlated, meaningful differences can arise that have a real dollar impact on the program.
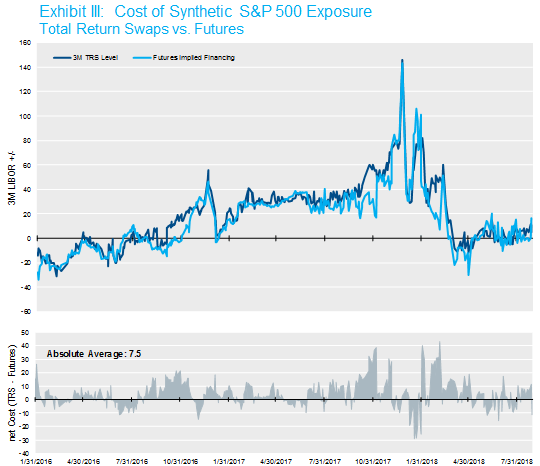
Source: Bloomberg and NISA calculations as of 9/30/18.
The chart in Exhibit III illustrates that at times a sizeable wedge can develop between the implied financing costs of S&P 500 futures and those of total return swaps. Over time, the gross financing wedge between these two instruments has averaged 7.5 bps, with deviations as large as 30 bps. Exploiting savings associated with these swings can be significant. Moreover, while we are illustrating Large Cap domestic equity due to data availability, in NISA’s experience, the potential wedge can be even larger in international and fixed income markets.
We picked a fairly straightforward example, above, to make various points. Undoubtedly, most asset owners will have additional complexities to address. Some other cost/return considerations include:
- Inclusion of CDX or TBA positions as part of a US Aggregate replication;
- Gross dividend versus net dividend index considerations in international equity replication;
- Using a single index (e.g., MSCI World) versus building a replication from component parts (e.g., MSCI US, MSCI EAFE, Canada, etc.);
- Cost and tracking error considerations associated with smaller index components (e.g., Canada); and
- Need for hedged or unhedged currency exposure with respect to international equity.
Of course, the decision between futures and swaps should not be made on cost alone, as other factors come into play. For example, flexibility of terms with OTC instruments can allow asset owners to lock in financing costs for longer periods of time, potentially reducing the all in costs of maintaining an overlay program. Additionally, collateral requirements, counterparty risk, custodial fees, and similar considerations should be evaluated.
Finally, it is worth pointing out that it takes more than a snap-of-the-finger to have derivative documents in place to transact over-the-counter instruments. That said, a material part of the cost savings above is unlocked by having a robust counterparty pool. NISA believes (somewhat strongly) that allowing your overlay manager the flexibility to choose among counterparties and move between instruments is key to managing the costs associated with any strategy.
We hope you enjoyed this three post series5 and have found some useful insights when thinking about the “what,” “why,” and “how” with respect to overlay strategies. We truly believe that the combination of efficient implementation and yield-enhancing underlays has the potential to improve the risk-return profile of a portfolio.
P&I Multi-Asset Investing Conference
NISA and other investment managers will be presenting at P&I’s Multi-Asset Investing Conference in Chicago (11/13) and New York (11/15). We will be exploring this topic along with some general ideas on how derivatives and other assets can be beneficial to your portfolio from a strategic asset allocation perspective. We hope to see you there! For more information, please visit the registration link here.
1Replication used via futures instruments for each index as described: Large Cap Domestic – S&P 500 Futures, International Equity – MSCI EAFE, MSCI EM, S&P TSX 60 Futures, US Aggregate – US Treasury Futures.
2Financing Costs are estimated as a spread over the prevailing Fed Funds rate.
3Includes risk premium and implied repo costs.
4Reported alpha net of fees are assumed.
5The first two posts in this series are Part 1: NISA Perspectives Breaking Down Your Beta and Part 2: NISA Perspectives Rebuilding Beta.
