

- It was a surprise to no one when the Federal Reserve hiked rates this past Wednesday.
- The purpose of this note is to describe the “small technical adjustment” the Fed announced it would make to its operating framework for managing overnight interest rates.
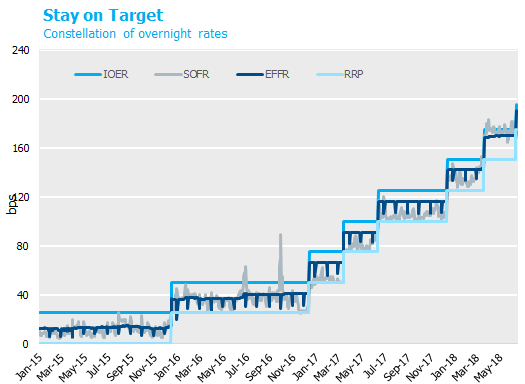
- Since the financial crisis, the Fed has set the policy rate as a 25 bp range – with the aim of keeping effective fed funds (the actual rate paid by participating banks) near the midpoint of the range.
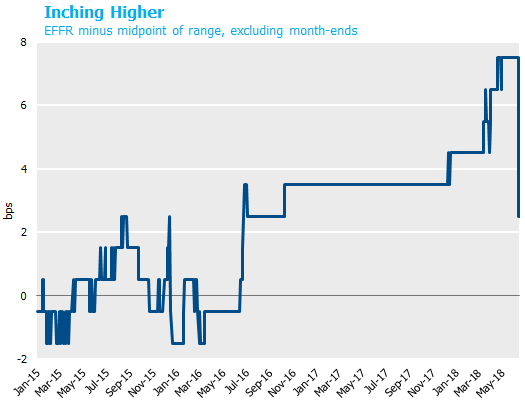
Over the past two years, the effective fed funds rate has drifted uncomfortably close to the top of the range. - In response, the Fed reduced the interest on excess reserves rate (IOER) by 5 bps relative to the top of the fed funds target range, with the goal of pushing the effective fed funds rate back down towards the middle of the range. In effect, the Fed executed a de facto 20 bp hike this week rather than the usual 25.
- A 5 bp reduction in the fed funds rate (relative to expectations) has very little practical effect on financial conditions or the real economy, because the fed funds market itself is not an important source of funding in money markets.
- The Fed expects to reach a normalized level of their balance sheet sometime between 2019 and 2022, though many questions remain about the Fed’s operating framework and the appropriate level of reserves in the banking system. The drift higher in the effective fed funds rate relative to the range could be an early indication that balance sheet normalization will arrive earlier than many anticipate.
Since the first rate hike in December 2015, the Fed has operated a floor framework targeting fed funds within a 25 bp range. The top and bottom of the range have coincided with the interest on excess reserves rate (IOER) and the reverse repurchase program rate (RRP), respectively. The effective fed funds rate (EFFR) traded right near the midpoint after the first rate hike in December 2015, but has crept about 8 bps higher, to within 5 bps from the top of the range. Thus as the Fed implemented the first six 25 bp rate hikes, the effective fed funds rate increased by 158 bps: 150 bps of actual hikes plus 8 bps of fed funds increasing within the range. The increase of EFFR within the target range was equivalent to an extra third of a hike, and introduced the risk that EFFR would print outside the range, which would be viewed by the Fed’s open market desk as a failure. The Fed reversed 5 of those 8 bps on June 13, by effectively hiking the EFFR by 20 bps rather than the usual 25. This was accomplished by hiking RRP and the target range for fed funds by 25 bps, but only hiking IOER by 20 bps. Because the EFFR spread to IOER remained constant, EFFR also only increased by 20 bps, from 1.70% to 1.90% as of today. EFFR was thus successfully pushed back down towards the middle of the range.
 Source: Bloomberg, Federal Reserve.
 Source: Bloomberg.
A 5 bp move has only limited impact in the context of a tightening cycle that has now delivered seven hikes. It is also important to remember that the fed funds market itself does not have the economic significance it once did. With banks awash in reserves since the implementation of quantitative easing, there is little reason for a bank to fund an asset by borrowing in fed funds. As a result, fed funds volume has withered to $80 billion, about one third of pre-crisis levels, with much of the borrowing now done by foreign and small regional banks. The repo market, where $800 billion trades on a daily basis, is a far more important source of bank funding and therefore of greater consequence in determining the financial conditions that influence economic activity. Accordingly, the Secured Overnight Funding Rate (SOFR), which is a robust measure of repo rates, has been designated as the replacement for LIBOR. As shown in the chart above, while SOFR has exhibited greater volatility than EFFR, both have generally tracked the target range higher throughout the tightening cycle.
The Fed began shrinking their balance sheet late last year, and expects to continue doing so until they reach a normalized level sometime between 2019 and 2022, subject to significant uncertainty regarding the Fed’s operating framework, the level of reserves demanded by the banking system, and the bank regulatory environment. As the Fed continues reducing reserves from today’s level of $2 trillion, they will be watching closely for signs that tightness in money markets are pushing rates higher. The drift higher in the fed funds rate could be an early indication that this point will be reached sooner than expected, and highlights the complexity of designing an implementation framework that can effectively control interest rates. The Fed will need to start communicating their plans for the operating framework and balance sheet in the next few quarters.
