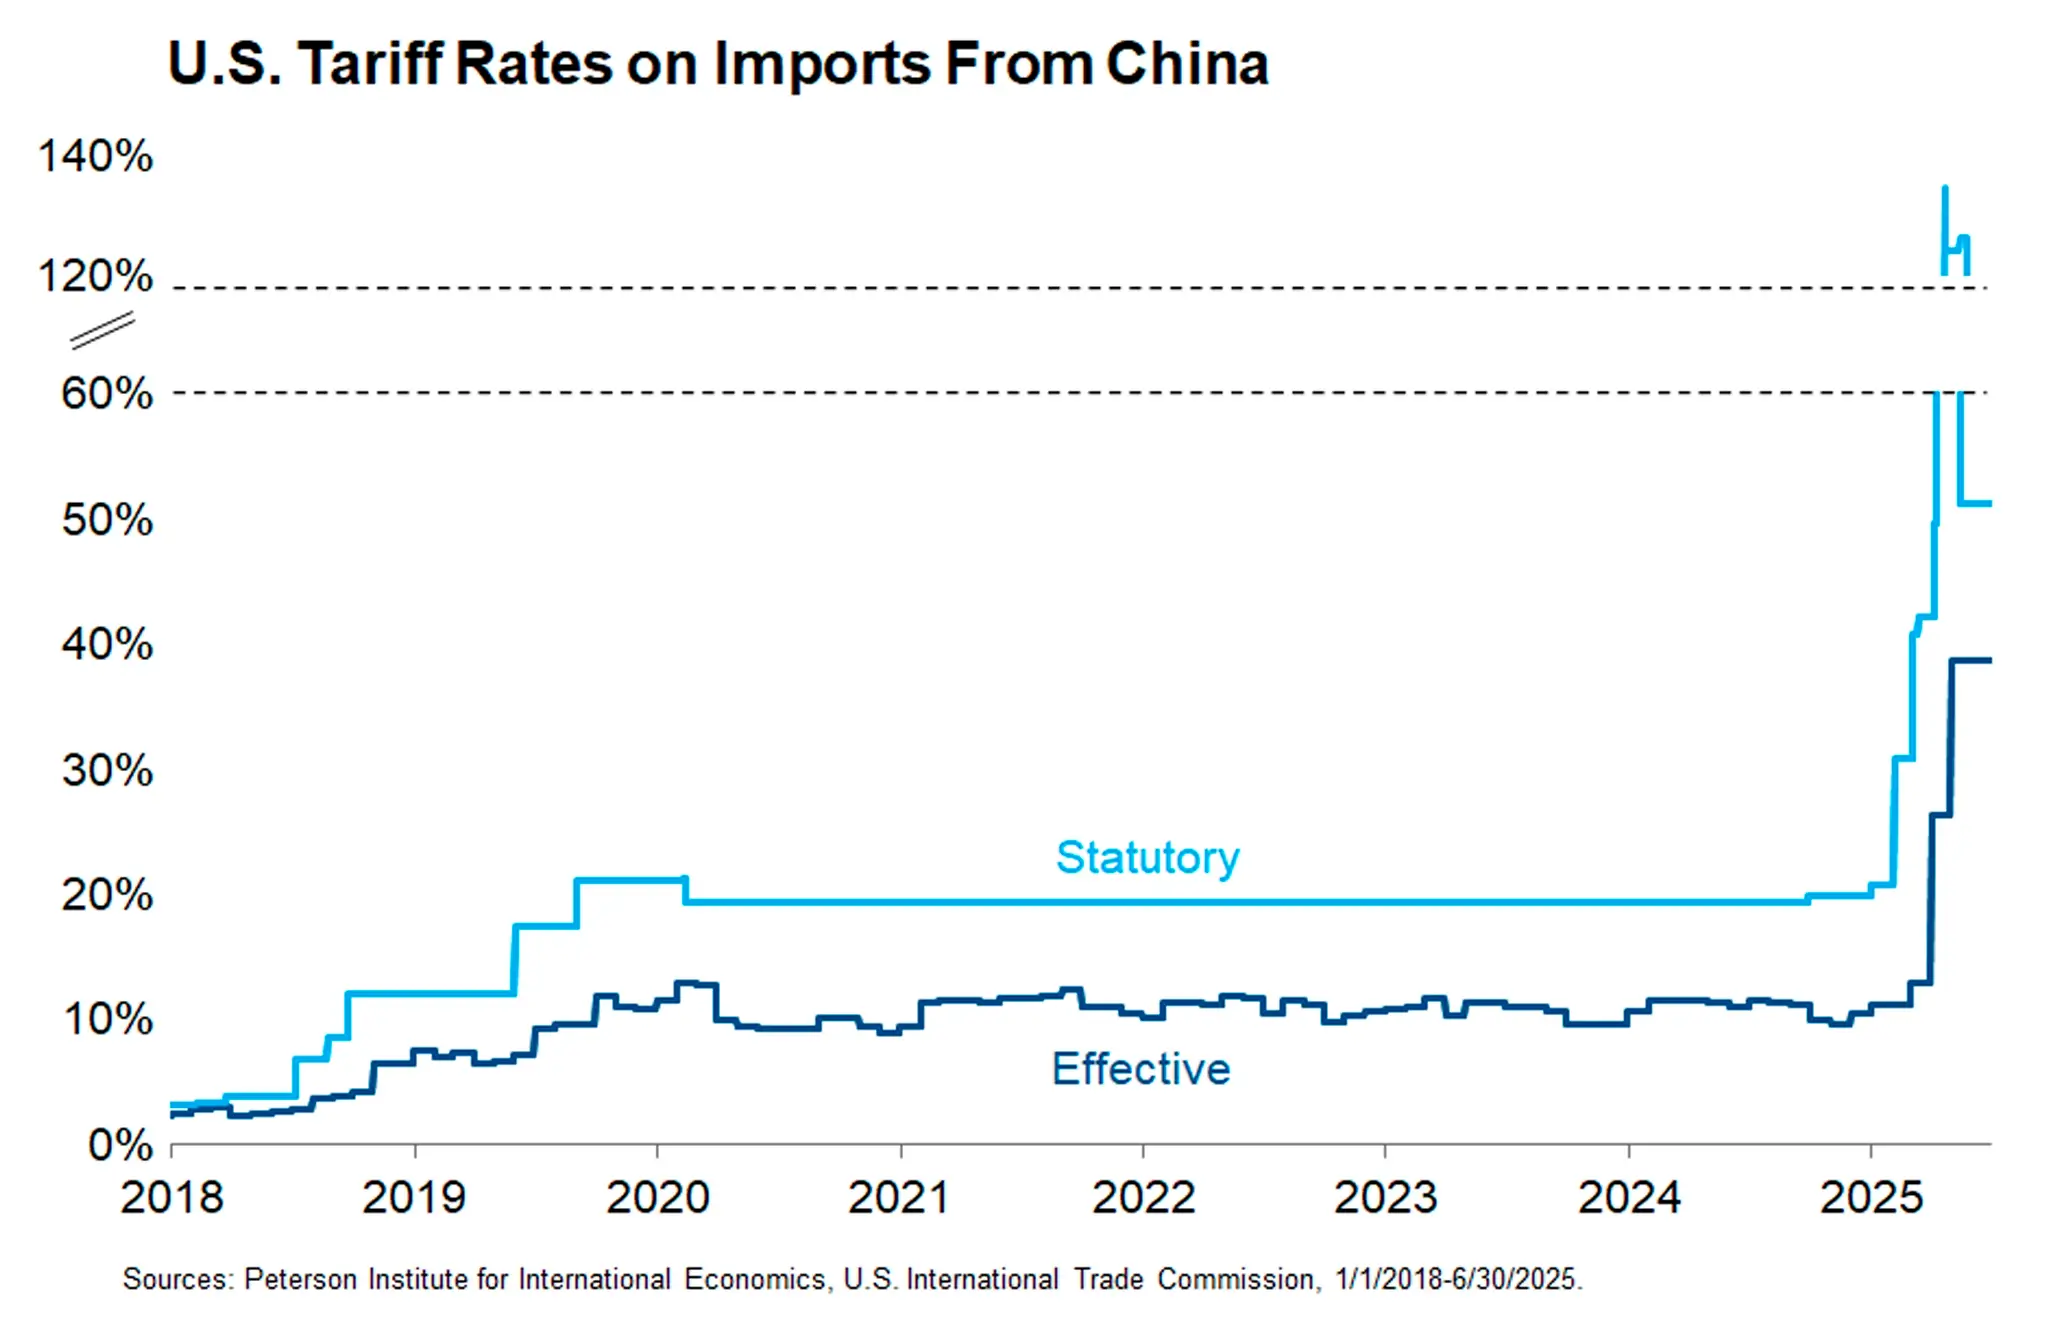
Our prior note on decoupling from China prompted several reader questions about tariff calculations. We stated that the effective tariff on imports from China generally runs well below the statutory rate. The chart below shows those two measures back to 2018 and President Trump’s first trade war. The statutory rate is simply the rate that President Trump announced (and President Biden generally maintained) as the headline rate on Chinese imports. The effective rate is the sum of customs revenue collected on imports from China divided by the total value of imports from China.
The main reason effective rates fall below statutory rates is that many products are exempted. For example, if a container ship from China arrives at the port of Los Angeles carrying $10 million worth of goods and a 30% statutory tariff were applied evenly across all of the goods, the shipment would raise $3 million in tariffs and the effective rate would equal the statutory rate. However, if half of the cargo value is iPhones, the shipment would raise only $1.5 million in revenue because the iPhones are exempted from the tariff. In that case, the effective tariff rate is 15%. As you can see in the chart, the effective rate has been below the statutory rate from 2018 right through to 2025.
Tariff rate calculations get much more complicated than this simple example. In particular, President Trump has imposed different statutory rates for different products (30% universal on China, 50% on metals, 25% on autos, etc.). In this case, the statutory rate for China is the weighted average based on the current composition of imports. And that’s just the starting point; exemptions generally increase over time, and the composition of imports inevitably changes in response to tariffs. In the fog of a trade war, even the tariffs themselves are hard to see clearly.