Since the 2010s, much has changed with respect to U.S. single-employer defined benefit (DB) plans: plan sponsors are at the highest funding levels seen in decades; a focus on funded status volatility and risk reduction has taken center stage; and changes in regulation allow sponsors greater funding flexibility. Given these changes, it is worth reassessing the value of the pension to an organization. Importantly, we will focus purely on economic value, not the funding flexibility value that a DB plan has over a defined contribution (DC) plan or any intangible benefits related to employee satisfaction. 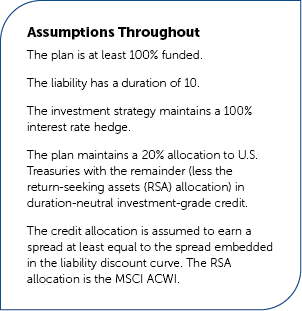
We are effectively asking whether plan sponsors can maintain reasonably low levels of funded status volatility and still out-earn their liability discount rate. Excess returns above the liability could be used to pay future retiree benefits or offer additional benefit enhancements to current participants. As of the end of 2024, 45 of the 100 largest plans[1] are over 100% funded, with an average surplus of over 15%. The surplus can be used to earn even greater returns and in a way that can be perpetual.
The objective is to use a market-based approach to determine the value of a pension that can provide a perpetual earnings stream. The goal is for plan sponsors to view pensions in the way that beneficiaries already see them: as assets.
Using a Market-based Model
Our preference is to use financial markets to answer questions on asset valuation. The same logic and approach will be useful here when assessing the value of the pension.
Conceptually, a pension is a pool of capital used to pay promised benefits to current and future retirees. Any excess earnings over and above the liability accumulate into the pension trust and can be used for additional benefits now or in the future. Life insurance companies have a similar business model — effectively taking on obligations to make annuity payments held in reserves on the balance sheet. They hold additional capital against those reserves, which can be conceptualized as pension surplus. Earnings from reserves and capital can then be paid to shareholders at some point in the future.[2] In an analogous way, while a pension doesn’t have shareholders, both the corporation and the pension beneficiaries benefit when receiving additional pension benefits.
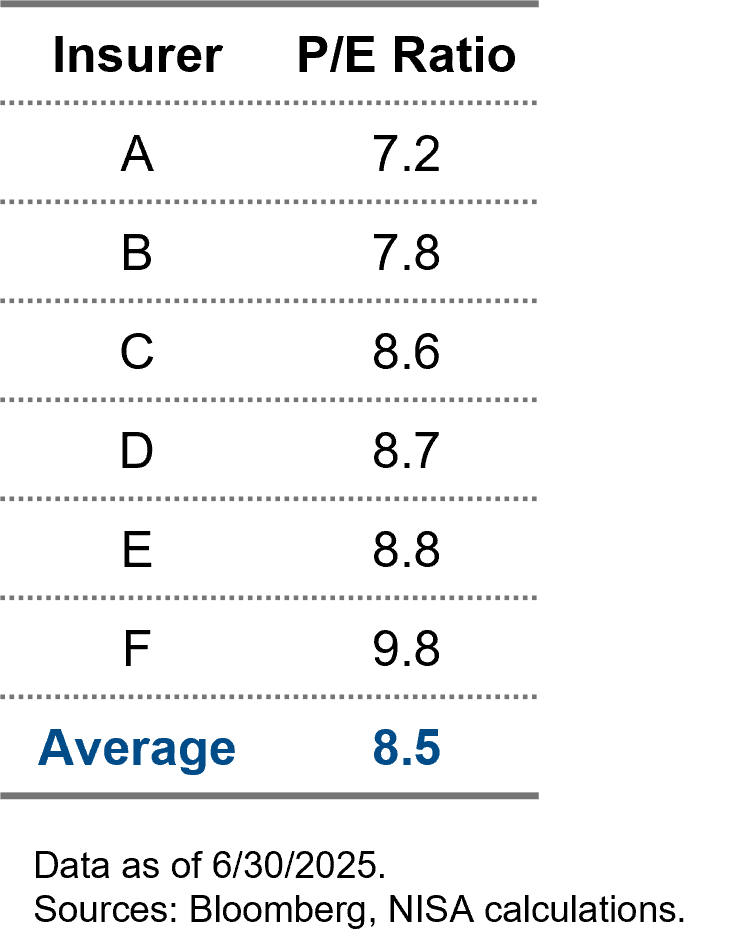
Figure 1 illustrates a range of price-to-earnings (P/E) ratios of various life insurers or reinsurers. Importantly, these companies have other business lines besides life insurance that will influence the P/E ratio the market assigns to their overall business. However, given the conceptual similarities between a life insurer and a pension, we believe it is reasonable to draw a parallel between the two.
Figure 1: Insurer P/E Ratios
Ultimately, if we can establish an earnings stream with similar risk to that of a life insurance company, we can apply a similar multiplier to establish the value of the pension. Keep in mind, we are interested in the similarities of market risk and, by extension, asset allocation. Both a life insurer and, to a lesser extent, a pension have assets which are not reflected at market value, but at book value or some other less market-driven approximation. Either way, that doesn’t mean the market risk isn’t present.
Generating Excess Return in a Risk-controlled Way
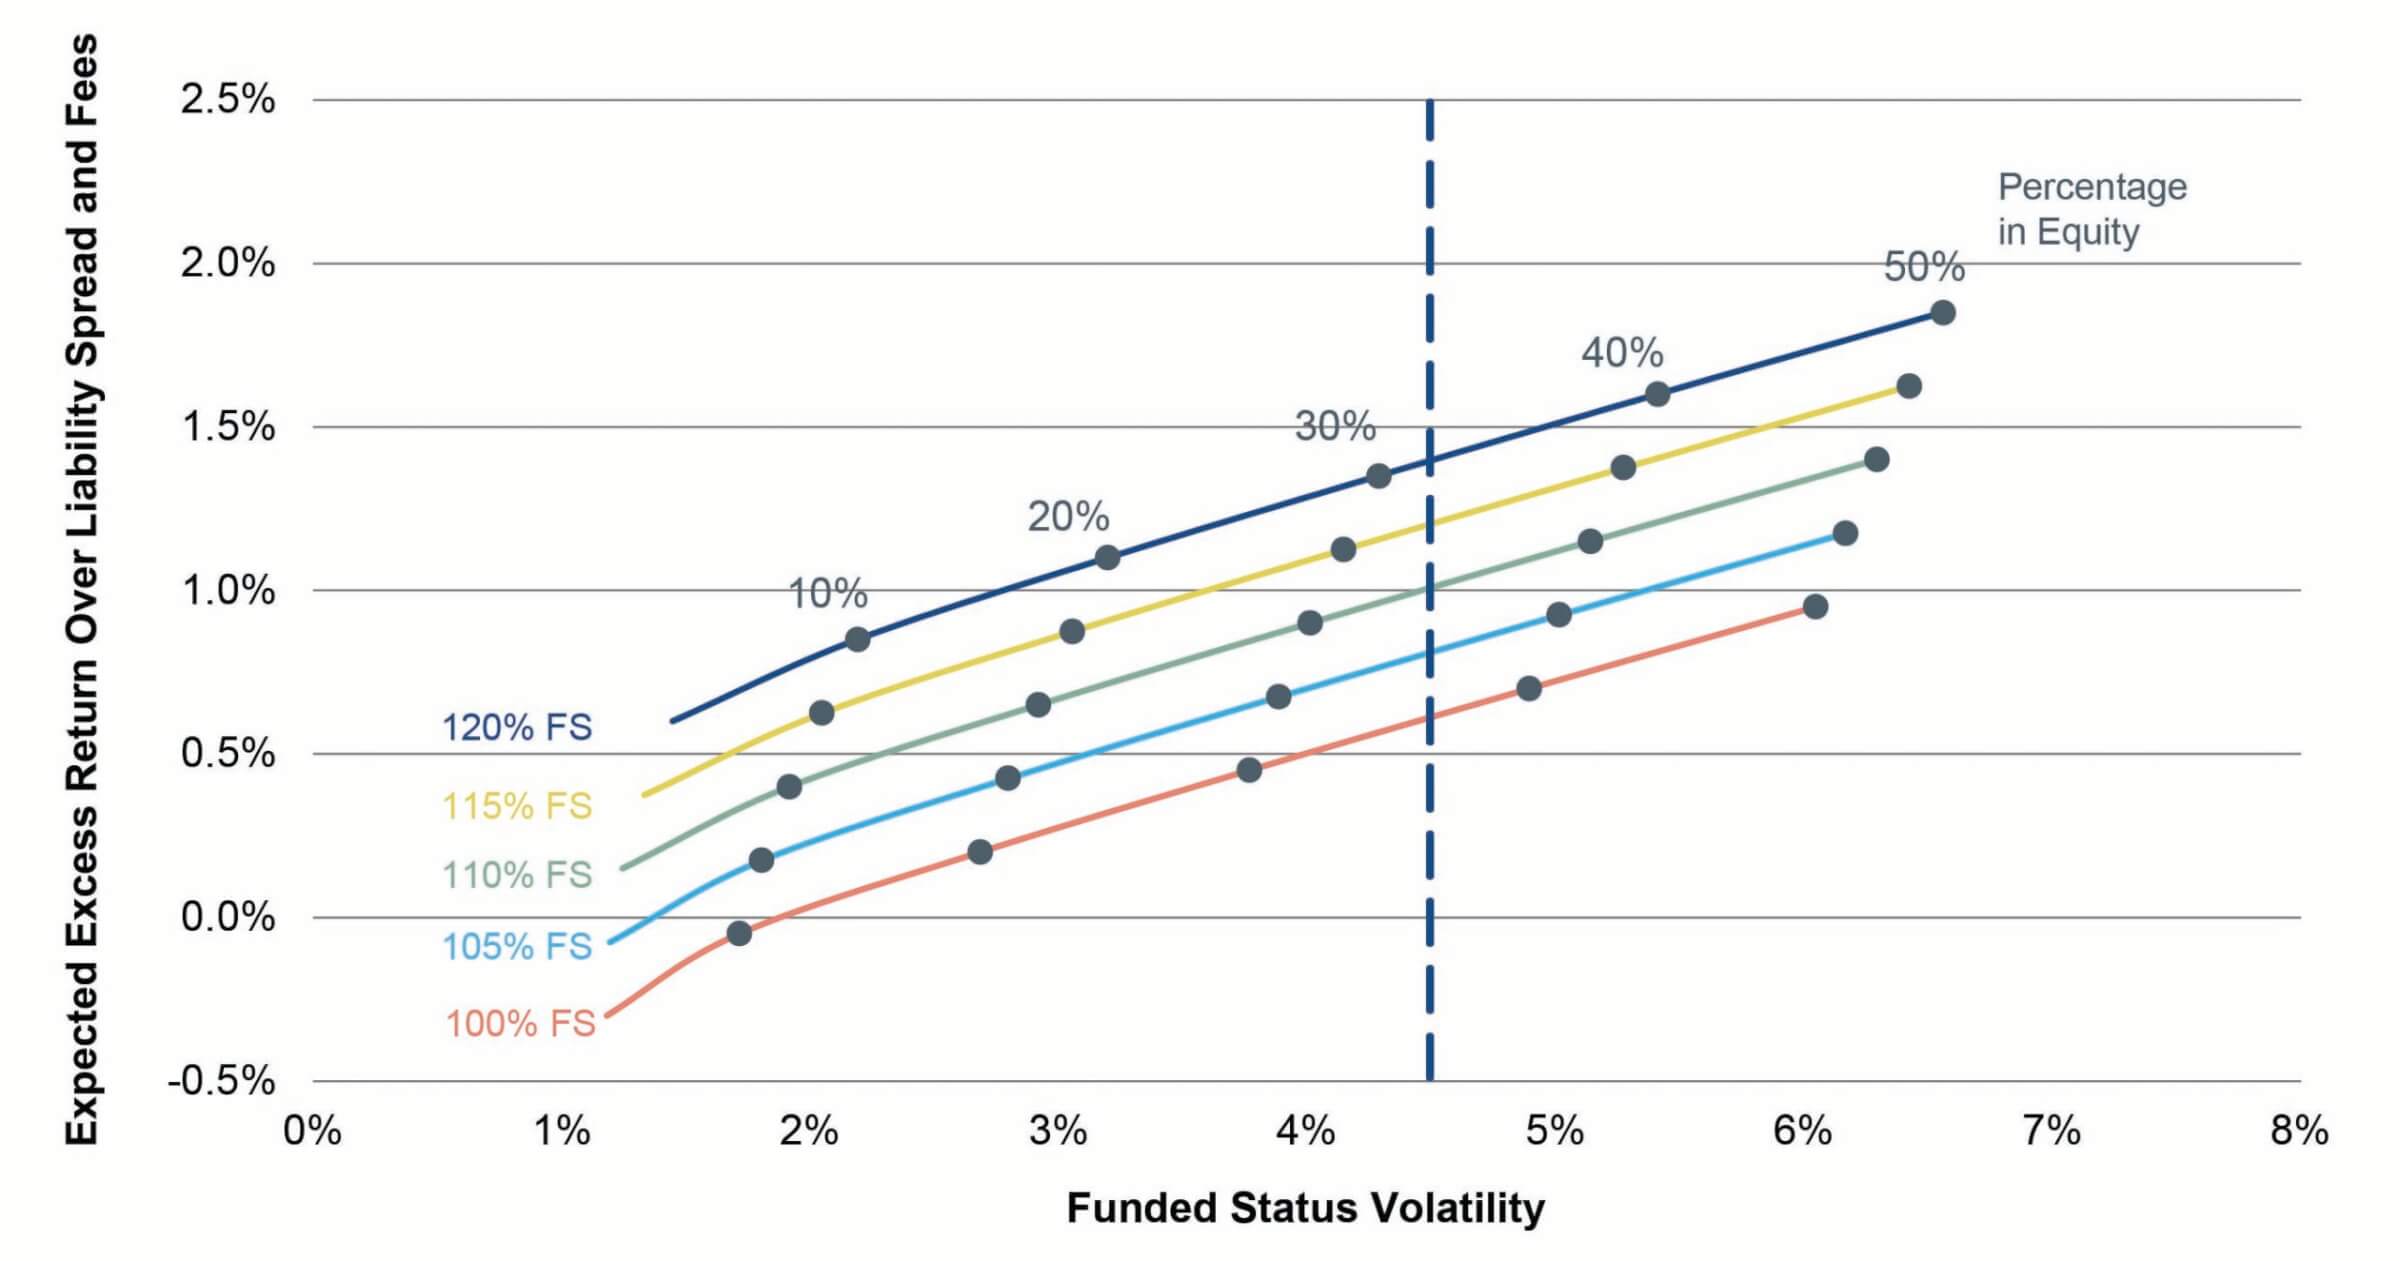
We start by splitting the pension into two components: a 100% funded liability and a surplus. Initially, we focus on the funded liability. The decision of what constitutes a risk-controlled asset allocation rests with the plan sponsor, but we believe a funded status volatility of less than 4.5% can be applied without undermining the valuation comparisons to a life insurer.
Because we recognize that investors will have varying RSA risk premium assumptions, we illustrate a range of 2.5-4.5% over Treasuries in Figure 2. Of course, the effective hurdle rate on the pension should account for the high-quality corporate spread embedded in the liability discount curve and additional costs and expenses such as fixed-rate PBGC premiums and plan administration. We assume a spread of 100 bps over Treasuries for the liability discount rate and an additional 10-bp hurdle rate for costs associated with the plan. Once those adjustments are made, the resulting excess return for a 100% funded pension, for various RSA allocations, is depicted in Figure 2 below.
Figure 2: Excess Return Over Liability for a 100% Funded Pension
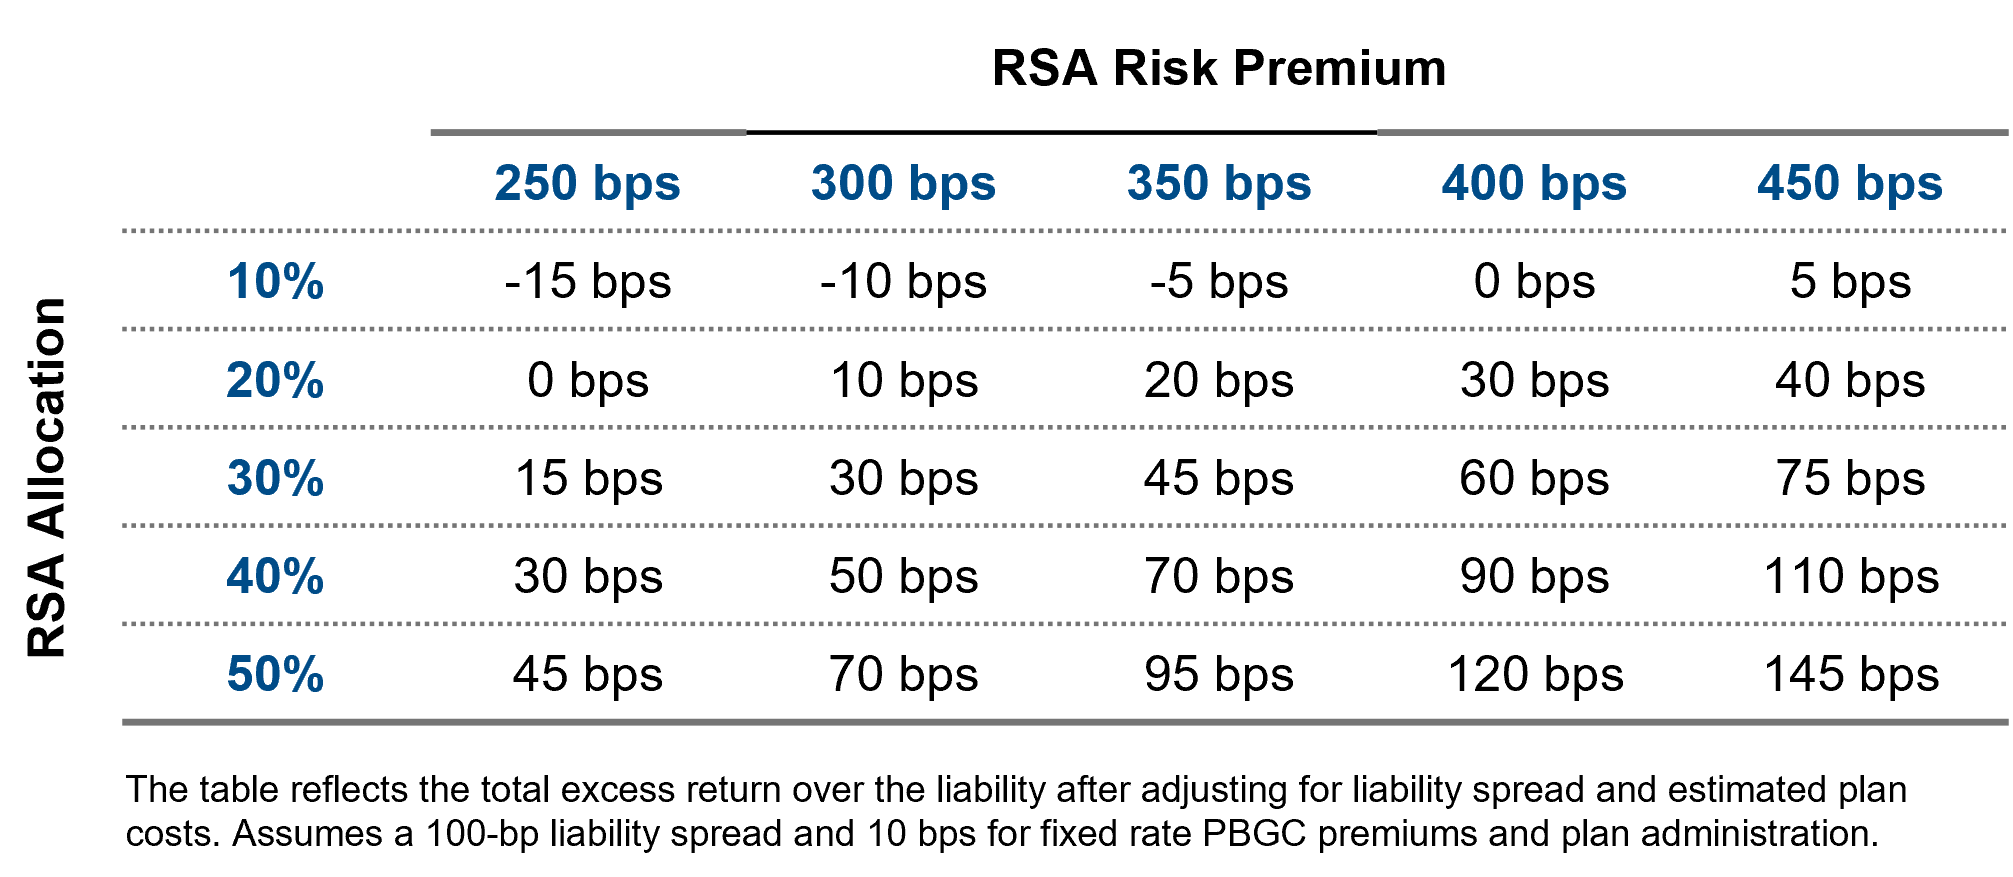
Using our risk and excess return measure, we can construct plausible asset allocations to generate excess returns with limited funded status volatility (i.e., less than 4.5%). That funded status volatility would typically be breached between 30-40% RSA assets depending on market conditions.
Of course, the plan sponsor has other levers to increase return. While we have assumed the Investment-grade (IG) credit merely maintains the high-quality credit spread net of downgrades and defaults, increasing the expected return numbers above may be warranted to account for manager alpha. This decision is especially important at lower levels of RSAs where the fixed income return and composition have greater importance.
Adding in the Surplus
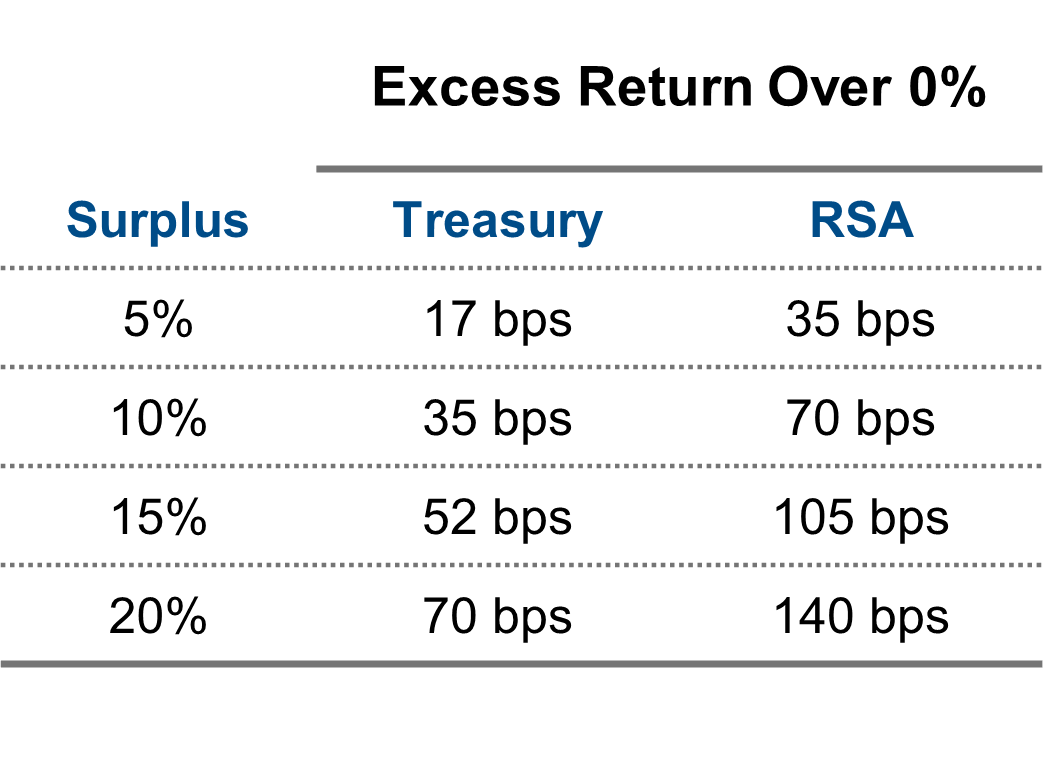
The benefits of a pension plan become even more significant when there is a surplus, which, in our life insurance analogy, could be thought of as the capital above and beyond the expected payouts to the insured. While the assets “dedicated” to managing the liability have a hurdle rate of an AA-discount rate, the surplus has a hurdle rate of zero. Even if the surplus was solely invested in U.S. Treasuries, additional earnings could be used to pay future and current retiree service/benefits. We approach the value of the surplus by considering two asset allocations at different ends of the continuum. A plan sponsor could invest 100% of the surplus in U.S. Treasury securities or in a 100% RSA portfolio. The Treasury rate is assumed to be 350 bps with an RSA risk premium of 350 bps. Figure 3 shows the expected return for various surplus levels denominated on the liability. A 5% surplus indicates a plan sponsor is 105% funded.
Figure 3: Projected Return on Surplus
Putting Together the 100% Funded Liability and Surplus Components
In total, a plan sponsor can consider excess earnings on their funded liability and all earnings on surplus when calculating the total benefit available to pensioners on a yearly basis. Using a 3.5% equity risk premium assumption, we can calculate the total all-in excess return at various surplus levels as depicted in Figure 4.
Figure 4: Projected Total Excess Return by Surplus Level
Assigning a Market Value to Your Pension
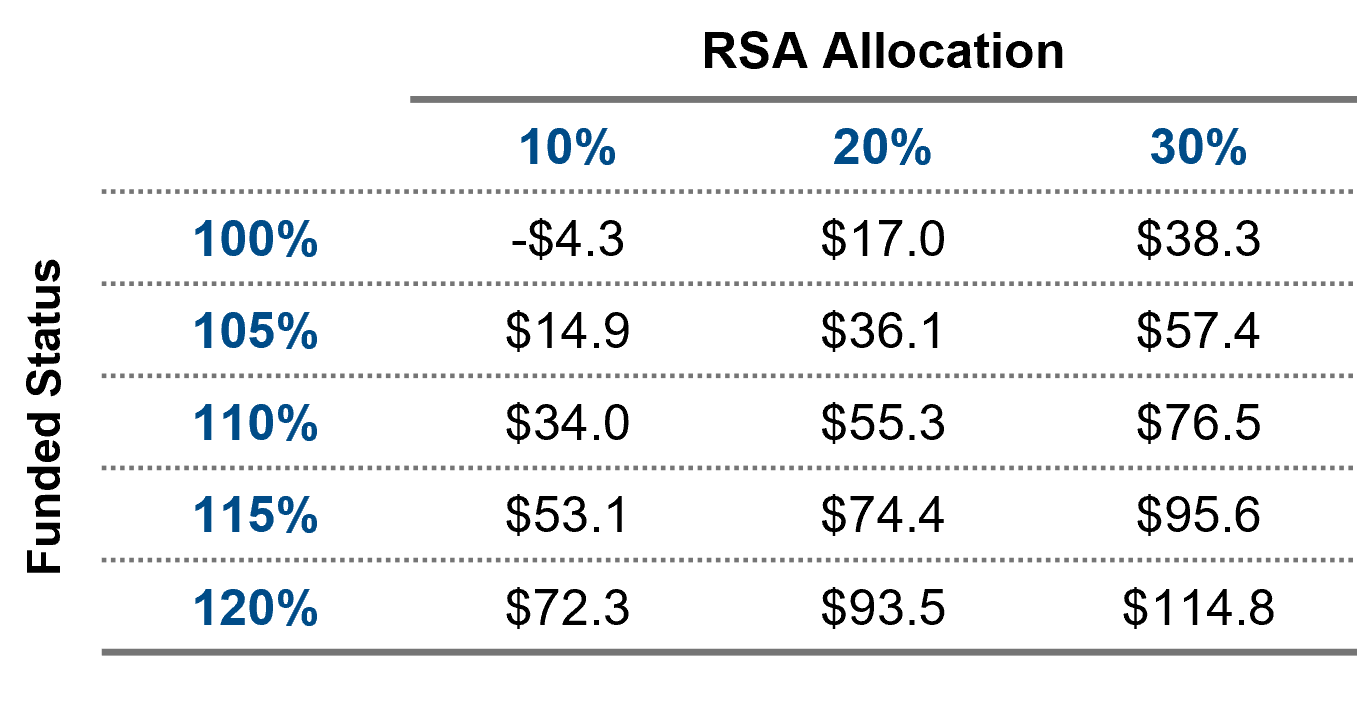
Using the excess return numbers from Figure 4 and applying the P/E ratios indicated above from life insurers, we can impute a price at which a corporation could consider either selling that earnings stream to an insurance company (e.g., how good of a price should you receive on an annuity buyout) or claim the value the pension reflects for pensioners and, by extension, the plan sponsor.
Based on an average insurer P/E of 8.5 in Figure 1, this implies a valuation of the pension based on the RSA allocation and funded status as depicted in Figure 5. As an example, a 110% funded plan, with a $1,000 pension liability and 30% in RSAs would imply a valuation of ~$77mm (0.90% Excess Return X $1,000 Liability X 8.5).
Figure 5: Illustrative Enterprise Value of the Pension
Our analysis has focused on the “E” (earnings) from the pension, and we are imputing a value, (e.g., the price of the futures earnings stream). A natural question is whether the P/E ratio of a life insurance company is reasonable to impute the value the pension provides to an organization. If an insurance company maintained an aggressive RSA strategy, it would naturally increase expected earnings, but the market would likely imply a lower valuation given the risk associated with that strategy. The same could be said for a pension, and why we limit the funded status volatility to <4.5% in order to maintain a reasonable analogy to a life insurer. Of course, when the funded status of a pension declines below 100%, plan sponsors are not required to raise additional capital quickly, unlike insurance companies. All else equal, more relaxed funding could result in the market implying a higher multiple to a pension earnings stream.
While the valuation comparison to a life insurer may or may not resonate with plan sponsors, in either case, the principle is that plan sponsors understand and put a value on an earnings stream from the pension — the same way they think of other business endeavors.
Takeaways: Reframing the Pension Fund as an Asset
A pension investment strategy can be designed to manage funded status volatility and be accretive to funded status. This approach generates multiple benefits to the plan sponsor and pensioners. Moreover, it doesn’t require an immediate decision on how to use the additional surplus, providing organizations even more flexibility. Ultimately, the pension represents an asset, not just a liability, and viewing it through that lens is beneficial for all stakeholders.
Additional Assumptions
Historical risk analysis data as of 3/31/2025:
- Historical return-seeking volatilities use one-year at-the-money (“ATM”) implied S&P 500 Index options volatilities.
- Correlation estimates use five years of monthly data.
- Historical interest rate volatilities use ATM option implied volatilities on Treasury bonds and interest rate swaps.
- Historical credit spread volatilities are calculated by scaling historical volatilities by the prevailing spread level.
[1] Based on NISA’s Pension Surplus Risk Index (“PSRX”).
[2] We recognize that this dichotomy isn’t perfect, but reasonable for the purposes at hand, as differences exist between the calculation of reserves and the valuation of pension liabilities.


