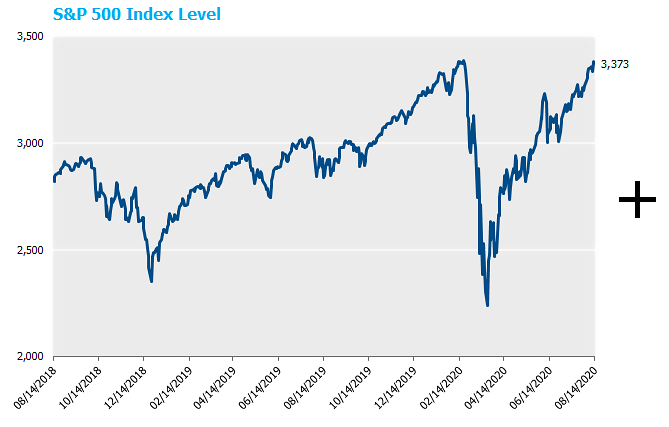
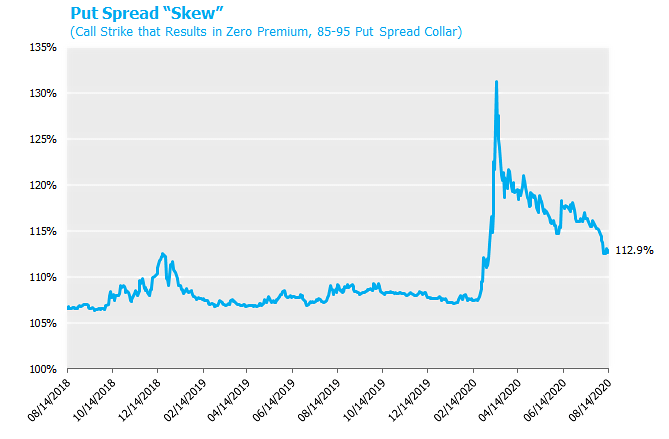
The combination of near all-time highs for the US large cap stocks and recent pricing of equity options at various strikes provides market participants with an interesting potential payoff profile over the next year. Specifically, investors can retain upside on the S&P 500 through 3,763, or 12.9% higher than its level at time of print, while securing a protection payment of as much as 10% in the event of a large sell-off from here. Let’s go through the mechanics.
First, a quick recap of common discussions regarding equity option protection strategies.
- An investor would like some degree of downside protection.
- Said investor is dissatisfied with the outright dollar cost to purchase a put option, so considers a zero premium collar – selling a call option at a strike above today’s level to finance the purchase of the protective put.
- The “skew” in the option collar is so large (i.e., puts “feel expensive” relative to calls), the investor either A.) Gives up or B.) Looks for ways to offset this skew.[1]
- In the case of B.) The investor decides to use this skew partially to their advantage by selling a further out of the money put option.
- This sold put allows the call option strike to rise appreciably, but now puts, pun intended, the investor back in the market if the selloff is particularly large.
Aha, a put-spread collar is born! For example, consider a one-year 85-95 put-spread collar.[2] That is, an investor who is long the S&P 500 purchases a put option at 95% of the current market level and sells a put option at 85% of the current market level. These positions have the combined effect of limiting the downside to a 5% loss, so long as the S&P 500 loses no more than 15% over the one-year horizon. For any decline beyond 15%, the investor again participates in the downside. Of course, since the purchased put is less out-of-the-money than the sold put, this protection will require a net payment. To make the overall net premium $0, a call option is sold at a strike above today’s levels to offset the net paid premiums of the put options. This call option has the effect of capping the investors upside at the strike level of the sold call.
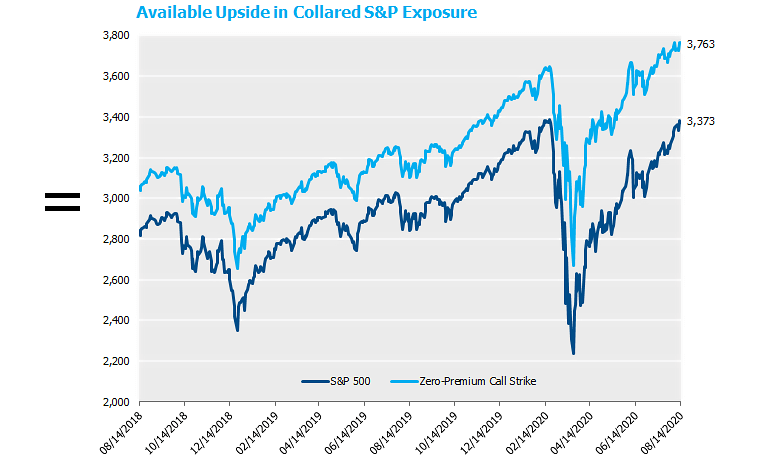
Two things have happened recently. First and most noticeably is the continued strong performance of US stocks that result in levels at or near all-time highs. Second and perhaps more obscurely is that equity option skew has gotten much more favorable for this structure. That is, the volatility of the sold put and sold call has increased more than the volatility of the purchased put. Since higher volatility results in higher option prices, this translates into larger available upside participation, all else equal. The graphs below demonstrate how these two developments lead to the largest available upside, as measured in the level of the S&P, that we have ever witnessed.
Focusing in on current levels, as of 8/14/20, the expected payoff profile for the 85-95 put spread collar is as follows[3]:
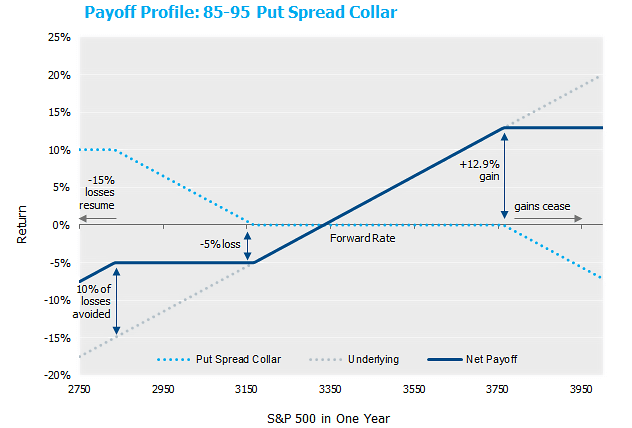
So in exchange for forgoing the upside above +12.9%, an investor will have protection for a fall in the S&P between 5% and 15%. Putting that into levels (with the S&P at 3,373 as of 8/14/20), if an investor is willing to sell the upside in the S&P above 3,763, an investor can have protection that temporarily stops losses if the S&P falls below 3167. By way of comparison, the current “post-COVID” rally just passed that level again as recently July 14th! Of course, given the nature of a put-spread collar, the losses resume if the S&P falls below 2,834, but the investor is spared 10% of the downside pain in this scenario.
Finally, a quick note about valuations. Or perhaps more accurately, this note is not about valuations. Our interest in sharing this strategy is purely driven by the current attractiveness of this structure’s payoff profile relative to recent history. It is not a statement that equities are overvalued. In fact, it isn’t even a statement on the “cheapness” of the option structure, per se. (This skew could simply be a manifestation of the markets current view of the distribution of equity movements going forward.) But as we looked at the optically lofty level on the S&P for the call strike, we thought any investor that has a growing discomfort with equity levels may find this structure worthy of further evaluation.
[1] Again, the reported strikes are relative to forward rates, not spot rates. Currently the 1 year forward rate on the S&P is ~3,333.56, or 1.16% below today’s value of the S&P. To demonstrate the importance of evaluating all payoff profiles using forward prices not spot levels, consider the purchase of a put option 1.16% out of the money vs. the spot level of the S&P (ATM vs. forward). It would appear the investors is at risk to a 1.16% decline in the S&P. But since the investor retains the dividend payment of their physical equities, in the event the S&P is down by 1.16% exactly, the expected dividend yield of 1.7% results in an all in total return of 1.7%-1.16%=.54% where 0.54% represents the effective risk free rate from classic derivative pricing formulas. That is, the investor experienced no economic loss. Of course, for any decline below 1.16%, the option payoff would be added to the all-in return, again resulting in a +.54% return, which feels like an at-the-money option, just as the comparison to forward levels would have suggested.
[2] Technically, observing positive skew is simply a statement that implied volatilities on puts is larger than that on calls. Though this equity skew makes this structure “feel expensive,” skew of this sort is neither unexpected nor unusual. Numerous, intuitive arguments can be made for skew, most notably non-normal equity return distributions (large left tails) and investor state-pricing (valuing payoffs in down economic scenarios more than up). Historical data is supportive of this view, as equity option skew is quite pervasive over time.
[3] Throughout this note, the moneyness of each option is reported relative to S&P forward levels not spot levels, which we believe is the appropriate way to evaluate the economic payoff profile to an investor who is long a cash investment in the S&P index and has entered the structure discussed.
**The use of derivatives introduces additional requirements and risks to the portfolio.