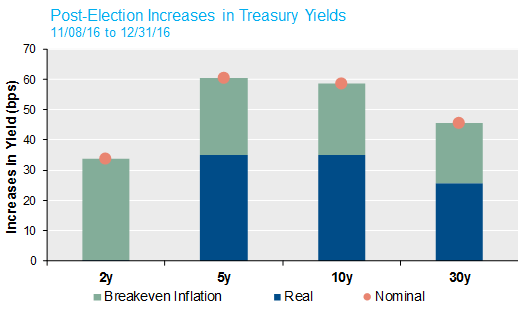
Changes in yields can provide insights into the market’s views on the potential results of anticipated policies of the Trump Administration. One of the more interesting dynamic relationships is that between TIPS and nominal Treasury yields, which offers guidance regarding real growth and inflation expectations. The graph below depicts changes in selected real and breakeven inflation rates (calculated as the difference in yield between nominal Treasuries and TIPS) since the election. Strikingly, there have been sharp increases in both real and breakeven rates (including a move in a preferred measure of the Fed toward its stated 2% inflation target).
 Source: Bloomberg.
Notably, the composition of the rate moves is markedly different between the two-year and five-year and longer maturities—with the two-year rate moving up due to higher inflation expectations while five-year and longer maturities increasing primarily due to real rates and more modest jumps in expected inflation. One interpretation of these relative moves is that two-year rates are indicating that the near-term boost in economic activity will simply arrive in higher realized inflation. Over longer horizons, however, the majority of the rate increases occurring in real rates suggests higher growth potential over this period.
Other factors have undoubtedly driven changes in the yields across the curve (e.g. the impact of increased oil prices on two year breakevens). Nonetheless, the yield changes across these different horizons offer a convenient way to reexamine how fiscal stimulus affects growth in the economy and inflation expectations. Though the analysis below may take you back to your Econ 101 days, we think it may provide a useful framework for deciphering the impact of the new administration’s plans—and the market’s interpretation of them—over the coming months.
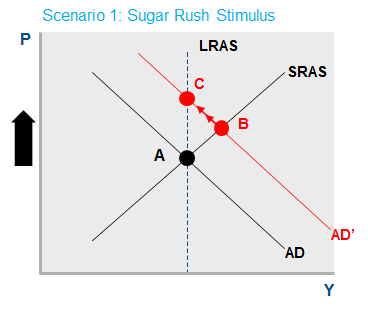
Scenario 1: Sugar Rush Stimulus
The graphic below uses the traditional framework for understanding two key aspects of an economy: the price of goods (P) and the total output of the economy (Y).1 When the economy receives fiscal stimulus, the Aggregate Demand curve (AD) curve shifts rightward to AD’, regardless of whether it’s a tax cut, a spending increase, or both. In the short run, equilibrium moves from point A to point B. Growth and inflation increase. If the stimulus is purely cyclical and doesn’t improve the productive capacity of the economy, prices adjust over time and we move back along AD’ to point C with a net result of higher inflation and no net growth. We could describe this as sugar rush stimulus, where the immediate boost to growth and inflation causes the economy to overheat and eventually reverse course.
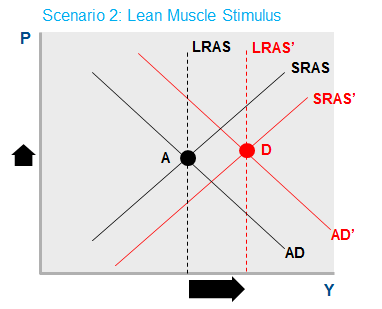
Scenario 2: Lean Muscle Stimulus
If Trump and the Republican Congress can design an economic agenda that succeeds where so many others have failed since the crisis—by increasing productivity (and possibly labor force participation)—things look much better. As in the first scenario, the AD curve shifts to the right because of the fiscal stimulus. As productivity increases, the Short Run Aggregate Supply (SRAS curve) also shifts rightward since each worker-hour produces more output at a given labor cost. The economy moves from point A to point D (if these productivity enhancements are permanent, LRAS curve also shifts to the right and the new equilibrium is sustainable). Because the productive capacity of the economy is increased, the demand boost from fiscal stimulus is less likely to bring about the shortages of goods and labor that characterize an overheating economy and which generate inflationary pressure. The relative magnitude of the shifts in the AD and AS curves determines the pace of inflation, but in any circumstance, growth is higher and inflation is lower relative to Scenario 1.
It has only been a short period of time since the election, and the new administration hasn’t even taken office yet. Nevertheless, bond market activity since early November has reflected both higher real and breakeven rates, and both are undoubtedly welcome developments in the eyes of central bank policymakers. It will be very interesting to watch this dynamic play out in Washington and the markets (and of course Twitter) over the coming months.
If we see increases in real rates, with well-contained increases in inflation expectations, the market will be likely converging on a view in line with Scenario 2—the economy is expected to grow and add lean muscle in terms of productive capacity. However, if we begin to see a material increase in inflation expectations with little increase in real rates, the sugar rush scenario is beginning to manifest and the benefit of the stimulus will fizzle quickly, with inflation headaches left behind.
One important postscript: This analysis is focused only on the impact of suggested fiscal stimulus. Accordingly, we ignored a third possible scenario involving protectionist policies, in the extreme, resulting in a trade war. For this third scenario, our classical framework would suggest a stagflationary environment: Aggregate Supply (AS) would shift left, reducing growth and increasing inflation.
1Recall that the AD-AS model distinguishes between Short Run (SRAS) and Long Run Aggregate Supply (LRAS), where LRAS is a vertical line determined by the size of the labor force and its productivity. The SRAS governs in the short term due to sticky prices and wages, but as prices adjust over time, the economy shifts along the demand curve to an equilibrium where AD = LRAS.