Recent market gyrations once again remind us of the importance of risk management in all aspects of an investor’s portfolio. One common risk management tool is the use of multiple managers in a given asset class, with the goal of manager diversification in mind. Yet, pervasive positive correlations among active fixed income managers’ excess returns can greatly diminish this diversification benefit (by 80% in one simple, but representative example below). Accordingly, for multi-manager portfolios we believe manager selection decisions should include the correlation of excess returns right alongside the expected alpha and tracking error.
Diversification: Dulcet Ditty or Dirge?
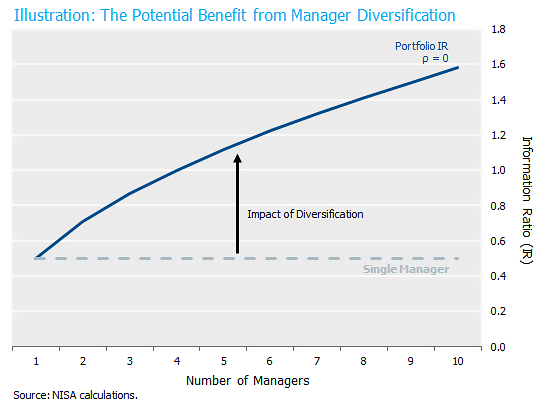
Amongst its many applications in finance, diversification is generally cited as the primary reason for asset owners’ use of multiple managers in a given asset class. With good reason: building a portfolio of active managers with varying styles provides the potential for large gains in risk-adjusted active returns. For example, consider a portfolio of five active managers who each have an information ratio (excess return divided by tracking error) of 0.5 and whose respective styles render zero correlation among their performance. If we give each manager an equal weight of the portfolio, their combined information ratio jumps to a whopping 1.12! Nearly a 125% increase in the risk-adjusted return relative to having allocated the entire portfolio to just one manager. Diversification proves its merits again. But this enticing improvement of risk-adjusted active returns could instead be a Siren song.[1] The chart below demonstrates the relationship between the number of managers and the resultant increase in information ratio, assuming the managers are uncorrelated.[2]
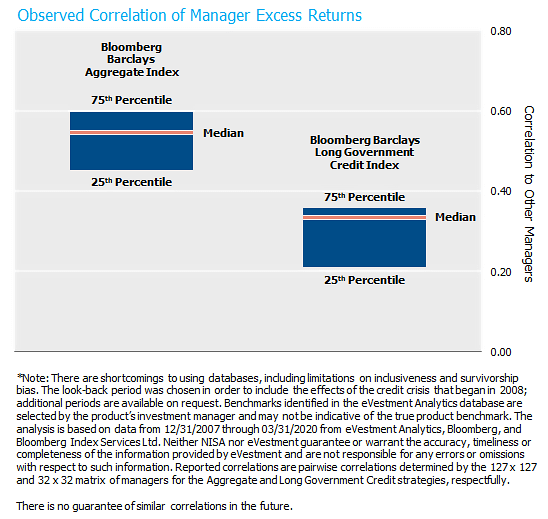
But what if managers’ excess returns are correlated? Clearly, any correlation will diminish the potency of diversification, but by how much? Of course, the magnitude of the reduction in diversification depends on the degree of correlation. In an effort to provide a representative analysis, we examined the observed correlations of managers’ excess returns. The charts below indicate the correlation of the excess returns among active fixed income managers in two of the most common indices – the Bloomberg Barclays Aggregate and Long Government Credit indices. In both groups, there is a high median correlation among managers’ performance (excess return): 0.55 and 0.34, respectively. Perhaps more curious is the high degree of correlation clustering shown in the chart below.[3]
Hopes of diversification dashed upon the rocks of correlated styles.
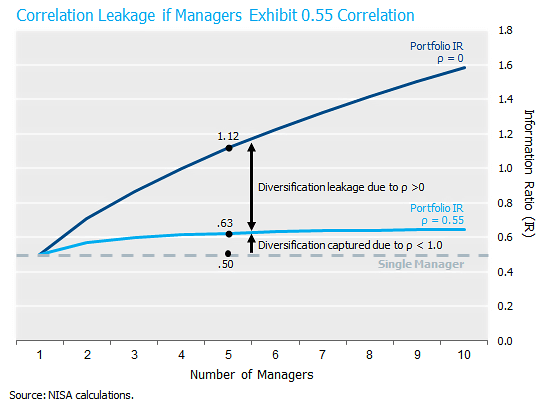
Though the median correlations above are substantial, a natural response could be “The correlations aren’t 1.0, so there is still a benefit to manager diversification.” True, but the gain due to diversification is highly non-linear with respect to the average correlation. Returning to our example of a 5-manager active portfolio, if they are instead correlated 0.55 (e.g., the median Aggregate manager correlation), there is an 80% reduction in the benefit from diversification, with a resulting portfolio information ratio of only 0.625![4] Using the median correlation for Long Government Credit managers results in a 63% leakage of the diversification benefits and a resultant portfolio information ratio of 0.728.
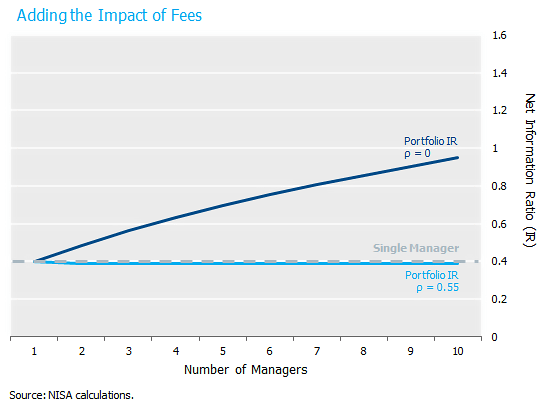
Of course, the analysis above is missing one important point of realism. Fees. Institutional investment management fees are typically tiered lower for larger engagements. While this is a great fact for asset owners, as it allows them to get the benefit of their own scale, when it comes to a multi-manager format this institutional fact introduces a direct cost to manager diversification. Specifically, as managers are added, higher overall fees result as each (now smaller account) “rides up” the fee tiers.
Since managers have different fee schedules, different degrees of tiering, different breakpoints, etc., we use a stylized example below. Specifically, we assume each manager has a fee of 20bps for a 100mm portfolio that declines linearly until the fee reaches 10bps at a portfolio size of $1,000mm.
With this added dose of reality, the benefits of diversification will vanish even more quickly. In fact, using the average Aggregate manager correlation, there is no benefit at all as the increased fees more than offset any benefit of diversification.
Tying oneself to the mast….of uncorrelated styles.
How does an asset owner get the benefit of diversifying managers without the downside? Odysseus chose to tie himself to the mast of his ship to allow himself to hear the Sirens’ song, while ordering his crew to plug their ears with wax and, to under no circumstance, release him. Asset owners need not take such a drastic approach, but Odysseus’ discipline to avoiding the peril is perhaps instructive.
One investment solution to this dilemma would be to choose one high conviction (aka high information ratio) manager. (Spoken like a true asset manager.) This may be the right approach, particularly for smaller asset owners where splitting mandates can result in materially higher overall fees or for engagements that have highly specialized objectives (e.g., liability matching mandates). But for most larger, standard fixed income portfolios, a multi-manager format likely makes the most sense. But the manager selection and the allocation amongst managers must hinge to a large degree on the realized and expected correlation among the managers – arguably as much as expected excess return and tracking error.
Let’s return to our 5-manager example and for simplicity ignore the impact of fees again. Clearly, it would be ideal to identify 5 uncorrelated styles, hence unlocking the full potential of manager diversification. To this end, great care should be taken to identify as many un- or lowly-correlated managers.
But based on the data above, which show a high degree of clustering around the reported median correlations, there may be limited managers that fit this profile.[5] Importantly, if an uncorrelated manager has been identified, the weights of the active managers should be tailored to reflect the positive externalities that arise from this uncorrelated style. For example, if just one of the five managers from the example above had a zero correlation with the others, the portfolio could now achieve an information ratio of 0.79. Said differently, the introduction of this one uncorrelated manager improved the information ratio by more than the original five correlated managers had in total! To achieve this better risk-adjusted return, the weights among the managers do, however, need to be altered dramatically. The uncorrelated manager would receive a weight of 40% while the remaining four receive 15% each. This seemingly innocuous difference in correlation results in this uncorrelated manager receiving nearly three times the allocation of the other, correlated managers.
Conclusion
Asset owners should pay close attention to correlation among their active managers. What can appear to be modest correlations among managers can eliminate most, if not all of the benefits of the diversification given typical fee structures. Potential solutions to snatch back some of this correlation leakage include:
- Identify one or more low or uncorrelated manager(s) to include in the active portfolio.
- Allocate to managers based on relative correlations in addition to information ratios.
Not discussed here, but additional solutions include:
- Optimize active manager allocations across all asset classes simultaneously. If the resultant allocations distort the overall asset allocation, use beta management strategies (e.g., derivative overlay) to realign the portfolio.
- Investigate the source of the correlation among managers. If it is due to a common exposure to market beta (e.g., fixed income managers’ systematic credit overweight), the optimization above must incorporate this exposure and appropriately penalize strategies that are correlated to the portfolio major risk factors. (This point is important enough to warrant its own Perspectives piece.)
[1] In Greek mythology, the Sirens were creatures that lured sailors with their beautiful songs, generally leaving them shipwrecked.
[2] Throughout this note, we ignore the potential for negatively correlated managers. We do this for two reasons; 1.) the simplicity of explanation without harming the crux of the argument and 2.) with enough negatively correlated managers, the results can lead to riskless profits, which is neither observed in the data nor reasonable to occur in practice.
[3] This fact is probably less “curious” than it is expected. As we and others have pointed out in in the past, a majority of fixed income managers’ excess returns are correlated to risk-asset markets (e.g., credit spreads, equities, etc.) Given the commonality of this beta in manager excess returns, it is reasonable to expect that managers are correlated with one another, a loose transitivity property of sorts. Estimates of these correlations can be found here and here.
[4] We define the loss of diversification benefit as the proportion of the potential information ratio improvement assuming zero correlation that is lost when we instead use an actual, observed correlation. Using the example in the text above (1.12 -0.625)/(1.12-.5) =79.8%
[5]We may be aware of one negatively correlated manager.* 🙂
*Note: There are shortcomings to using databases, including limitations on inclusiveness and survivorship bias. The look-back period was chosen in order to include the effects of the credit crisis that began in 2008; additional periods are available on request. Benchmarks identified in the eVestment Analytics database are selected by the product’s investment manager and may not be indicative of the true product benchmark. The analysis is based on data from 12/31/2007 through 03/31/2020 from eVestment Analytics, Bloomberg, and Bloomberg Index Services Ltd. Neither NISA nor eVestment guarantee or warrant the accuracy, timeliness or completeness of the information provided by eVestment and are not responsible for any errors or omissions with respect to such information. Reported correlations are pairwise correlations determined by the 127 x 127 and 32 x 32 matrix of managers for the Aggregate and Long Government Credit strategies, respectfully.
There is no guarantee of similar correlations in the future.