When volatility increases for a particular market (e.g., interest rates, credit spreads, or equity), the potential pain felt by the wrong move or satisfaction felt by the right move can be amplified. Over the last few months we have seen risk increase across a multitude of markets. Our last piece “Are Static Hedge Ratios Really Static?” focused exclusively on how unhedged interest rate exposure increases as rates fall. This post combines that observation with the fact that any view on interest rates has become riskier due to heightened volatility.
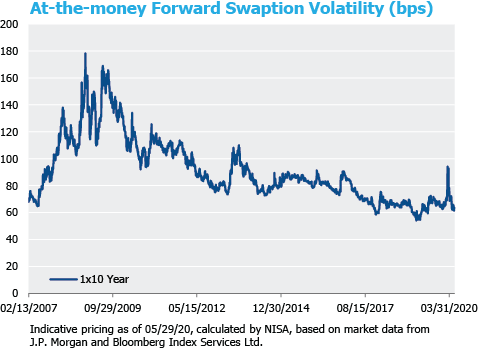
The chart below highlights 1×10 year implied-swaption volatility.[1] Implied volatility allows one to observe what the collective market believes volatility will be over a specified period. Accordingly, we often refer to implied volatility as a forward-looking estimate of volatility. Swaption-implied volatility, specifically, provides a forward-looking measure of general interest rate volatility. For quite some time before March 2020 implied volatility on swaptions had remained between 55-65 basis points (bps). This relatively low level of volatility tells us something very important about the range of likely yield movements. For example, if the 10-year rate is 2% and volatility is 60bps, the implied one standard deviation range of 10-year rates over the subsequent year is 140bps to 260bps. Of course, the market’s assessment of volatility can change quite rapidly. By the middle of March implied-rate volatility peaked around 100bps and the realized-rate volatility during that time period was a whopping 250bps. These levels of volatility would have suggested a much wider range of possible outcomes for yields, which is intuitive given the enormous uncertainty that arose with the onset of the COVID-19 pandemic in the U.S. Subsequently, we have seen a normalization of implied rate volatility closer to pre-March levels.
As the chart below depicts rate volatility in March was the highest we have observed for 7 years. That said, as we have returned to more “normal levels” of volatility, the question is: should a pension plan be less concerned with interest rate risk? Given the dramatically lower levels of interest rates now versus at the beginning of the year, we will need to combine some of the observations from our previous post to answer this question.
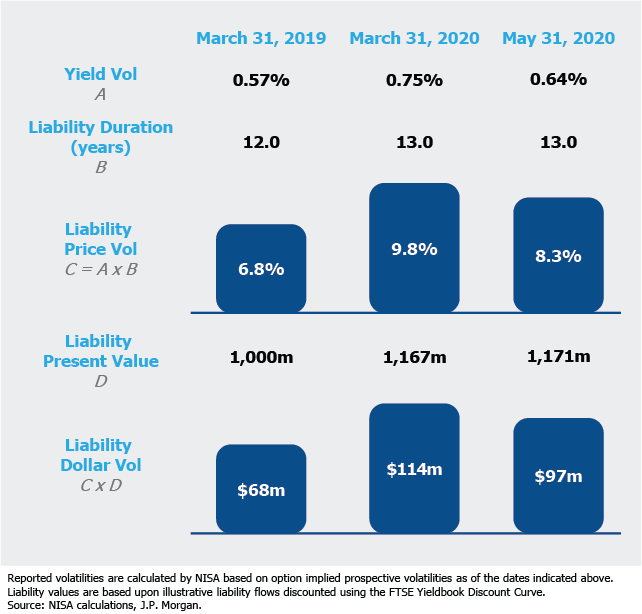
There are two ways to think about the volatility of a liability — in yield or in price (i.e., dollar value of the liability). In the following example we focus exclusively on interest rate volatility.[2] The price volatility is calculated as the yield volatility multiplied by the duration of the liability. If one focuses only on yield volatility, the increasing value and duration of the liability is overlooked. The visual below depicts what happened to the risk of a 12-year duration pension liability from March 2019 (when the 30-year rate was around 3%), to March 2020 (when the 30-year rate was 1.3%), and finally May 2020 (when interest rate volatility normalized to pre-crisis levels).
Implications for Partially Unhedged Pension Liabilities
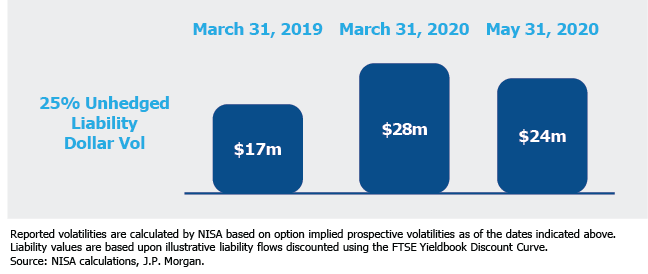
A plan with a 100% interest rate hedge ratio will generally be unaffected by increases in volatility.[3] As depicted below, for a plan implementing a 75% hedge ratio (i.e., 25% unhedged ratio), increased volatility causes an increase in funded status volatility for the unhedged position. In fact, as measured from March 2019 to May 2020, the funded status volatility of the unhedged position increased by approximately 41%. This dollar impact grows more material for plans with lower hedge ratios, though not in proportion.
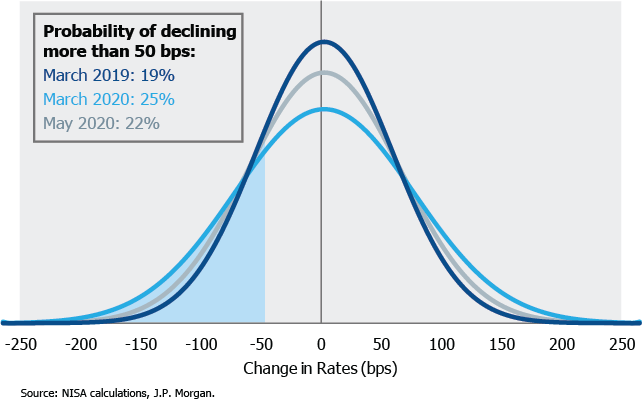
A similar issue occurs if the probability of a change in interest rates is used as a risk metric. The chart below shows a simple normal distribution based on the implied volatilities discussed above.[4] As displayed in the chart below while the probability of at least a 50bps decline in rates varied between the time periods (increasing from 19% to 25%), this distribution misses the impact of changing liability statistics.
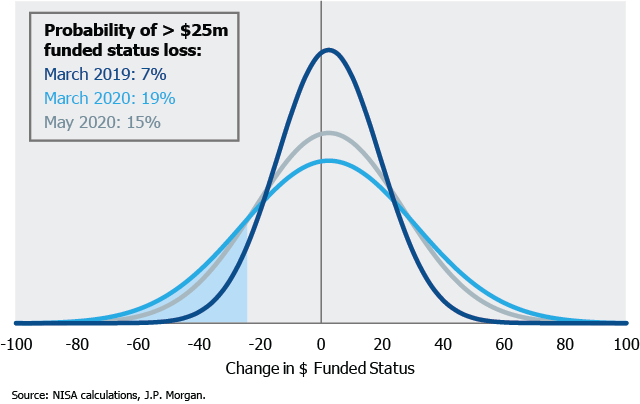
Plan sponsors may prefer to describe their risk from the standpoint of an acceptable downside dollar deficit. A fall in dollar funded status increases the need for additional contributions. In the example below, if a plan is willing to accept $25m of downside exposure, the probability of breaking through that level increased significantly over the last 12 months as volatility has increased and rates have fallen. For example, in the distribution shown below for March 2019 there would have been a 7% probability of losing $25m of funded status, but, that probability grew to 19% by March 2020, and was 15% as of May 2020. The probability of a specified dollar loss in funded status is driven not only by market volatility, but also by increases in the duration and present value of the liability.
Conclusion
The only way to properly assess the risk associated with an unhedged interest rate position is to combine market volatilities and liability statistics. Not only must the risk be holistically assessed but a plan’s risk tolerance may also change over time; what was once an acceptable loss in pension funded status may no longer be the case. Given the current environment, now may be a good point to reassess how risk in the pension has changed over the last year.
[1] Swaption nomenclature indicates the expiry of the option along with the tenor of the interest rate swap. For example, 1×10 year indicates a swaption, which expires 1 year from now valued based on the 10-year swap at expiry.
[2] For simplicity volatility to credit spreads is excluded.
[3] Although a plan sponsor may be hedged against parallel shifts in the yield curve, during a higher volatility environment differences in yield curve and residual convexity can increase.
[4] As we approach 0% interest rates it is appropriate to ask whether a normal distribution is still an appropriate assumption. Interestingly at this point, when examining interest rate distributions implied from swaption markets, a normal distribution is still a reasonable assumption.