Authors’ note: The timing of this piece may seem curious in these crazy times – specifically, a post that explores how “bond math” leads to increasing interest rate exposures in a low rate environment. We aren’t sure which reason is more appropriate to describe the timing; the fact that we started on this idea before the recent crisis or that the drafting provided a much needed respite from the news cycle. If you are inclined to read on, we hope your experience will be similarly therapeutic. And incidentally, it seems even more timely than when we started it.
Summary
Once a plan sets a hedge ratio, the conventional view is that the interest-rate risk is fixed. By definition, if a plan sets a hedge ratio at 75%, that hedge percentage will remain constant, even as interest rates change; however, the dollar value of the 25% unhedged portion will grow as rates fall (and shrink as rates rise). When rates fall materially (as we have just experienced), the dollar value of the unhedged rate exposure grows materially. This growth is fueled by two sources—the growth in the liability AND its lengthening of the duration.
The analysis below provides some perspective on how unhedged interest-rate risk, whether intentional or not, changes materially with interest rates.
Mechanics of Interest Rate Risk
Before jumping into the analysis, let’s refresh our thoughts on the mechanics of interest-rate risk. The dollar value of the liability’s interest-rate exposure is its dollar duration, which is the product of present value and duration, commonly expressed as DV01.[1] Since falling rates increase both present value and duration, the dollar duration increases geometrically. The table below demonstrates this relationship using some government interest rate guideposts to help make various rate levels more tangible.
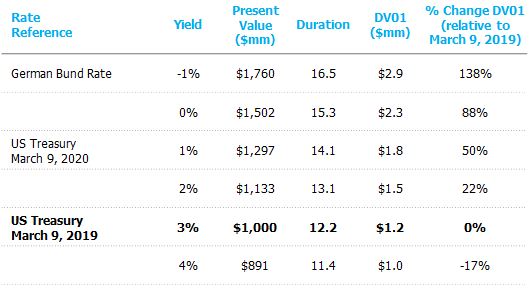
Analysis based upon an illustrative plan that is 100% funded with a $1.0 billion liability
present value. The liability flows are discounted at a 3.00% discount rate.
Source: NISA Calculations.
In March 2019, the 30-year Treasury rate was at 3%; one year later, it had briefly breached 1%. The simplified example in the table above shows that the DV01 of the liability grew by 50% over that time period. If interest rates fall further to approximate levels seen in Germany, the DV01 could increase by another 58%!
While it’s well understood that falling rates cause the present value to grow, the reason for the changing duration is a bit more subtle. The lengthening duration in the table above is a function of the convexity of the liability, which varies by plan, as longer duration liabilities have more convexity than shorter duration liabilities. We seldom pass on an opportunity to mention convexity.
While this post is focusing exclusively on interest rate risk (e.g., changes in Treasury rates), it is important to remember the total discount rate (Treasury rates + credit spreads) determines your point-estimate of the DV01 of a particular liability. The impact on the present value of the liability and duration is independent of whether or not a particular change comes from changes in credit spreads or Treasury rates. The table above, although focused on Treasury rates can be thought of as the overall discount rate without loss of generality. This is especially important for the month of March where common discount curve credit spreads moved by over 100bps throughout the month and Treasury rates by 50bps.
While the mechanics of interest rate risk are interesting, what determines the risk to the plan is the net unhedged interest-rate exposure and how a plan rebalances to its target hedge.
Interest Rate Hedge Policies
As interest rates move, it is important to reassess, or quantify, how much rate exposure can change given the new level of interest rates. Specifically, how much does a plan’s net interest-rate exposure (asset DV01 minus liability DV01) change in the context of two common investment policies: 1) static liability hedge ratios, and 2) static asset allocation weights. For comparison purposes, we also considered a static dollar interest-rate exposure. We define each as follows:
- Static Liability Hedge Ratio (SHR): The plan specifies a target hedge ratio (e.g., 75%). A plan-wide mandate (e.g., completion portfolio) is designed to maintain the hedge ratio, irrespective of the allocation weights of the underlying plan assets (i.e., fixed income, equities, alternatives, etc.).
- Static Asset Allocation Weights (SAA): Each asset class, with a stated benchmark, has a specified percentage weight (e.g., 50/50 equities/fixed). Since the size of the assets and liability and their durations are continually changing SAA can be thought of as a floating hedge ratio.
- Static Dollar Interest-Rate Exposure Target (SDE). The plan designates a desired interest-rate exposure using a dollars-at-risk measure (e.g., -$1mm DV01). The strategy rebalances the plan’s overall net interest-rate exposure to the target, irrespective of the moves in underlying plan assets (i.e., fixed income, equities, alternatives, etc.) or the size of the liability. (Note, this is seldom done in practice, but a useful reference point.)
The chart below illustrates the impact of each rebalancing policy on the unhedged interest-rate exposure of a plan as interest rates change. At a 3% yield the three potential hedge strategies are set equal to a 75% hedge ratio from a dollars at risk perspective. The static dollar strategy (SDE) requires little explanation as it is independent of changes in interest rates and, regardless of the environment, maintains constant exposure.
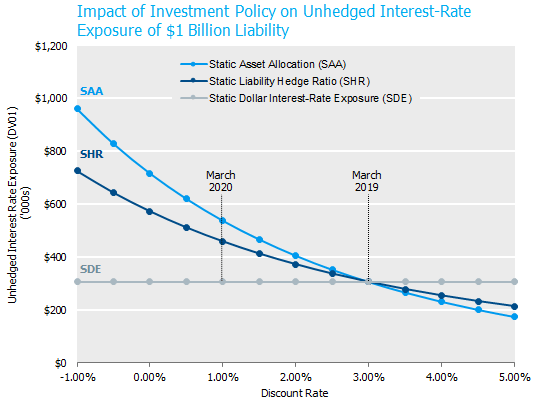
Source: NISA Calculations.
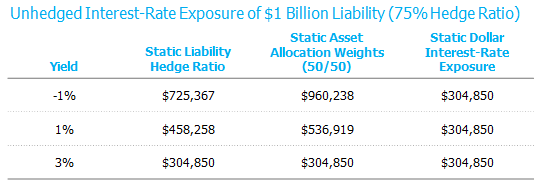
Static Liability Hedge Ratio (SHR): Perhaps the most interesting dynamic of this strategy is that for plans that target a rate hedge of less than 100%, the funded status (in dollars) at risk will change based on prevailing interest rates.[2] Specifically, lower interest rates lead to higher net dollar duration exposure and higher interest rates lead to lower net dollar duration exposure. Using recent rate movements as a reference, the increase in dollars-at-risk due to interest rates is significant. For example, let’s start with a 3% discount rate and move interest rates down to 1% (level of 30-year Treasury on March 9th). For a $1 billion plan that was 75% hedged, its net unhedged interest-rate exposure went from $305k to $458k, a 50% increase. If rates were to drop to -1% (i.e., levels comparable to current German Bund rates), the net interest rate exposure would further increase to $725k – a whopping 140% larger than the unhedged interest-rate exposure from one year earlier.
Static Asset Allocation Weight (SAA): This policy exposes the plan to a larger increase in dollar interest rate risk than the SHR approach. As rates fall, fixed income assets are rebalanced into equities. If equities are falling, a likely scenario given the relationship between equities and fixed income, the asset re-allocation is even larger. The chart above assumes the dollars invested in equities do not change before the asset rebalancing. So, with the SAA strategy, the plan is subject to the risk associated with a static hedge ratio plus the increased rate risk from rebalancing fixed income into equities, thus leading to a greater increase in dollars-at-risk. In the example above, with a rate move from 3% to 1% and a 50% equity, 50% fixed income allocation, the unhedged interest rate exposure grows by $79k, or 17% more than the static hedge ratio approach.
Hedge Strategy Considerations/Suggestions
- Consider re-evaluating the hedge target upon significant moves in the level of rates. Rates falling naturally increases the dollar risk to a plan’s sensitivity in interest rates. This may be occurring in an environment where you are less willing to accept the risk.
- Consider sizing the hedge ratio, based on net dollar interest rate risk.
- Consider implementing a completion portfolio which can maintain the desired level of interest-rate exposure either by a static hedge ratio or a static dollar exposure target.
- Utilize synthetic instruments to buy or sell return-seeking assets that need to be rebalanced. This allows you to maintain desired interest-rate exposure during asset allocation adjustments.
Lower rates increase the potency of unhedged interest-rate exposure. When considering a decrease in the plan’s hedge ratio, it is useful to take stock of how the net, unhedged interest rate position has changed.
[1] Of course, by definition the funded status percentage at risk remains constant by design.
[2] DV01 represents the change in value of the liability due to a 1 basis point change in rates. DV01 = (Present Value * Duration) x 0.0001.