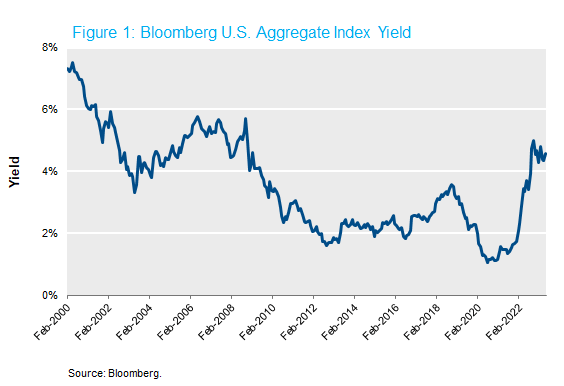
A strong core is foundational to overall health and stability, and your investment portfolio is no exception. Cutting out or down on ”excess” (e.g., beta disguised as alpha), while also employing a blend of the right strategies with moderation enhances a portfolio’s risk-adjusted returns. Investors also need to be wary of throwing out effective enhancement strategies in favor of seeking the lowest available fee through passive management (e.g., beware of ”fad diets”). They key is finding the right balance. With an effective Fed Funds rate of 5.08%, fixed income investments are once again receiving attention during asset allocation discussions. The last time the Fed Funds rate was this high was 2007, over 15 years ago. With the yield on the Bloomberg U.S. Aggregate Index (“Aggregate Index”) at approximately 5% and new-found attention on fixed income strategies, the time is right to strengthen your core portfolio.
Fixed income allocations serve different purposes for different investors, but core fixed income provides diversification from traditional risk assets and often acts as an important source of liquidity for the overall portfolio. But to serve this role, it is important that investment managers do not materially change the liquidity or risk profile versus the stated policy benchmark. In other words, they don’t systematically hold material exposures which are riskier than the benchmark for the purpose of earning additional yield.
In this post, we examine the drivers and timing of manager alpha — finding that while manager excess return is positive, market betas drive a material portion of the performance and can often show up at precisely the wrong time.
Examining Alpha
In order to break down the sources of alpha from fixed income managers, NISA referenced the eVestment database, filtering for the following criteria:
- Continuous history since 2008
- Tracking error of <4% to the Aggregate Index
- Products that appeared duplicative were removed – a correlation higher than 0.95 between two products from the same asset manager
- Self-identified core plus or stable value products were removed from the analysis
- At least $1b of AUM in the product
The above filter resulted in a list of 71 different investment products, including NISA’s core product. All manager returns were reported on a net-of-fee basis. Summary statistics for this investment universe are outlined in Figure 2.
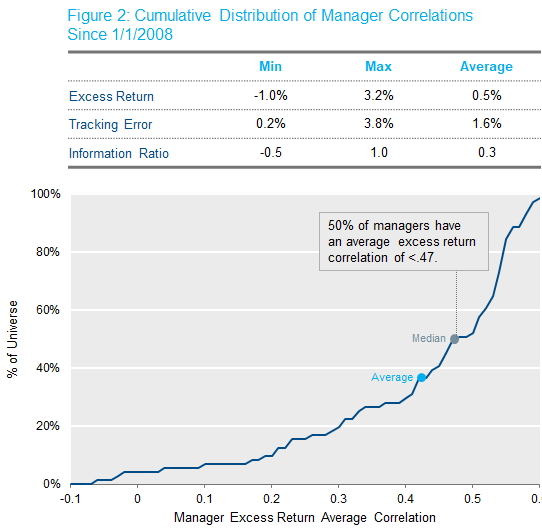
Additionally, the average correlation between the managers’ excess return was 0.42, with three managers, including NISA, exhibiting an average negative correlation to other managers. While not the key purpose of this piece, it is worth noting that having low or negative correlation between alpha sources is very useful when constructing a multi-manager fixed income portfolio. Furthermore, the purported diversification benefits of a multi-manager portfolio are likely overstated given an average correlation of 0.42.[1]
Though the summary data in Figure 2 is interesting, our goal was to examine whether the excess return of the field of managers exhibits a significant beta to the following market factors: interest rates, credit spreads or securitized spreads – a measure of managers mixing beta in their alpha. In turn, we can then estimate an implicit impact on the policy allocation. To estimate manager exposure, NISA used manager excess returns as measured against the Aggregate Index (left hand side variable) regressed against changes in 10-year Treasury rates, credit excess returns and securitized excess returns.[2]
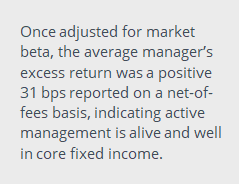
Prior to adjusting for manager market exposures, the average manager had 50 bps of net excess return to the Aggregate Index. After adjusting for market betas, the average manager’s excess return was reduced by 19 bps to ~31 bps. We believe this beta-adjusted measure more genuinely reflects “true” manager alpha. Of course, if we were to examine the range of alpha’s after adjusting for market betas we see the 25th to 75th percentile range from 4 bps to 51 bps. Moreover, if we examine how many of those managers had statistically significant alpha above zero, we find that only 22 out of 71 managers met that criteria.[3]
 A fair question would be why an investor should care if managers consistently take market risk to pursue “alpha” if it ultimately results in a higher total return? This isn’t alpha; a manager took market risk which, likely in the case of credit exposure, delivered a risk premium to the investor. An investor could have received this same return simply by changing the benchmark (i.e., it didn’t require manager skill – yet the manager likely charged active fees). Again, this may be fine, as most fixed income managers deliver a portion of their excess returns this way. We submit that is precisely the problem — that taking market risk is a strategic decision when setting the asset allocation or, if pursued by managers, more appropriate for the return-seeking portion of the portfolio.
Moreover, active managers pursuing excessive market risk moves an investor away from their strategic asset allocation and, depending on the combination of a manager’s returns, may do so materially.
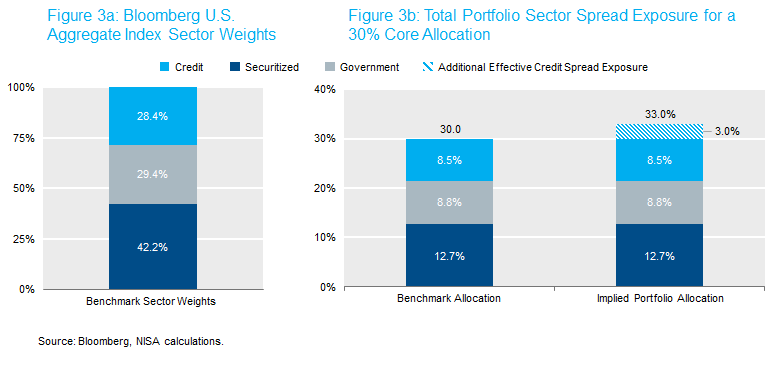
Figure 3a illustrates the current Aggregate Index weights, while figure 3b illustrates the total portfolio level weights for an investor with a 30% allocation to the Aggregate Index. The next series represents a different way for an investor to interpret how a manager over or under weight impacts the overall portfolio. For illustration, we show a manager with 0.1 beta to credit excess returns. Said differently, the portfolio has an additional 10% exposure to credit than the benchmark would suggest. If the Aggregate Index has a 28% allocation to credit, this manager would effectively have a 38% allocation to credit. When measured on a 30% portfolio allocation, this could be thought of as credit increasing from 8.5% to 11.5% of the total portfolio. Importantly this may not mean that 38% of the market value of the portfolio is invested in credit, although that could be the case. The manager may have purchased lower quality or longer duration securities with less dollars. However, from a risk perspective the net impact resulted in the manager’s portfolio behaving similar to a 38% credit allocation.
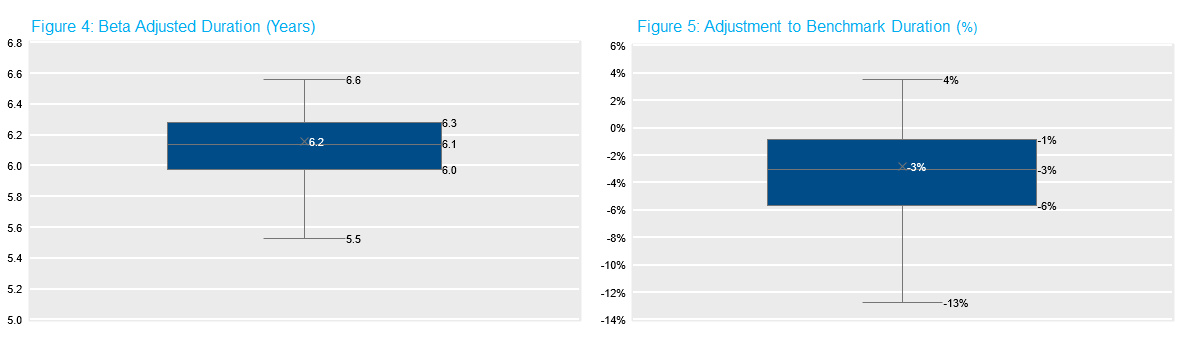
Related, investors may be interested to learn that while the vast majority of managers have statistically significant exposure to interest rates, the magnitude is relatively minor. The 25th – 75th percentile represents a -0.36 to -0.05 duration exposure to interest rates relative to the benchmark. Since the underlying rate exposure is responsible for a large part of the diversification benefit of the core allocation, it is reassuring to see interest rate exposures are generally in line with the benchmark.
Figure 4 illustrates the range of manager adjustments to the effective portfolio duration, while Figure 5 gives a sense of the % duration adjustment. For example, a 5% adjustment to the benchmark duration would be six years of duration effectively being increased to 6.3.
A very different story appears with respect to credit spreads. In fact, the average manager’s overweight to credit spreads is 14%, with a 25th-75th percentile between 7% to 20%. Moreover, given correlations between spreads, interest rates and equities, this change has the potential to offset the desired diversification coming from the fixed income.
Figure 6 “Beta Credit Spreads (%)” frames the discussion around % allocation to credit. For the Aggregate Index, the current benchmark allocation is 28% which would be below the 25th percentile manager exposure. When thinking about this as a ratio, as depicted in Figure 7, the median manager has 1.5x the credit exposure of the benchmark (based on 3/31/2023 benchmark weights). This is a sizable movement in the underlying core allocation, and likely substantially more credit than expected by investors.
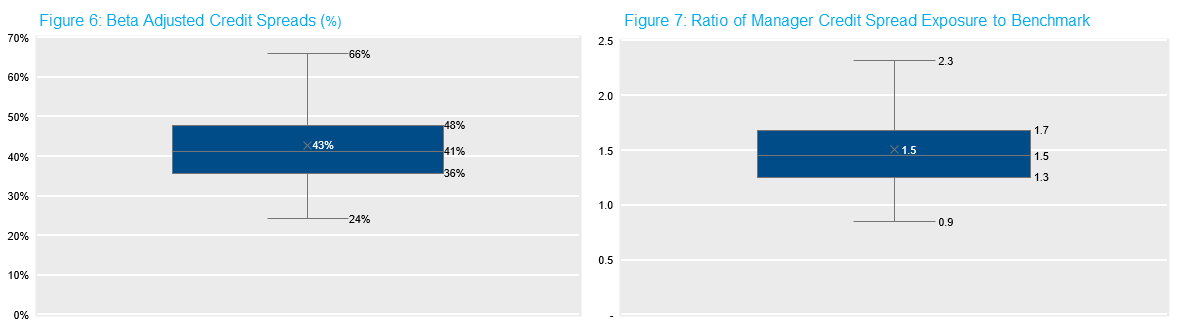
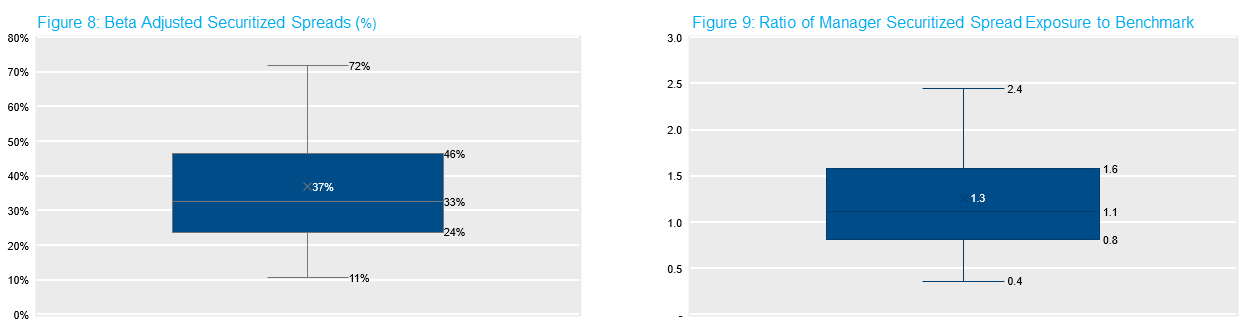
Figure 8 and Figure 9 provide the same metrics for securitized spreads, which unsurprisingly, have the most disparate story as they can play multiple roles in the portfolio. For some managers, this represents a less potent version of credit spreads so at the 75th percentile you see a 17% overweight. At the 25th percentile, we see an underweight of 5%. This could occur when managers replace lower yielding securitized assets with higher yielding credit assets.
Investors select a strategic asset allocation for a reason. Don’t let risk-seeking from active managers move you away from those objectives.
Drawdown Scenarios
As mentioned, a key property of the fixed income allocation is that it “shows up for work” when investors need it. This means in risk-off environments investors may value alpha more than in up markets. Why? It is these markets in particular where investors need the additional return at the total portfolio level or at the very least, need to avoid additional harm through negative alpha. Additionally, investors may need to raise cash either for portfolio rebalancing, or to meet cashflow needs. The core bond allocation is often the first place the asset owner turns for liquidity needs.
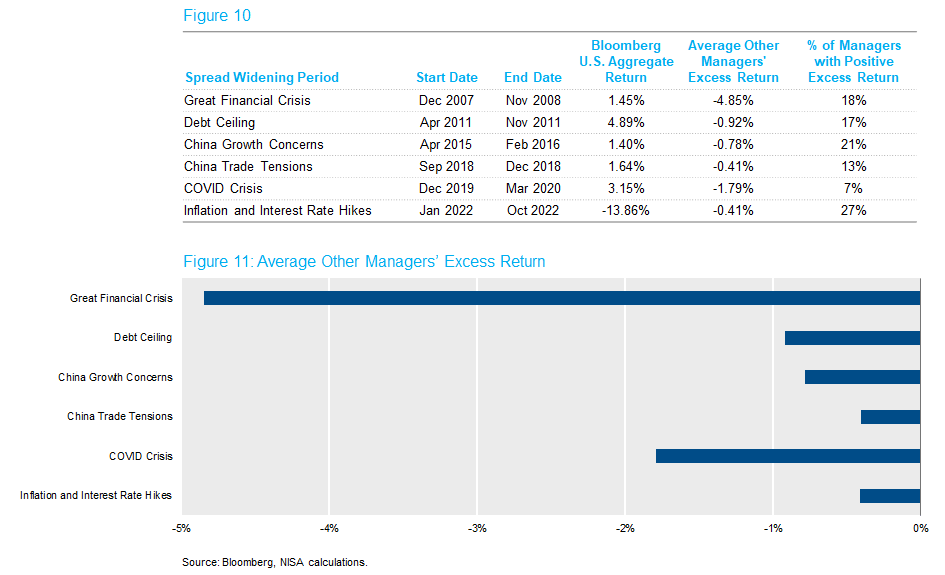
All else equal, core managers that exhibit these “show up for work” qualities can be expected to have smaller market betas versus their benchmark. Unfortunately, those managers that have enhancement strategies correlated with the market likely underperform at precisely the wrong time. Figure 10 identifies market environments in which Aggregate Index spreads widened 15 bps over a period of three months or more.[4] This occurred in six different market events starting with the Great Financial Crisis and ending in 2022. Across these periods, managers underperformed by 153 bps on average. The single worst month of manager performance saw the average manager underperform by 160 bps. Of course, these numbers represent the average, but with only around one out of five managers exhibiting positive performance in these time periods, locating managers with enhancement strategies uncorrelated to the market is key.
Additional Core Strengthening Techniques
While highly custom bond allocations are more common for corporate pensions, broad-based benchmarks such as the Aggregate Index are used by many types of investors. Getting more from your fixed income allocation can mean customizing an allocation to investor-specific preferences such as return, diversification and liquidity.
- Consider a benchmark that uses a custom mix of credit, securitized and Treasuries to meet the desired liquidity and risk profile.
- Hire managers that specialize in each sector of a fixed income policy benchmark. This reduces the ability for managers to change the risk/return preferences of the fixed income policy allocation.
- Use investment guidelines to limit a manager’s ability to take positions which materially impact the risk and liquidity profile of the fixed income allocation.
- Consider fixed income mandates which are strategically aligned to the cash flow needs (i.e., duration) of the investor.
With yields at levels last seen in 2008, 2023 provides investors the perfect opportunity to strengthen their core allocation, so that the fixed income portfolio will “show up to work” when needed most.
[1]Discussed in detail in the NISA Perspectives post “The Siren Song of Manager Diversification.”
[2]10-year Treasury rate changes (USGG10YR Govt), credit excess returns (LUCRTRUU Index), securitized excess returns (LD19TRUU Index).
[3]Used a right tail t-test at a 5% significance level.
[4]Keep in mind, Aggregate Index spreads widening by 15 bps is meaningful. Since credit only represents 28% of the Aggregate Index, this would be equal to around a 55-bps credit index widening.