With no shortage of economic uncertainty in the world, it is natural to ask whether the US consumer can continue as the primary engine driving the expansion. Our answer to that question is yes.
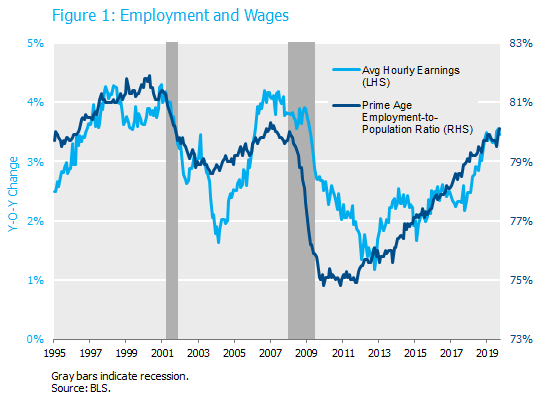
You’ve no doubt seen many of the well-known statistics describing today’s exceptionally strong labor market. The unemployment rate is at a 50-year low and there are currently more job openings than unemployed persons in the United States. As shown in Figure 1, the prime age employment-to-population ratio has recently regained its peak from the previous cycle and wage growth has broken above the 3% level for the first time in a decade.
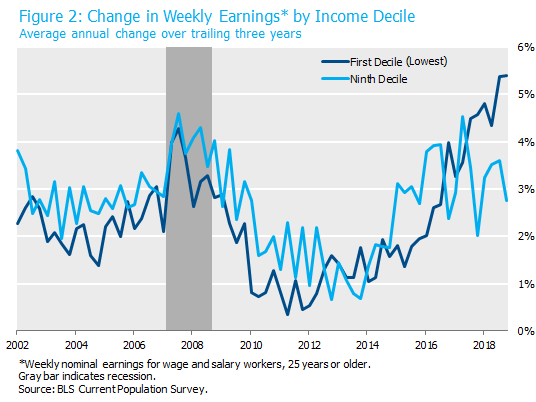
Less well-known is the degree to which the benefits of a tight labor market are accruing to workers across the demographic spectrum. The unemployment rate gap between workers with a college degree and workers without a high school diploma is the narrowest it has ever been. Tight labor markets are translating to higher wage growth across all income levels. As shown in Figure 2, wages have been rising faster for low-income workers than for high-income workers for the last three years. High employment and rising wages (not to mention lower tax rates) are pushing disposable income higher and fueling strong consumer spending, especially now that disposable income gains are accruing to low-income workers who have a higher marginal propensity to spend their new income.
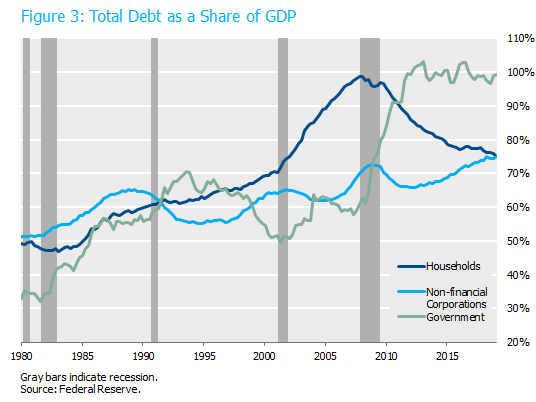
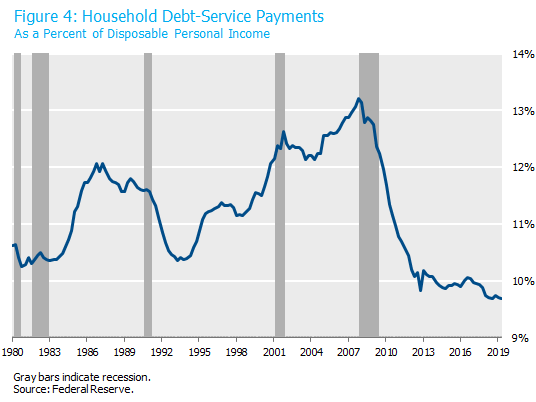
It seems to be a little known fact that household balance sheets are in excellent shape after a decade of deleveraging since the crisis. Household debt as a share of GDP has declined by 20% since 2008 (Figure 3). The combination of balance sheet deleveraging and record-low interest rates results in a household debt-service ratio at the lowest level in 40 years (Figure 4). Note that the past three recessions were preceded by a rapid increase in consumer debt-service ratios.
Given the strength of the labor market and exceptional health of household finances, we expect consumer spending to remain strong enough to offset the manufacturing slowdown and sustain the expansion. A strong labor market that continues to provide job security and rising wages is a key element of that thesis. Monthly nonfarm payrolls growth is averaging 167,000 year-to-date, down from the 223,000 average pace of 2018. This is consistent with the slowdown in economic growth from the fiscal stimulus-fueled 3% rate of 2018, as well as a labor market that may finally be approaching full employment.
How much would job growth have to decline to cause concern for the consumer outlook? A former labor economist at the Fed, Claudia Sahm, developed a rule of thumb for a recession signal from the labor market. The Sahm Rule holds that if the three-month moving average of the unemployment rate increases by 0.5% above the minimum over the previous 12 months, the economy is most likely in a recession. For context, the unemployment rate has fallen steadily from its October 2009 peak of 10% and remained under 4% every month since March 2018. The labor force constitutes 164 million persons today so the economy would need to destroy 820,000 jobs to raise the unemployment rate by 0.5% (assuming no change to the labor force participation rate). The economy needs to create roughly 85,000 jobs per month just to accommodate growth of the labor force and hold the unemployment rate constant. So, if the monthly change in nonfarm payrolls started printing zero jobs each month it would take 10 months to destroy 850,000 jobs relative to the replacement rate and raise the unemployment rate by a bit more than 0.5%.
That strikes us as a fairly high bar to clear for the labor market to deteriorate to the point of sparking a consumer-led recession. And let’s not forget the economy is now benefitting from a significant tailwind from easier financial conditions after accommodative policy actions by the Fed and the ECB. The question then becomes what might cause firms to stop hiring workers, or start firing them? Thus far, the primary economic impact of the trade war has been a loss of business confidence and delayed capital expenditures. We’ll be watching closely in the coming quarters for any sign that the industrial slowdown might spill over to broader job losses. As of today, we don’t expect to see it anytime soon. As usual, comments are welcome.