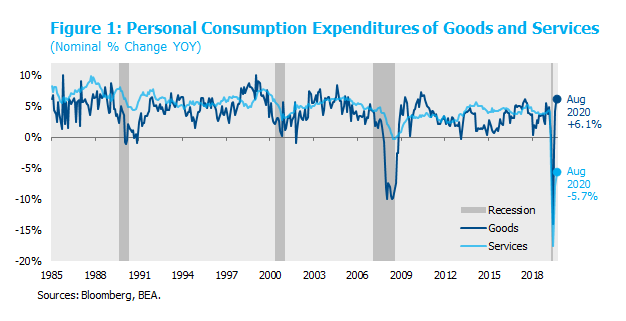
The pandemic caused a recession unlike any other in American history. We’ve previously discussed the unprecedented speed of the shock itself and the policy response. The 2020 recession is also unique in the degree to which it has impacted service sectors of the economy. Financial economists are trained to closely monitor manufacturing and goods consumption because these tend to be better cyclical indicators, despite the fact that American consumers spend more than twice as much on services as they do on goods in a typical year ($10.2 trillion and $4.5 trillion, respectively, in 2019). As shown in Figure 1, services consumption is typically more stable, serving as the ballast that smooths the business cycle against the more volatile swings in goods consumption. This stability makes intuitive sense when you consider that the largest components of services consumption are shelter and medical services, neither of which are optional. Conversely, it is easier to imagine consumers holding off on the purchase of a new car, washing machine, or golf clubs during a recession.

The 2020 recession is different. While goods consumption did decline by a record pace in April, it has already rebounded and grew in August at the fastest pace since 2011. In contrast, the public health crisis severely disrupted the services economy that relies so heavily on person-to-person interaction. Even as consumption of shelter, medical, and other essential services remained relatively stable this year, the shutdown of leisure, entertainment, and transportation services was so complete as to cause aggregate nominal service consumption to decline by a previously-unimaginable 17.6% year-over-year in April. Nominal services consumption had only previously declined year-over-year in one single month since data collection began in 1959, by a mere 0.07% in June 2009.
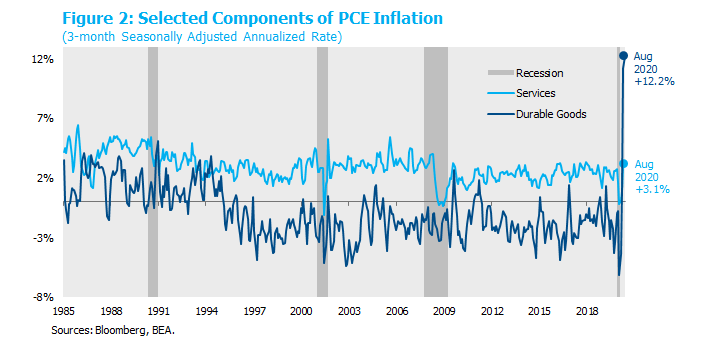
This rare structural condition demonstrates that the recovery in services consumption, which normally accounts for almost half of GDP, remains far from complete. The divergence between services and goods consumption also has profound implications for the inflation outlook. As shown in Figure 2, the pattern over the last 25 years has been persistent deflation in durable goods (thanks to globalization) more than offset by modest inflation in services (which are mostly non-tradable).

The pandemic, arguably the most volatile economic environment since the Depression, has disrupted this inflation dynamic by simultaneously injecting negative demand and supply shocks across many sectors of the economy. During the depths of the shutdown in April when the demand shock dominated across the economy, services inflation touched a 10-year low and durable goods inflation reached an all-time low. As the economy reopened in the summer months, services inflation retraced to a more normal level as supply and demand recovered to a relative balance. Durable goods inflation meanwhile skyrocketed to an all-time high as demand rebounded more quickly than supply. Consumers were receiving their stimulus checks and generous unemployment insurance benefits and sharply increased their online shopping while mostly continuing to limit their mobility. Meanwhile, the supply chain for merchandise goods continued to suffer from disruptions to both production and distribution.
We can drill down to the industry level and provide countless examples of these supply-demand dynamics. Meat prices surged by 14% between March and June as pandemic shoppers stocked their freezers while slaughterhouses closed for COVID-19 outbreaks. Prices then fell by 8% in July and August as production resumed and wholesale orders from restaurants dried up. Repeated closures of auto manufacturing plants this spring disrupted the complex supply chain for new cars. As shoppers reappeared on lots over the summer eager to spend their stimulus checks on a down payment (and borrow the rest at low rates for increasingly long terms), dealers frantically bid up the prices of used cars to restore depleted inventories. Fewer transactions occurring at higher prices is the hallmark of a negative supply shock. Prices for men’s suits have fallen by a record 16% since February as formal attire has been mothballed in favor of videoconference chic. Garment makers sitting on inventory of last season’s menswear would be happy to unload it at almost any price.
To be sure, we expect that many of these price dynamics will be transitory. Just as firms and consumers are adapting to new safety protocols, supply and demand will adjust over time to reach new equilibria. In the meantime, disruptions will continue to cause pockets of high and low inflation. One area of concern is the large number of small business closures. It’s reasonable to expect that a third or more of the restaurants in the country will close this year. When diners eventually feel comfortable eating in shared spaces again, will new entrants be able to open their doors quickly enough to satisfy demand, or will we find reservations in short supply and surviving restauranteurs utilizing their newfound pricing power to make up for 2020 losses? This dynamic will be playing out across the economy. As of this writing, we believe demand has fallen more than supply across the aggregate economy, as evidenced by core PCE inflation running below the Fed’s target at 1.6% year-over-year. Broad-based inflation is unlikely to arrive until that output gap is closed, but monitoring supply-demand and inflation dynamics at the industry and sector level has never been more important.


