In a landmark speech at the Jackson Hole conference in late August, Chairman Powell announced the first significant revision to the Fed’s operating framework since 2012. While the transition from a flexible inflation target to a flexible average inflation target might seem to be a subtle one, that may not move asset prices immediately, it does represent an important evolution in the Fed’s approach to managing the economic cycle. In this note, and another that will follow, we will discuss the motivation behind the Fed’s action and consider the implications for the inflation outlook and interest rate markets.
The Consequences of a Lower Neutral Rate
In adopting an average inflation target (AIT), the Fed is applying several lessons learned during the previous economic cycle. Chief among these is the structural decline in the neutral interest rate and the constraint it imposes on the Fed’s ability to stimulate the economy during recessions. The neutral rate is a theoretical value at which the level of interest rates set by the Fed neither stimulates nor restrains economic activity. It is not observable. It can only be estimated with models or intuition. Despite its unknowable nature, it is a vital guidepost for monetary policy. A simple playbook for central banking calls for cutting real interest rates below neutral in response to a recession and then raising above neutral if an overheating economy causes inflation or financial instability later in the business cycle. The neutral rate therefore anchors the level of short-term interest rates over time, though the central bank determines the amount of time spent above and below neutral.
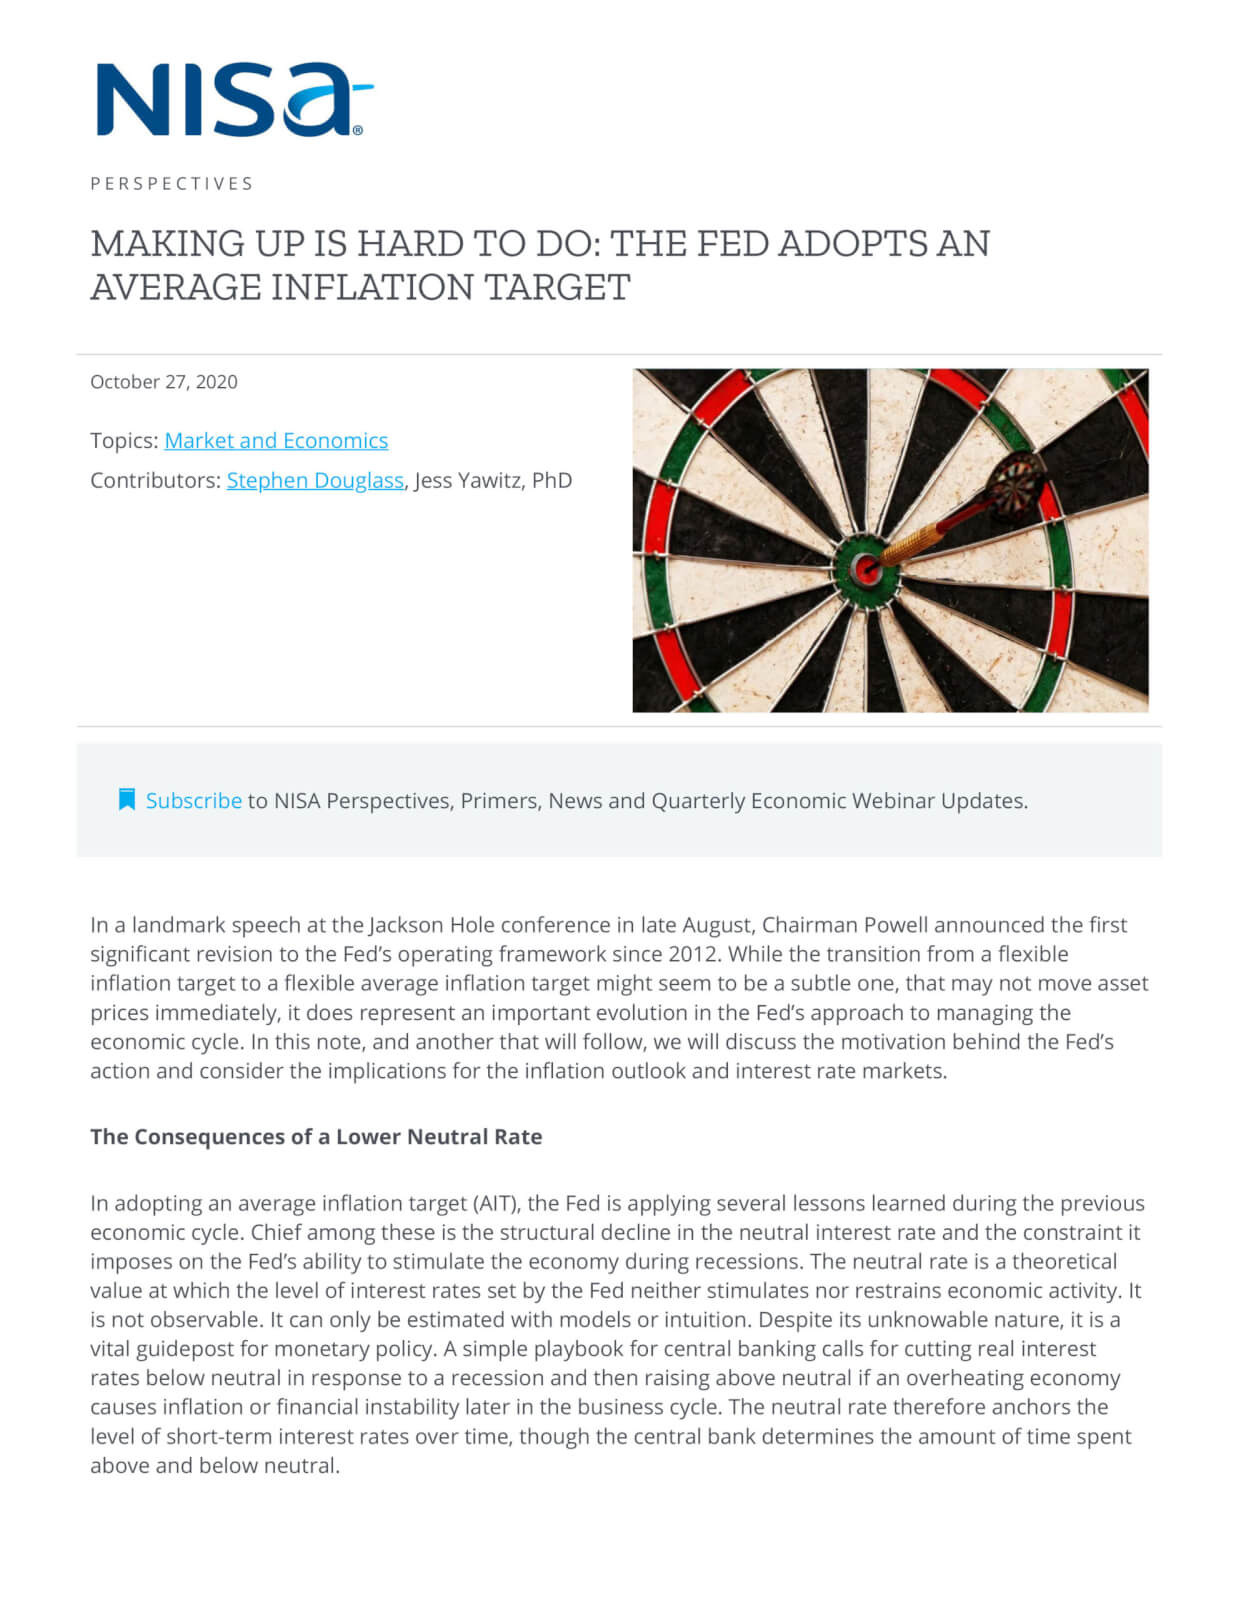
Figure 1 compares the real federal funds rate to the Fed’s preferred estimate of the real neutral rate, the Laubach-Williams model. The chart tells the history of U.S. monetary policy over the last six decades. You can see Chairman Arthur Burns setting the real policy rate too far below neutral in the early 1970s, paving the way for the double-digit inflation that followed. Chairman Volcker then had to raise the real policy rate as much as 7% above neutral to break inflation’s back, in the 1980s. This period demonstrates that the distance between the policy rate and the neutral rate determines the degree of force exerted by the stance of monetary policy. It is reasonable to expect that the strength of this monetary policy transmission mechanism will change over time as financial markets and Fed communications evolve. Such extreme policy settings have not been required since the Volcker era as macroeconomic volatility diminished during the Great Moderation. Though the range of the real policy rate has declined in recent decades, the Fed has always followed the pattern of running accommodative policy during recoveries and then hiking above neutral near the end of the expansion. Understanding this pattern is crucial to predicting the path of monetary policy and the shape of the yield curve across the cycle.
As fun as it is to take a trip down the Fed’s memory lane, the key takeaway from this chart is the decline in the real neutral rate. The Laubach-Williams model estimates that this rate has fallen by about two full percentage points since 2007 alone. We never put too much stock in a model, and it’s important to remember that the neutral rate is unobservable. The best commonsense evidence that the neutral rate has declined by a large amount is the absence of inflation or financial instability in the previous cycle. Once the Fed cuts the nominal policy rate to zero, the real policy rate is simply the negative value of inflation (0% minus the rate of inflation). When the nominal policy rate was at the zero lower bound from December 2008 to December 2015, core PCE inflation averaged 1.5% and therefore the real policy rate averaged -1.5%. If the models were wrong and the real neutral rate was in fact significantly higher, then that -1.5% real policy rate represented an extremely accommodative policy stance that would have been expected to generate signs of an overheating economy.
The Impact on Inflation Expectations
As it was, the proximity of the neutral rate to the zero lower bound limited the amount of stimulus the Fed was able to provide to the economy. Seven years of a negative real policy rate and a quadrupling of the Fed’s balance sheet were not enough to raise inflation sustainably back to the 2% target. The Fed believes they will be regularly constrained by the zero lower bound during recessions in the next few decades. If this leads to persistent undershooting of the inflation target, inflation could average less than 2% across the business cycle. If market participants come to expect that outcome, then inflation expectations themselves will drift below target. As in the extreme case of Japan, inflation expectations can fall so far that an entrenched deflationary mindset comes to permeate the consumer economy. This is the nightmare scenario that the Fed is trying to avoid. Bear in mind that the zero lower bound constraint is asymmetrical: there is no upper limit to interest rates, so the Fed would have a free hand to tighten policy as much as needed to combat high inflation (though it’s questionable whether we’d be able to find another Chairman with Volcker’s resolve).
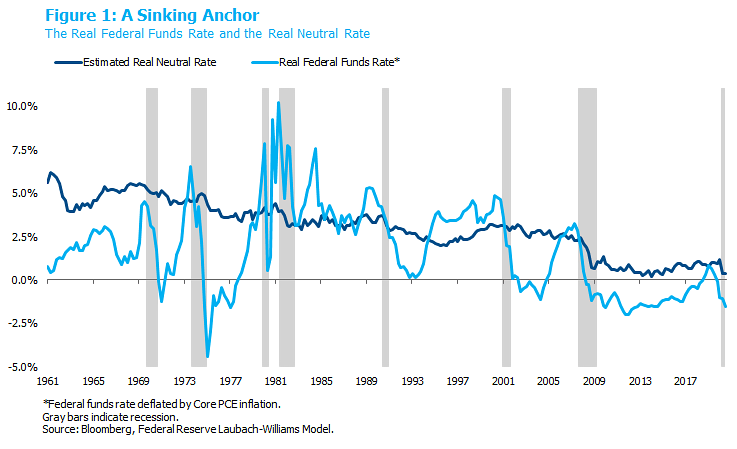
There is a reasonable debate at the Fed whether inflation expectations have already drifted below target in the U.S. As shown in Figure 2, the 5y5y forward breakeven inflation rate has shifted structurally lower by about 90 basis points since 2013. Recall that TIPS are indexed to CPI inflation, while the Fed targets PCE inflation. CPI inflation historically runs about 0.3% higher than PCE inflation, so the 5y5y breakeven at 1.75% as of October 2020 would translate to 1.45% in PCE terms. Some FOMC members have cited those figures as evidence that inflation expectations have fallen uncomfortably below the 2% target. Others on the Committee have dismissed falling break-evens as merely a decline in the inflation risk premium (a convenient scapegoat since it is also unobservable). From NISA’s perspective, a falling inflation risk premium could be a marginal factor but is unlikely to explain a significant portion of the decline in long forward break-evens. We therefore do believe that inflation expectations have drifted somewhat below the Fed’s desired level.
It’s impossible to know for sure whether low break-evens are attributable to expectations or risk premia, so the Fed would feel more comfortable if long forward break-evens were at least back above 2.3%. FOMC members have acknowledged that higher break-evens are an explicit goal of makeup strategies like AIT. Will the new framework be enough to achieve that objective? Or will entrenched disinflationary forces dominate the new communication strategy from the Fed? We’ll describe the policy in more detail and address these questions in the next post later this week.