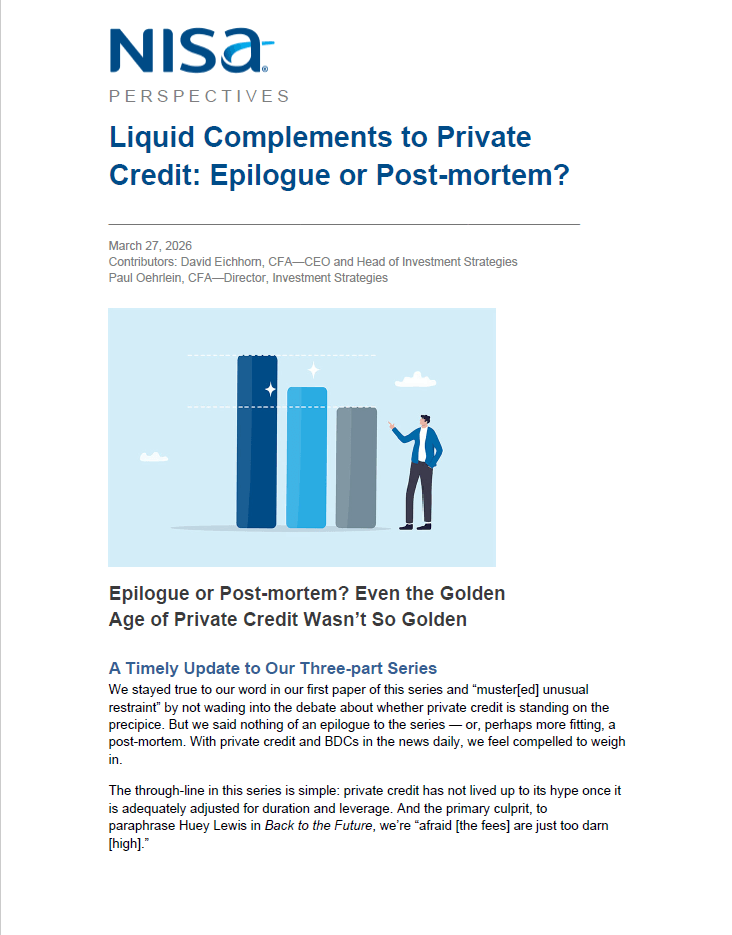
Epilogue or Post-mortem? Even the Golden Age of Private Credit Wasn’t So Golden
A Timely Update to Our Three-part Series
We stayed true to our word in our first paper of this series and “muster[ed] unusual restraint” by not wading into the debate about whether private credit is standing on the precipice. But we said nothing of an epilogue to the series — or, perhaps more fitting, a post-mortem. With private credit and BDCs in the news daily, we feel compelled to weigh in.
The through-line in this series is simple: private credit has not lived up to its hype once it is adequately adjusted for duration and leverage. And the primary culprit, to paraphrase Huey Lewis in Back to the Future, we’re “afraid [the fees] are just too darn [high].”
Comparing BDC Performance to Public Market Alternatives
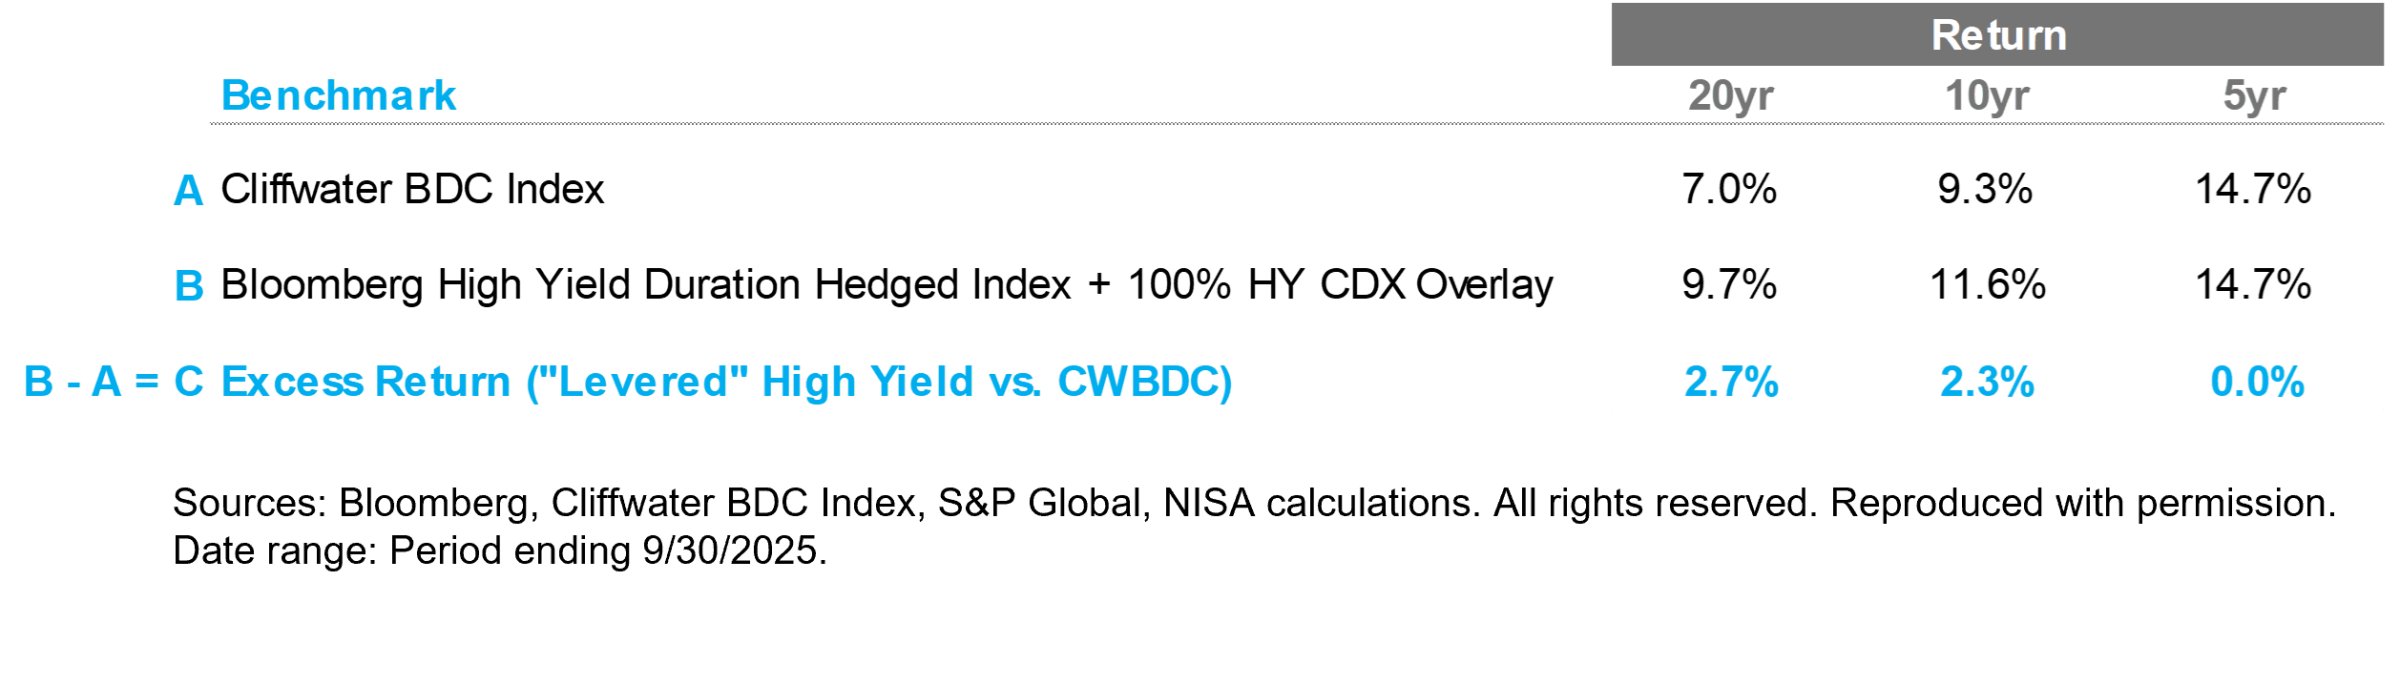
First, we reprise a table from the second paper below. While the original goal was to demonstrate the impact of expensive leverage in private credit funds and BDCs, it also reveals an inconvenient truth for the private credit world more broadly. Specifically, investments in public market securities with comparable credit quality and comparable structural leverage (i.e., a passive high-yield portfolio plus one turn of HY CDX) have trounced private credit markets, as measured by BDCs, over the last 20 years.
Estimated Excess Return of Levered High Yield Relative to BDCs|Period Ending 9/30/2025
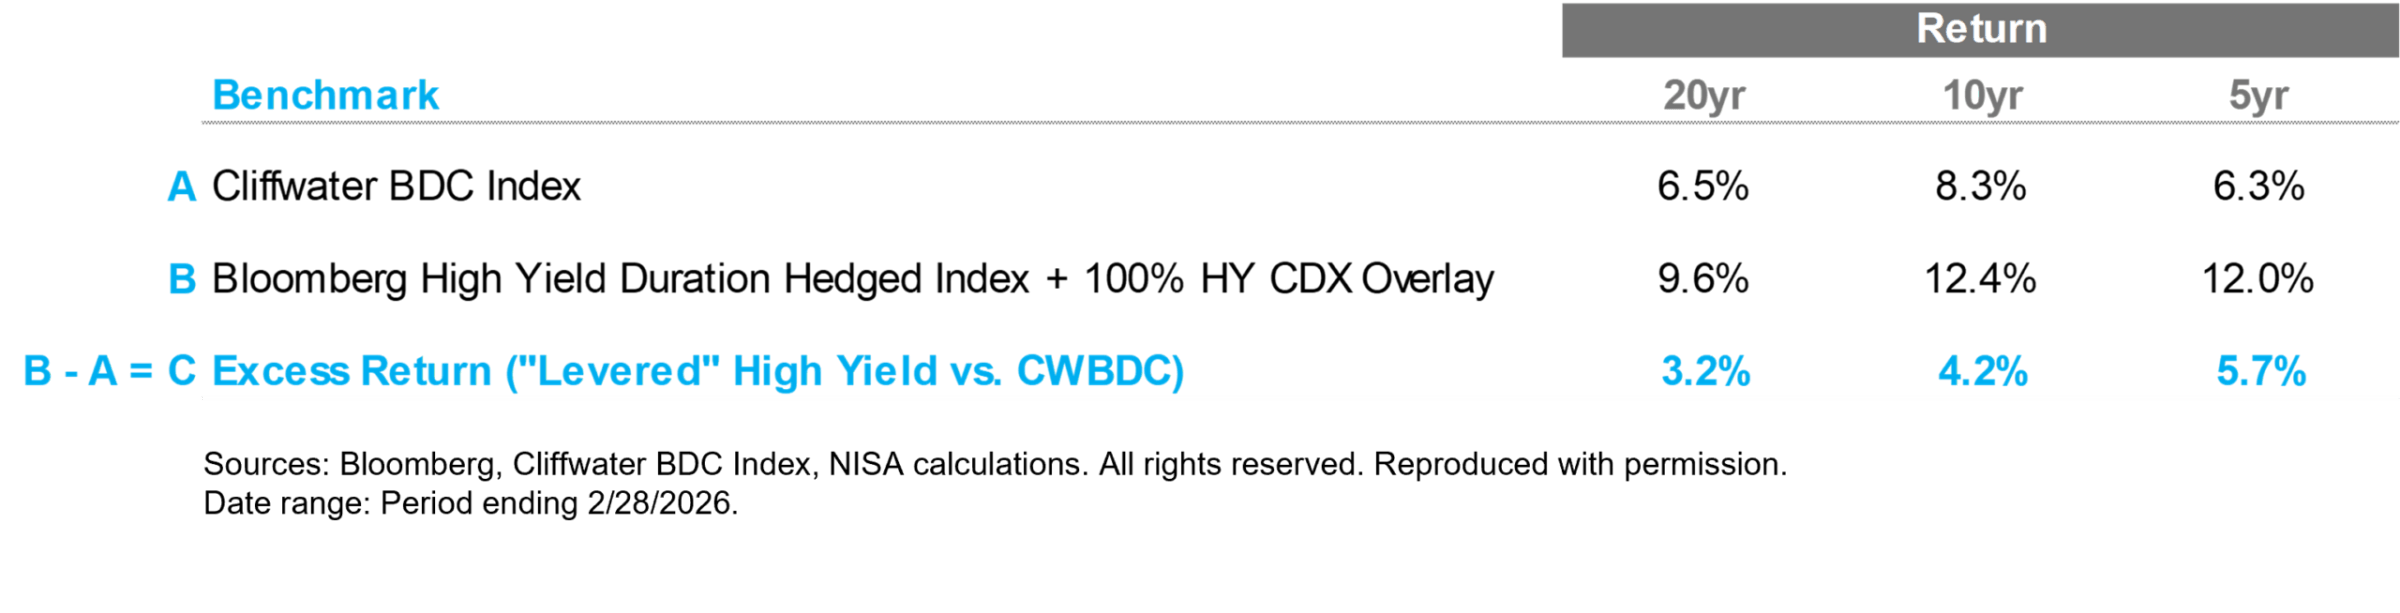
Importantly, since we were comparing traded instruments against private loans that have long lags on being — to say it generously — re-priced, the prior table used data only through 9/30/2025. While cracks were beginning to show then, by today’s standards, 9/30/2025 was indeed the golden age of private credit. Given BDCs’ poor performance over the last few months, updating these results through 2/28/2026 further widens the public market outperformance gap to 3.2%, 4.2%, and 5.7% over the last 20, 10 and 5 years, respectively!
Estimated Excess Return of Levered High Yield Relative to BDCs|Period Ending 2/28/2026
 Of course, the anti-marked-to-market crowd would say these results paint BDC performance unfairly, unduly harmed by current “marks.” With BDCs trading at an average discount to NAV of ~20%, these results are indeed impacted.[1] But private credit results, as proxied by BDCs, have never been particularly impressive. Even looking at the same analysis as of 12/31/2024, our liquid market alternative still outperforms materially over longer horizons.
Estimated Excess Return of Levered High Yield Relative to BDCs|Period Ending 12/31/2024
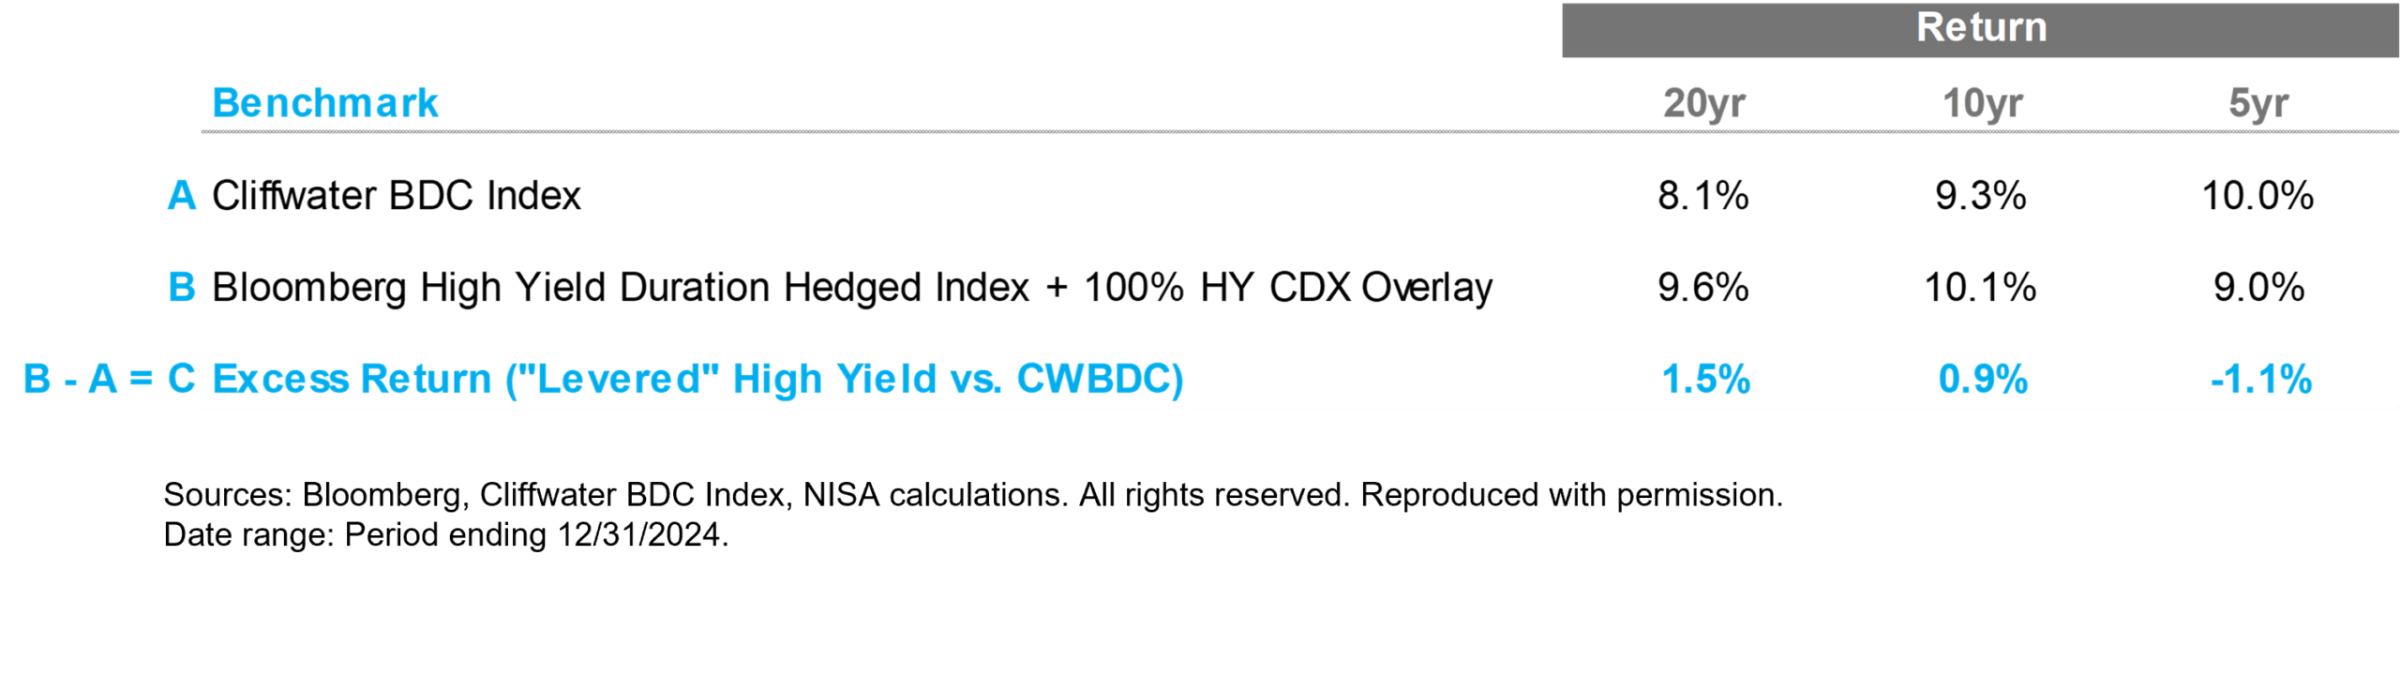
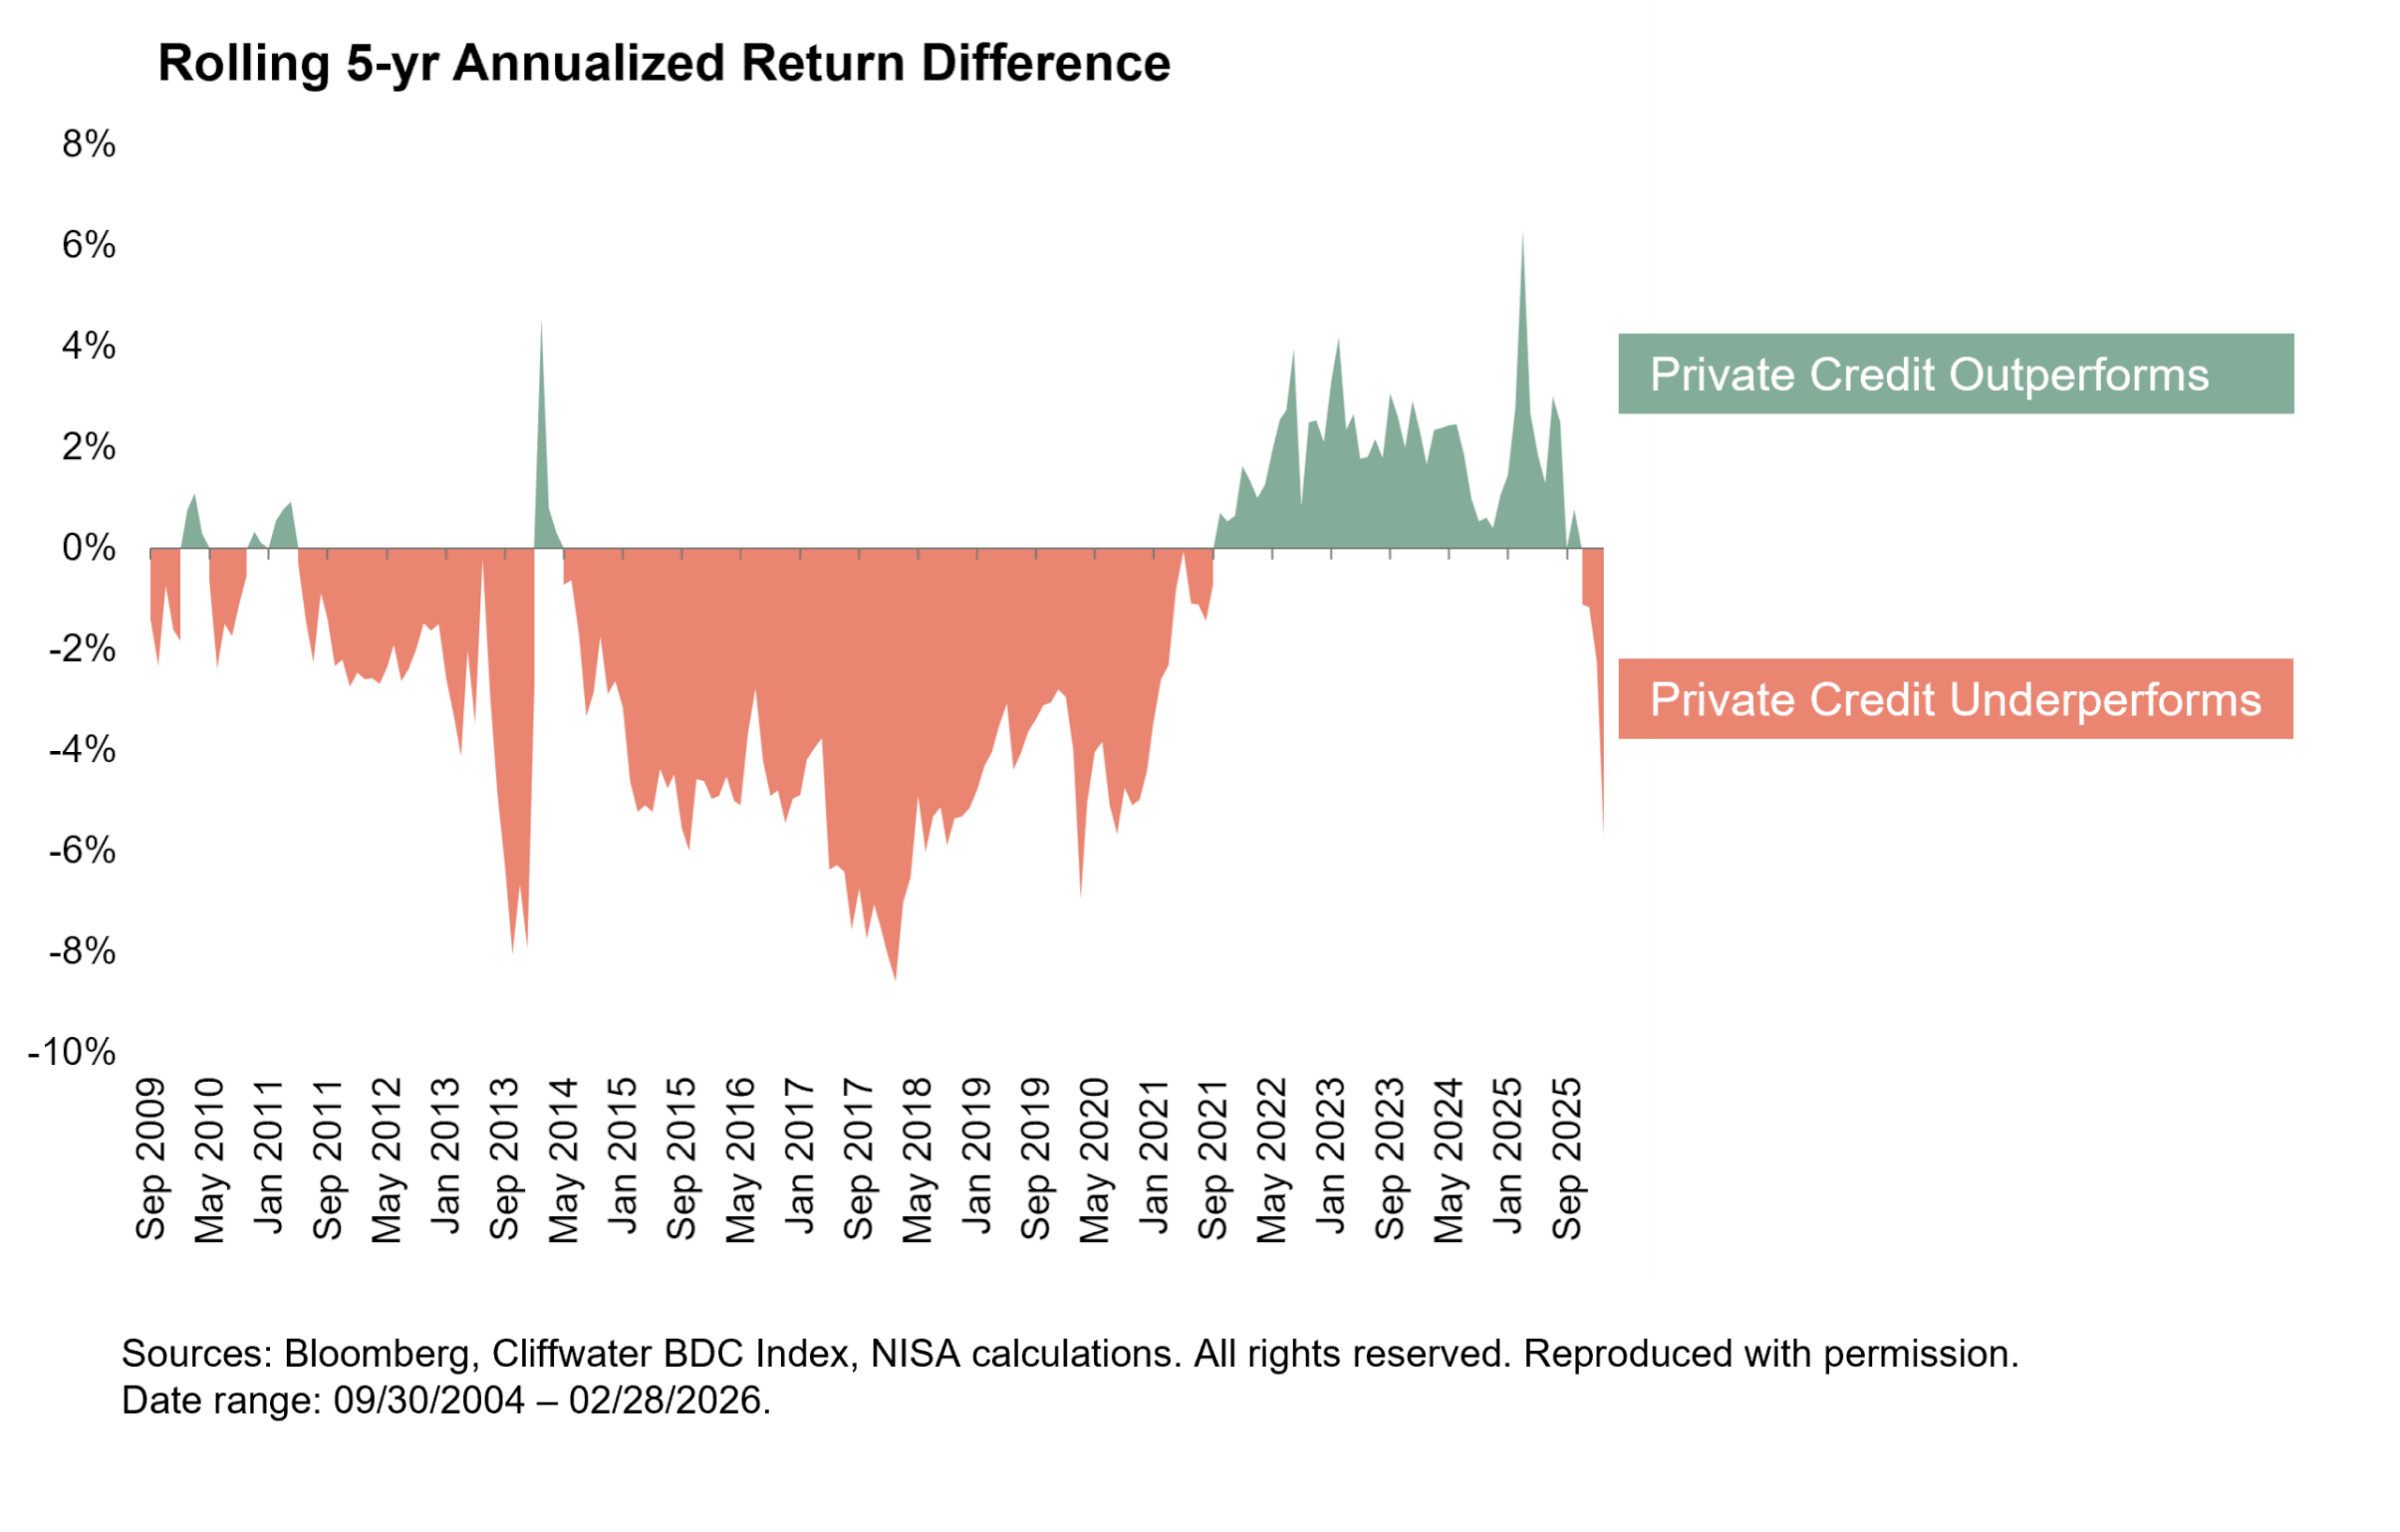
Importantly, the average discount on BDCs at that time was approximately 4% — below long-term averages — making this a fair comparison period. For completeness, the chart below shows five-year rolling performance for BDCs relative to our liquid market proxy. In the vast majority of periods, BDCs underperform.[2]
We recognize this assessment may not align with many investors’ worldview of private credit. And given the near-religious status it has taken on within investing circles recently, we anticipate some will disagree with our conclusions. Accordingly, let’s address two natural retorts.
Are BDCs Representative of Private Credit?
Throughout this series, we have used BDCs or the underlying loans within BDCs for our analysis. BDCs provide the most transparent window into middle-market direct lending—the largest segment of private credit. Further, the overlap in loans between BDCs and private vehicles, as much as 43% by some estimates, further demonstrates why BDCs are a readily observable measure of private credit performance.[3]
Despite this material overlap in underlying loans, one natural objection could be that BDCs’ retail nature inherently makes them a poor proxy for institutional credit[4]. But it is worth noting that the largest private credit managers operate publicly traded BDCs as core components of their platforms. To the extent one might argue that BDCs are an unfair or unrepresentative proxy for private credit, this raises an uncomfortable question: are these managers placing inferior assets in their retail vehicles, or are BDCs, in fact, representative of the broader asset class? The question becomes even more pointed given the industry’s aggressive push to expand retail access to private credit through 401(k) plans, interval funds and semi-liquid structures — vehicles that, structurally, look an awful lot like BDCs. Accordingly, one cannot simultaneously dismiss BDCs as unrepresentative and lobby to put more investor capital into BDC-like products on the grounds of private credit’s merits as an asset class.
Is This Liquid, Public Market Alternative a Genuinely Investable Strategy?
A natural objection to the proposed CDX overlay is that it requires margin support, potentially forcing liquidation during periods of market stress. Similar to the approach we took in Part 2 of this series, we estimate that a conservative implementation — investing only 80% in high yield bonds, holding 20% in cash for margin, and running 120% CDX notional — would have returned 10%, 12.4% and 12.3% over the last 20, 10, and 5 years, respectively. Even with this liquidity buffer, the strategy comfortably outperforms BDCs over all horizons. In short, one can be conservative with the margin management and still come out well ahead.
Now, About Those Fees…
[5] The analysis above makes clear that this fee structure is far too high — perhaps as much as two times too high. Even if we charitably decide to use data only through 12/31/2024, managers would have needed to reduce their fees by at least ~200 bps for investors to have been meaningfully better off in private credit than in the liquid alternative (~+50 bps). And this, of course, doesn’t adjust for the fact that the liquid alternative is, well, liquid.
It is hard to understand why the fee compression seen across all of asset management has only modestly impacted private credit.[6] Our best guess is that the remarkably benign credit markets in which this asset class has largely lived, combined with the lack of readily comparable public market benchmarks, have allowed managers to extract all — or more — of the economic rents inherent to the asset class. Regarding the former, we have no particular insight into whether this benign environment is coming to an end before our eyes. But we do hope this series has helped investors with the latter challenge.
Conclusion
We appreciate the readers who stayed with us for this series and its epilogue. As we wrap up, here are our key takeaways.
- Private credit loans offer an attractive illiquidity premium. After adjusting for duration, leverage and pricing convention differences, we find that private credit loans provide a meaningful excess return over comparable credit quality indices (e.g., high yield), approximately 3% over the last 20 years.
- A strikingly large proportion of this premium accrues to the manager, not the asset owner. We estimate a net-of-fee, realized illiquidity premium of only 0.6% over the last 20 years. Accordingly, ~80% of this premium is lost to management fees.
- Fund-level leverage is expensive. Many private credit vehicles utilize fund-level leverage of approximately one turn. The borrowing cost — often SOFR + 150 to 250 bps — when combined with management and incentive fees, absorbs 50–80% of gross spreads before default losses.
- More efficient sources of leverage are available. Investors can increase returns by utilizing lower-cost forms of leverage, such as HY CDX, to capture the illiquidity premium without incurring unnecessary costs.
- Public market alternatives have actually outperformed private credit investments. A portfolio of high-yield securities and HY CDX has outperformed private credit, as measured by BDCs, by more than 3% annualized over the last 20 years. Importantly, this is not simply the result of recent BDC weakness. Even as of year-end 2024, the liquid alternative in our analysis outperformed by 1.5%.
[1] Anyone arguing that current marks are unfair, rather than complaining, should simply buy the public BDCs at a discount and take advantage of the opportunity. Additionally, investors should redeem every dollar they can at NAV from private credit funds and, if they like the asset class, reinvest that capital in public BDCs trading at significant discounts. It’s surprising to us that redemption requests from private BDCs haven’t been even higher.
[2] The only notable exception to this statement is the period subsequent to the COVID pandemic. Much of the outperformance of BDCs can be attributed to interest rate movements. While it is hard to estimate precisely, BDCs’ structural leverage results in a short position in interest rates. As rates moved up ~400 bps, this structural short explains half or more of the overperformance during this period. Attributing this interest rate-related performance to private credit would be quite charitable. In fairness, part of the outperformance of the private credit loans over this period was compositional – an overweight to technology and software relative to the public markets. We will see how that works out going forward.
[3] Jang, Y. S. (2025). “Are direct lenders more like banks or arm’s-length investors?”
[4] A common criticism we have seen is the marked-to-market nature of BDCs. We, of course, believe this is a feature, not a bug, of public market instruments. After all, an investor never needs to sell their shares of a BDC. But having the option to do so seems inherently valuable. Either way, we hope that if this series accomplished one thing, it was to show how to make fair comparisons between non-traded private credit vehicles, BDCs and public-market instruments.
[5] Cliffwater provides a useful summary of private credit fees in their March 2025 article “No Fee Compression in Private Debt.”
[6] Though this does seem to be beginning to change.