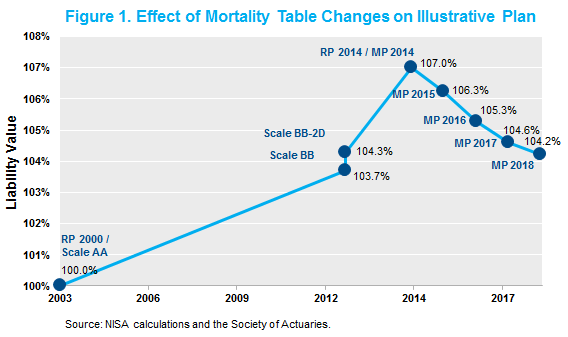
Perhaps it would have been more fitting if the Society of Actuaries published their updated pension mortality improvement scale, MP-2018, on February 2. (For readers unfamiliar with the 1993 movie, Phil (Bill Murray) is stuck in a time loop, reliving one particular day – Groundhog Day.) By our estimates, the updated tables reduce the typical pension plan liability by about 0.4%. MP-2018 is a repeat of the prior three year’s downward trend that has cumulatively reduced pension liabilities by approximately 3%, with the zenith of longevity optimism occurring with the release of MP-2014.
We recently presented a version of the chart below (Figure 1) at the 2018 P&I Risk Strategies conference. The chart shows the impact of recent updates to the pension mortality improvement scale through MP-2018.
This most recent update provides an opportunity to reiterate two key points when thinking about longevity risk, and adds one additional thought to ponder.
- Do not confuse the mean with the variance. The average increase in the life span of pensioners is not longevity risk – it is in fact expected. We need to measure the risk around our baseline estimate in expected longevity improvements. We believe this risk to be modest.
- Longevity risk is symmetric. Or, at least there is no reason to believe there is any meaningful asymmetry. Once we adequately account for the trend improvement (point #1), this becomes quite apparent. The recent updates provide a good example of downside risk to longevity (or upside risk to pension funded status).
- Despite the last point, the last four updates have been revisions downward. Does this suggest a trend in the trend updates? That is too hard to say, but 4 draws on one side of the distribution sounds like a 1 in 16 event – that is unless there is a bias at work here.
None of these points should be construed as an argument against hedging longevity risk. Rather, given the size of the risk, we believe a plan should not pay much for such a hedge (or ideally, be paid.) Accordingly, we are ardent supporters of the development of a longevity swap market in the U.S. Unfortunately, in our (limited) attempts to procure such hedges, the costs were not justified relative to the magnitude of the risks.
One related point for plans that are considering a pension buyout: it is important to revisit the mortality assumptions being used in the economic evaluation. Namely, such assumptions may be stale or not relevant for the demographic group being evaluated. To underscore this fact, we point to the following comment in the SOA’s release:
“In MP-2018, we see continued reduction of overall U.S. mortality improvement trends that we started seeing in 2010,” said Dale Hall, Managing Director of Research for the SOA. “However, because we are also continuing to see varied mortality improvement across the age groups, it’s imperative for industry professionals to perform their own calculations, using the demographics of their pension population to determine the impact of implementing MP-2018 on their individual plan.”
We found this comment very interesting and consistent with another recent post of ours. The “varied” nature of mortality improvement seems consistent with a growing range of life expectancy. We think this is a particularly important point for plans considering small balance buyouts, as we recently pointed out.