Small balance annuity buyouts have been increasingly popular in the last few years – and for good reason. Given the fixed PBGC premium1 charged per participant, these participants represent the most costly balances for a sponsor to carry2. NISA’s position on annuity purchases has long been that they are better suited to serve cost management objectives than risk management objectives. Accordingly, we see the positive role small balance buyouts can play for sponsors.
One nagging concern of ours, however, has been the potential bias embedded in the mortality assumptions of the sub-group sold to the insurer. Said differently, are small balance participants less healthy and likely to live shorter than their counterparts with higher benefit amounts? For example, it is an indisputable, albeit disheartening, truth that income levels correlate highly with longevity. Specifically, lower income predicts lower life expectancy, and vice versa3. Our suspicion has been that lower balance participants may also be lower income households. Naturally, not every participant with a small balance in a DB plan will be low income; the participant could have simply moved employers after a short stint but otherwise had strong earnings throughout her career. Nevertheless, it stands to reason that on average, a lower pension benefit suggests lower income. If this relationship does exist, then we would expect to see low balance participants have lower life expectancy. We recently saw some data that helped corroborate that suspicion – and quantify the potentially large dollar impact on the “fair” value of the transaction.
The following figure is from a brief report produced by Club Vita, a UK-based provider of longevity risk informatics. They begin with a prototypical liability, split into 5 groups that represent equal present value, sorted by smallest to largest underlying benefit. They then cleverly use the fact that where someone lives (UK postcode) says much about her socioeconomic and health circumstances – and therefore life expectancy. Using this relationship, they can effectively re-underwrite each individual in the plan more accurately by factoring in their postcode.
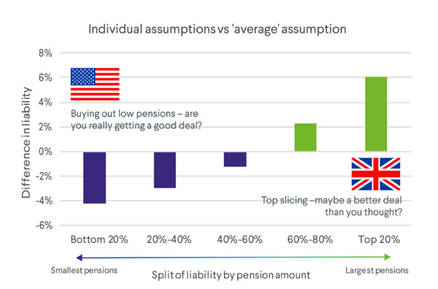
Source: Club Vita, Top Charts Issue 7: Balancing value and risk when insuring sub-groups of pensioners.
The results are quite striking – after refining for more granular mortality assumptions, the small balance liability quintile falls by approximately 4% vs. the valuation if the “average” mortality assumption for the entire participant pool were applied. Perhaps more striking is that the small balance quintile of the liability is approximately 10% lower than the large balance quintile of the liability. While it may be quite reasonable to measure the liability value of the entire participant base using an average mortality assumption, we see that there is up to a 10% error in liability valuation for sub-groups of the participants. Since small balance annuity transactions are often executed on the smallest 5-10% of the overall liability value, it is reasonable to conclude the bias in a typical transaction is even larger than the 4%+ shown here. To put this into numbers, if a $10b plan sold $1b of liabilities with the smallest benefits, these data suggest that the impact of more precise mortality assumptions is that the sold liabilities were really only worth $960mm – a pricing difference of $40mm!
To be clear, we don’t believe these data refute the role small balance buyouts can play as a cost management tool for sponsors. However, we do think this result helps sponsors to have a sense of an appropriate fair value for a transaction (i.e., meaningfully lower than the typical accounting based measure of liability value). It may also suggest that sponsors should ask their pension actuary to re-value the liability that is being sold, based on mortality assumptions that are more reflective of the cohort’s demographics. Likewise, the sponsor may also need to re-evaluate the longevity assumptions for the participants that are not sold to obtain a more accurate (presumably larger) assessment of the remaining liability value.
1For plan year 2019, the PBGC fixed rate premium is $80 per person, indexed for inflation. Source: PBGC.
2For example, for a 60-year-old female who will retire at 65 with a $250 monthly benefit, the annual PBGC fixed rate premium is 0.25% of the value of her pension. Source: NISA estimates.
3JAMA Internal Medicine estimates correlation between income/poverty levels of 0.6-0.7. Source: Dwyer-Lindgren L, Bertozzi-Villa A, Stubbs RW, et al. Inequalities in Life Expectancy Among US Counties, 1980 to 2014 Temporal Trends and Key Drivers. JAMA Intern Med. 2017;177(7):1003-1011. doi:10.1001/jamainternmed.2017.0918.