Can rates in the U.S. only go up from here?
With Treasury yields reaching historical lows recently, it may be tempting to think of U.S. rates as having hit a floor. Yet before making tactical adjustments, it may be prudent to examine rates not just in absolute but in relative terms. Doing so suggests rates may not be as low as they appear.
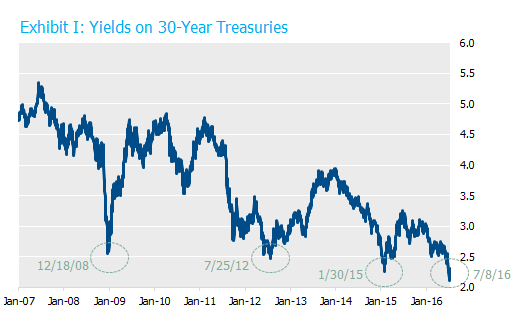
Yields on 30-year Treasuries over the past decade illustrate the story. Treasury yields have had a generally downward trajectory since their peak in 2007. We’ve highlighted four periods below when rates touched new lows: December 2008 at the height of the financial crisis, July 2012 during the first bout of the European debt crisis, the end of January 2015 after oil and other commodities slumped, and July 2016 in the aftermath of the Brexit vote.

Source: Bloomberg and Barclays.
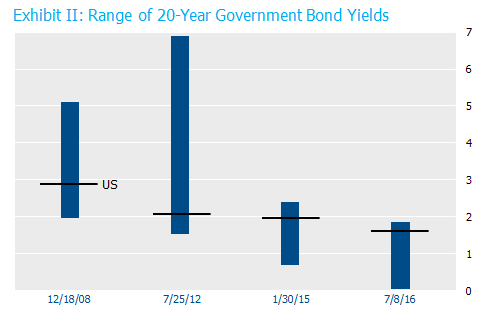
With global markets, however, it’s critical not to evaluate investments in isolation. We’ve compared yields on 20-year Treasuries with those on 20-year sovereign bonds from the other members of the G-7: Germany, the United Kingdom, France, Italy, Canada, and Japan. The upshot is that when Treasuries were hitting record lows in 2008, 2012, and 2015, in relative terms they were actually in the middle or low end of the pack.
 Source: Bloomberg.
The downward march in global rates is apparent in the progressively lower ranges of yields, but the most interesting takeaway is the relative position of Treasuries. In 2008 and 2012, Treasuries fell toward the bottom of developed sovereign yields. In both 2015 and July 2016, however, Treasuries were near the top—meaning, Treasuries had higher yields than their peers.
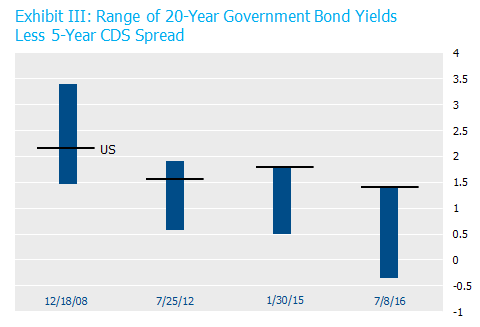
Now, for a truly apples-to-apples comparison, it is necessary to remove the credit risk portion of sovereign yields. Investors generally consider the U.S. government ostensibly risk-free, while other countries (particularly Italy in this group of developed borrowers) have at times had a material level of default risk baked into their yields. To arrive at a cleaner analysis, we’ve subtracted the spread on 5-year sovereign credit default swaps from 20-year government bond yields (note that this is a bit of a hack as these are the longest tenor CDS that are regularly traded).
 Source: Bloomberg. Note that U.S. CDS spreads have been used as a proxy for Canadian 5-Year CDS, which do not trade.
Controlling for credit risk, the story is a little clearer. While in 2008 Treasuries represented the midpoint sovereign yields out of this group, by July 2012 Treasuries had risen toward the top, and by January 2015 and July 2016 they had taken pole position. By this metric, Treasury yields look high relative to their peers, regardless of their absolute level.
There are many drivers of global rates (e.g. local growth and inflation expectations, capital flows, etc.) that contribute to the current rate landscape. Accordingly, U.S. Treasuries residing at the high end of comparable global rates does not necessarily imply they are relatively attractive. But viewing U.S. rates through this global lens does provide a backdrop that is useful in assessing possible future movements, particularly if the U.S. economy is pulled into the morass of the global economic scene.


