

Introduction
Fixed income markets globally are worth approximately $120T, with millions of securities to pick from. Additionally, there are a multitude of derivative instruments and structured products. These markets offer many times more opportunities for outperformance compared to equities – by comparison MSCI-World has less than 2,000 tickers. Plus, active fixed income managers take a myriad of different approaches, including credit tilts, sector rotation, duration timing, out-of-benchmark positions and security selection.
In this piece, we explore the value of various alpha sources, the ease of generating them and their persistence.
Choices, Choices
There are many choices managers can make in an attempt to outperform their chosen benchmark, which generally fall under three categories: tilt, time or security selection. For our purposes, we will use the example of a core intermediate bond manager, benchmarked to the Bloomberg U.S. Aggregate Index, which contains more than 13,000 securities as of writing.
Tilting market exposures could involve a persistent overweight exposure to credit, which may be implemented by being long corporates versus government bonds, having a longer spread duration allocation than the index, or having a lower credit quality than the index. But tilting is a little sneaky…it’s introducing beta via the back door. As our prior paper “Strengthen Your Core” noted, the effective credit overweight that core managers have reduces the diversification benefit of fixed income, especially during large equity drawdowns. If asset owners want more credit exposure (which behaves a lot like equities in those drawdowns), they should make that intentional decision in their strategic asset allocation, rather than allowing their active managers to earn active fees from passive beta overweights.
Timing involves tactical directional views on positioning around the level of bond yields or credit spreads. It’s nice when it works, but it’s difficult to do well consistently. In fact, there is no evidence that it is any easier to do successfully than timing equity markets. Additionally, a manager that is tactically long credit risk or perhaps tactically short duration during an equity drawdown will have the same negative impact on diversification as a manager that is persistently tilted long.
Security selection in its purest sense involves expressing views on, for example, bonds of the same issuer or bonds of issuers within the same industry. Most managers usually do this within the credit sector, though some (including NISA) also aim to do this within securitized and government sectors. Care does have to be taken, however, to ensure that beta exposures (intentional or not) don’t creep in and offset the security selection view, e.g., substituting in a lower quality, higher yielding issuer.
U.S. Aggregate vs. U.S. Credit Managers[1]
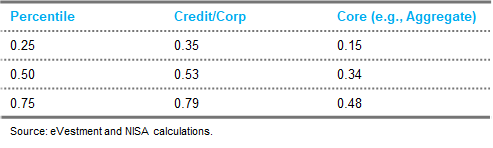
A core U.S. Aggregate manager focused largely on sectors within the index can tilt, time and select. They may also allocate limited risk to out-of-benchmark sectors, such as high yield, non-agency mortgages and non-U.S. bonds. U.S. credit managers, on the other hand, typically stick to bottom-up security selection. There may be a temptation to tilt to being persistently long credit “beta,” but this should be quite visible to most asset owners (and easier to measure) than for a multi-sector U.S. Aggregate assignment. With a lot more levers available to U.S. Aggregate managers you might expect superior performance compared to U.S. credit managers. As Figure 1 demonstrates, the data indicates that is not the case. The histogram is a distribution of risk-adjusted returns (information ratios) for these two categories of active management. Not only do credit managers have a significantly higher information ratio on average (median 0.53 vs. 0.34), the distribution is significantly skewed to the right.
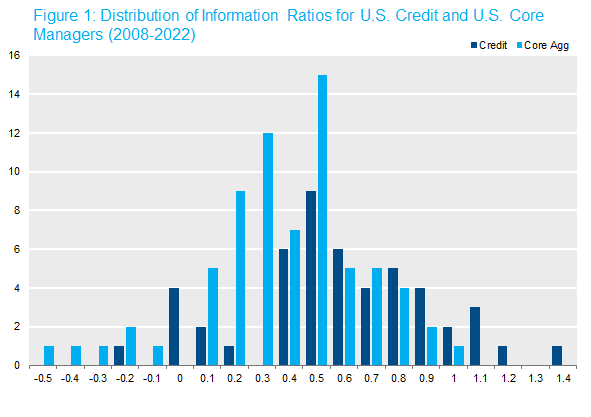
Hmmm. What gives? Are U.S. credit managers better? Is credit less efficient? Is security selection a better way to add value?
To begin to answer these questions, we will start with the truism that alpha derives from skill in forecasting. A typical U.S. Aggregate manager may make quite a number of forecasts, often a combination of top-down views on the economy and bottom-up views on individual sectors or industries. A top-down view, for example that the Fed’s tightening cycle is finished, may be expressed in a number of ways in a portfolio, such as long duration, curve steepener, long credit spreads, long financials within credit, etc. The return to that view will be dependent on whether the market is at peak Fed Funds, of course, but also on the correlation between the view and the exposures (long duration, etc.) expressed in the portfolio. But it is still only one view.
Bottom-up views at the issuer or security level within the corporate sector have a much larger number of degrees of freedom. While the movement of financials vs. industrials may be impacted by Fed policy, the performance of, say Bristol Myers vs. Pfizer, is not likely to be. With more than 1,000 issuers in the Bloomberg Full Credit Index, there are many opportunities to express independent views.
How do the differences between top-down and bottom-up views translate directly into information ratios? The Fundamental Law of Active Management (FLAM) described by Grinold & Kahnh[2] provides a helpful framework. According to the FLAM, the information ratio is a function of Skill and Breadth:
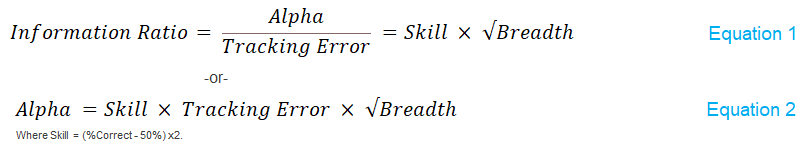
Equation 2 perhaps provides a little more intuition. It states that alpha derives from skillfully allocating risk across a broad number of independent views.
Back to our Aggregate manager example: a Fed view expressed across level of rates, curve and the direction of credit spreads is one view (breadth =1). In equation 2, let’s say you have a crystal ball that successfully predicts Fed policy and the correlation[3] of that view with markets is also 1, then the alpha will be driven by the amount of risk allocated to that view. It doesn’t matter whether that view was expressed in rates, credit spreads or anywhere else, it’s one view.
The 1,000-plus issuers in the investment grade credit index provide potentially much greater breadth because they offer the ability to express views that are largely independent of each other. The key to a high degree of breadth in security selection is independence. If two trades are highly correlated, for example being overweight Bank of America as well as J.P. Morgan (and neutral all other banks), then the breadth will be reduced by the degree of that correlation. In this example, most of the return will be driven by the performance of banks compared to other sectors rather than the relative performance of BAC vs. JPM[4]. On the other hand, an overweight position in one bank offset by a risk-weighted underweight position in the other bank will have greater breadth (in the limit, as high as 2).
So much for breadth. How about skill? In the formulation of the FLAM expressed above, skill is the percentage of times your view is correct less the percentage of times it is incorrect. If your views are as correct as tossing a coin (50%), then your skill level is zero and the FLAM tells us the alpha will also be zero. On the other hand, if you get it right 60% of the time, then your skill level would be 0.20. What is a reasonable expectation for skill? It has been suggested[5] that a skill level of 0.10 (i.e., right 55% of the time) is very good and a level of 0.15 world class.
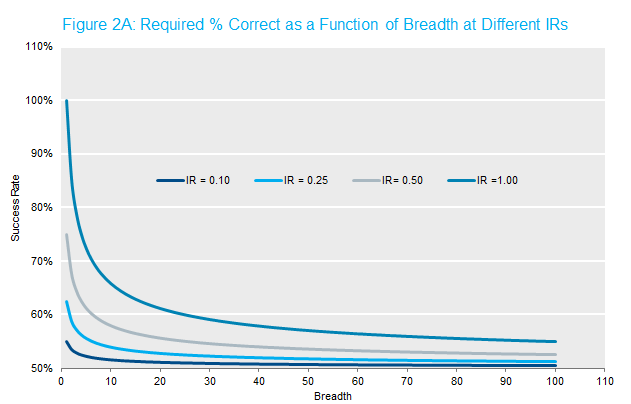
In asset management an information ratio (IR) of 0.50 is generally viewed as very respectable, frequently sufficient for a manager to land close to the top decile of peer group performance. An information ratio of 1 or above places you in yet more rarified company. The FLAM suggests that you can attain that through a mix of skill and breadth. Figure 2A shows how much skill is required to generate a target IR above 1 at a given breadth. If we assume that a skill level of 0.10 is attainable, we can calculate that the required breadth is a minimum of 100. While possible for a top-down manager, timing credit spreads, or for that matter bond yields, is notoriously challenging. Getting those views right 60% of the time seems to be at the outside of what could reasonably be expected. To express 100 independent views per year on rates or spreads would seem to be an impossibility, e.g., is your rate view on Monday predicated on the Fed going to be uncorrelated with your view on Thursday? As such, our target IR of 1 for a pure top-down manager seems almost out of reach.
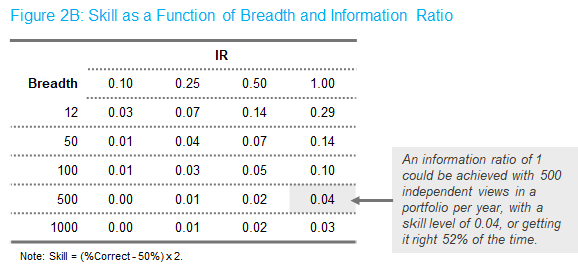
On the other hand, a bottom-up manager focused just on security selection may be able to express hundreds or even thousands of independent views in a given year. Figure 2B suggests that an information ratio of 1 could be achieved with 500 independent views in a portfolio per year, with a skill level of 0.04, or getting it right 52% of the time. This might be achieved through security selection, e.g., having 250 independent issuer views and turning over the portfolio twice a year.
In reality, almost all active managers mix top-down and bottom-up views in portfolios. Since bottom-up views are typically between issuers within the same industry (in credit) or between securities of the same issuer (all sectors), they tend to be low volatility. As equation 2 reminds us, if you want high alpha, you need some skill and breadth is great, but you need tracking error too! It’s difficult to get lots of tracking error in security selection alone in the context of a long-only investment grade portfolio. Once you are maxed out on security selection positioning and need more alpha, you have to add (lower information ratio) beta tilts and/or top-down views. But as Figure 1 suggests, core Aggregate managers are either less good at security selection than credit managers or are allocating a significant amount of risk to lower IR top-down views. Instead, an asset owner may consider targeting high IR strategies in their core allocations and coupling that with an unconstrained macro mandate (in place of top-down fixed income) to increase breadth.[6]
Conclusion
There are multiple ways to outperform a benchmark. As we (and others) have shown in prior papers, there has been a significant beta tilt to credit embedded in most core portfolios, which has caused underperformance on average for core managers during equity drawdowns[7]. Unfortunately, that credit overweight has tended to swamp any value-add from other sources. Managers that attempt to time beta – either rates or spreads – may amplify or dampen that underperformance depending on positioning. The one saving grace for beta tilts and beta timing is risk. If you take big bets and you have even a little bit of skill, you may be able to generate higher alpha simply because you can take more risk than is reasonably possible in security selection. Higher alpha – yes, but not a higher IR. There will be a role for such strategies in some portfolios, but it may not be most appropriate for a core allocation.
Security selection, if done properly, e.g., without simply owning higher yielding securities, may be able to deliver a higher information ratio more dependably than top-down beta timing. This makes security selection a vital component in a strong core investment portfolio.
[1] Investment Manager data referenced throughout this publication is from eVestment. There are shortcomings to using databases, including limitations on inclusiveness and survivorship bias. The benchmark identified in the eVestment Analytics database is selected by the product’s investment manager and may not be indicative of the true product benchmark. The analysis is based on data from 01/01/2008 through 6/30/2023. To be included in this analysis, product data had to meet the following criteria: 1) be a member of the U.S. Credit Universe, 2) have a continuous track record since 2008, and 3) for products of the same manager, have a correlation below 0.95 for the outperformance. The above criteria resulted in 50 different credit/corporate products and 71 different core products, including NISA’s products in each category. All manager returns were reported on a net-of-fee basis. Neither NISA nor eVestment guarantee or warrant the accuracy, timeliness or completeness of the information provided by eVestment and are not responsible for any errors or omissions with respect to such information. NISA pays eVestment Analytics a standard fee for access to manager data.
[2] “Active Management,” Richard Grinold & Ron Kahn, McGraw Hill.
[3] Later formulations of the FLAM, described by Clarke et al, include a “Transfer Coefficient” which measures the correlation between the return in a given market/instrument and your view.
[4] This assumes that the overweight to banks in this example is offset by an underweight exposure to some other credit sector. Otherwise, the breadth will be further reduced, as the correlation is driven both by the performance of credit spreads overall, as well as the relative performance of banks.
[5] Grinold & Kahn.
[6] In footnote 3, we referenced the “Transfer Coefficient,” which reflects portfolio constraints. A top-down Aggregate fixed income manager generally faces more portfolio constraints, e.g., market selection, leverage, shorting etc., that an unconstrained manager typically faces. Fewer constraints equal a higher T.C., and in the case of Unconstrained, more breadth, both of which should lead to a higher information ratio.
[7] “Strengthen Your Core,” July 2023, Ratkowski, NISA.
