We, along with all market participants, have been watching short rates increase ~500 bps over the past two years. While we all understand why, the well-debated questions remain: How will this rate environment impact investor portfolios? What will break first and how?
One facet of the market that may be surprisingly unimpacted by rising rates is the derivatives market. However, a fair question on top of many investors’ minds is: Since higher rates translate to higher derivative financing rates, does this imply a lower expected return for synthetic exposure? While higher rates undoubtedly impact markets, they impact physical markets in the same way they impact synthetic markets. No market or implementation choice is able to escape the cost of capital!
Taking a step back, remember that a derivative does not require a capital commitment outside of potential collateral/margining needs. When an investor takes a long position via the synthetic market, that individual is implicitly asking someone else to supply the capital for that exposure. For example, when an investor takes a long position in an S&P 500 futures contract, someone else needs to buy those 500 equities. Since this requires a capital commitment and capital is dear, the entity needs to be paid a financing rate. For highly liquid derivatives that have no storage costs, e.g., S&P 500 futures, this rate will be approximately equal to a short, “risk-free” rate, e.g., SOFR or Fed Funds.[1] Said differently, investors expect to earn some rate of interest for letting another investor borrow their cash. When the borrower, in this case the long synthetic investor, pays this rate of interest, that investor is left with the excess return of the equity position, e.g., return of equity less financing costs.
So, what exactly is the expected return of a synthetic equity position? The answer is the equity risk premium. If an investor believes the equity risk premium is 4%, whether short rates are .50% or 5%, the expected return on the synthetic position is still 4%. This may seem overly simplistic as higher interest rates may influence the market-clearing price of the equity risk premium. However, that changes the relative attractiveness of equity as an asset class, not the relative attractiveness of synthetic versus physical equity exposure.
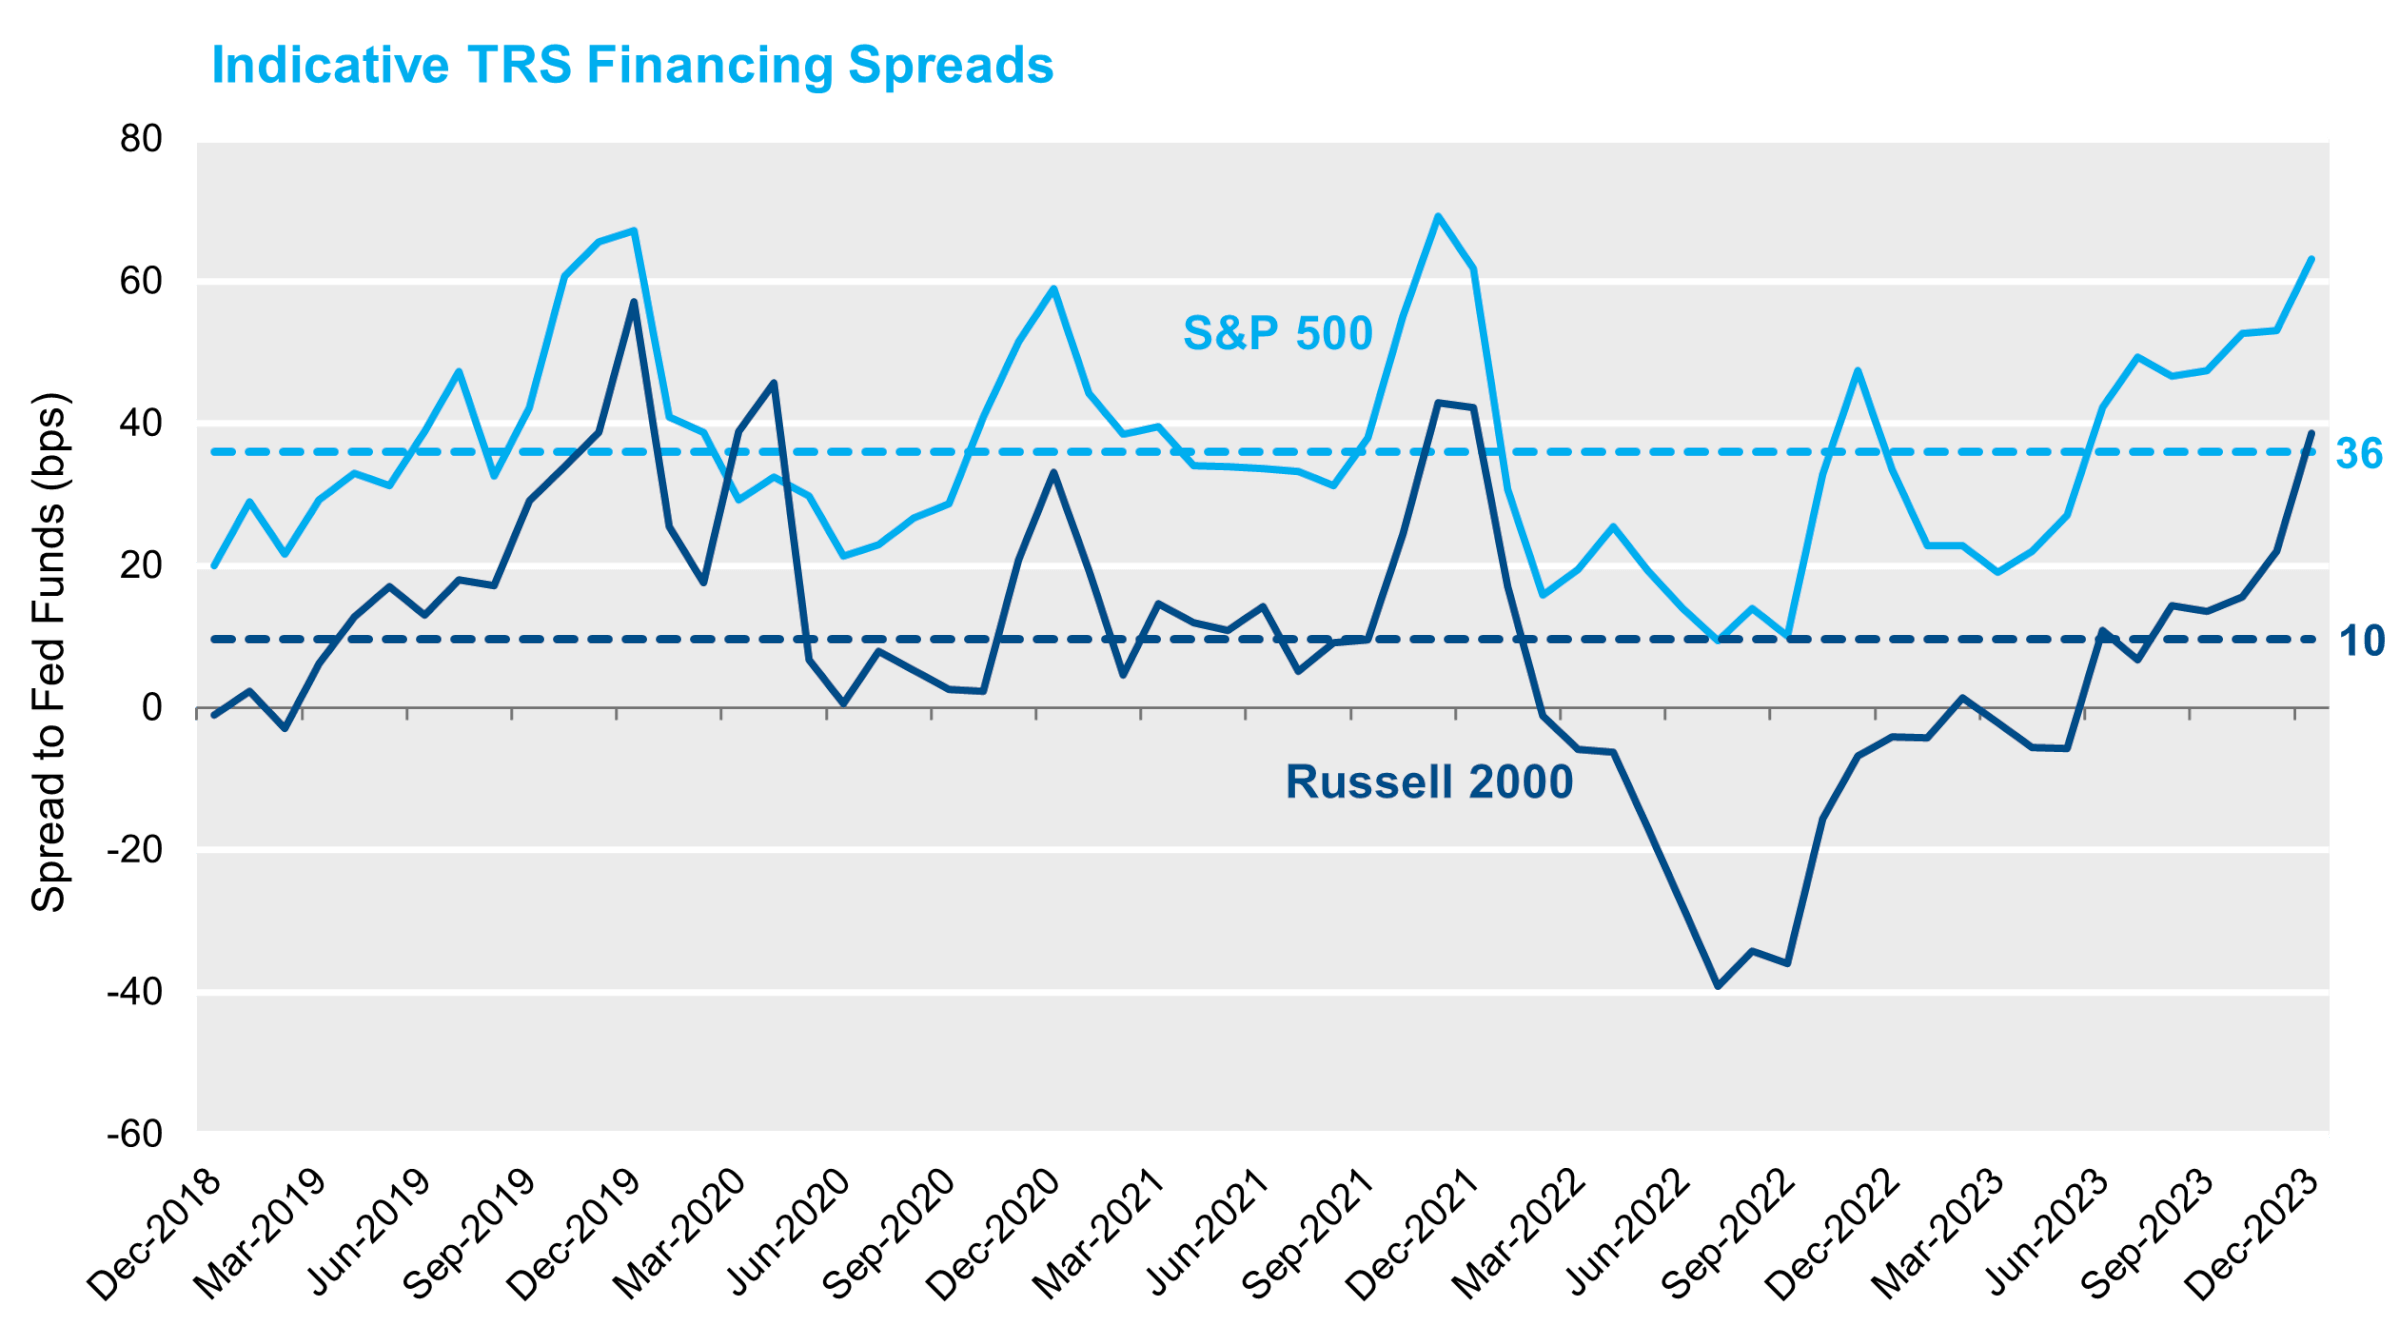
In order to understand whether derivative instruments are more or less costly compared to each other or to physical exposure, an investor needs to examine the spread paid in addition to any short-term interest rate. For example, equity market derivatives are typically quoted (versus SOFR or Fed Funds) and traded at a positive spread.[2] A variety of factors can drive the financing spread of derivative instruments including capital requirements of counterparties, changes in demand for synthetic exposure, availability of exchange traded instruments and structural market imbalances. It is important to note that the range of financing spreads is an order of magnitude lower than that of short interest rates. In fact from 2018 to 2023, SOFR traded in a ~500 bps range while S&P 500 and Russell 2000 financing spreads traded in a ~50 bps and ~80 bps range, respectively.
Figure 1
While short-term interest rates do not impact the attractiveness of achieving exposure using synthetic or physical instruments, the spread above a short-term financing rate can influence that decision.
Fixed Income Derivatives
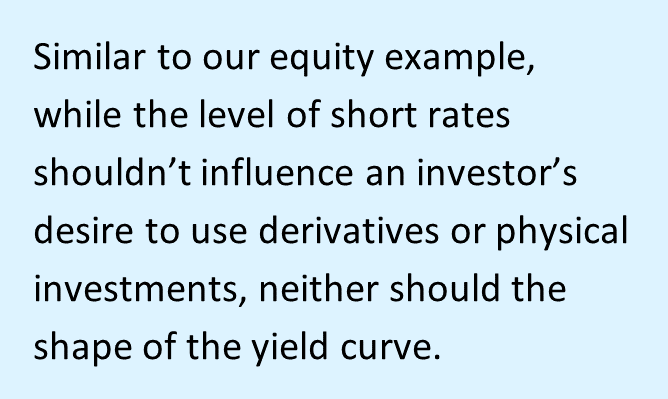 Similar to our equity example, while the level of short rates shouldn’t influence an investor’s desire to use derivatives or physical investments, neither should the shape of the yield curve. Said differently, if capital were available and an investor is willing to buy a 5-year bond in the physical market, the level of short rates or yield curve shape shouldn’t stop an investor from obtaining that exposure in the derivative market. To be sure, the level of rates and shape of yield curve may influence the desire to hold longer-duration fixed income investments, but shouldn’t change whether the exposure is held physically or synthetically.
Again, we ask: What is the expected return on a U.S. Treasury derivative position? After adjusting for financing costs, the return expectation for a U.S. Treasury derivative is the term premium associated with the specific maturity. The term premium is the additional yield investors demand for lending their money for a longer period of time. Asked differently: If an investor purchases a 5-year bond or commits to rolling 1-year T-bills for the next five years, does that investor have a positive or negative return expectation? If the expected return of the 5-year bond is greater than rolling 1-year T-bills, the term premium is positive; if it is lower, the term premium is negative. Like any market, the size of the premium is determined by the risk preferences of the market participants – in short, is it a diversifiable risk and what is its degree of correlation to other undiversifiable risks. For interest rates, this applies across all points on the yield curve and, like the equity risk premium, is unobservable – yield curves notwithstanding.
While the yield curve itself doesn’t tell us the size of the term premium, it does tell us the break-even forward rate at which buyers/lenders equal sellers/borrowers. In fact, break-even yield curve math suggests indifference between holding a 1-year bond and rolling it for five years or holding a 5-year bond. As an example, Figure 2 below shows how the break-even calculation using different yield curves, a traditional upward sloping curve (12/31/2020) and an inverted yield curve (12/31/2023), can result in an expected return difference of zero between long and short rates. Break-even yield curve math suggests that in an upward sloping yield curve environment, short rates will eventually increase. Likewise, in an inverted yield curve, the break-even yield curve math suggests that short-term interest rates will eventually be cut and the average over the five-year time period will match that of the 5-year bond. With the examples below, if the yield curve on December 31, 2023 remains unchanged (and inverted) for the next five years, a negative term premium of ~1.0% would be realized. Of course, break-even yield curve math indicates that is not the case, and by year two the 1-year T-bill yield of 3.65% is less than the 5-year bond yield of 3.85% purchased one year prior. Likewise, as of December 31, 2020, a positive term premium of 26 bps would have been realized if the yield curve had remained unchanged. It is very important to note that the yield curve remaining unchanged is no more likely than numerous other outcomes. We use that as an example because it is a common assumption made by investors. As such, the “1-year Implied Break-even Rates” graphs in Figure 2 illustrate a path of break-even rates that would result in the exact opposite term premium of the yield curve remaining unchanged.
Figure 2
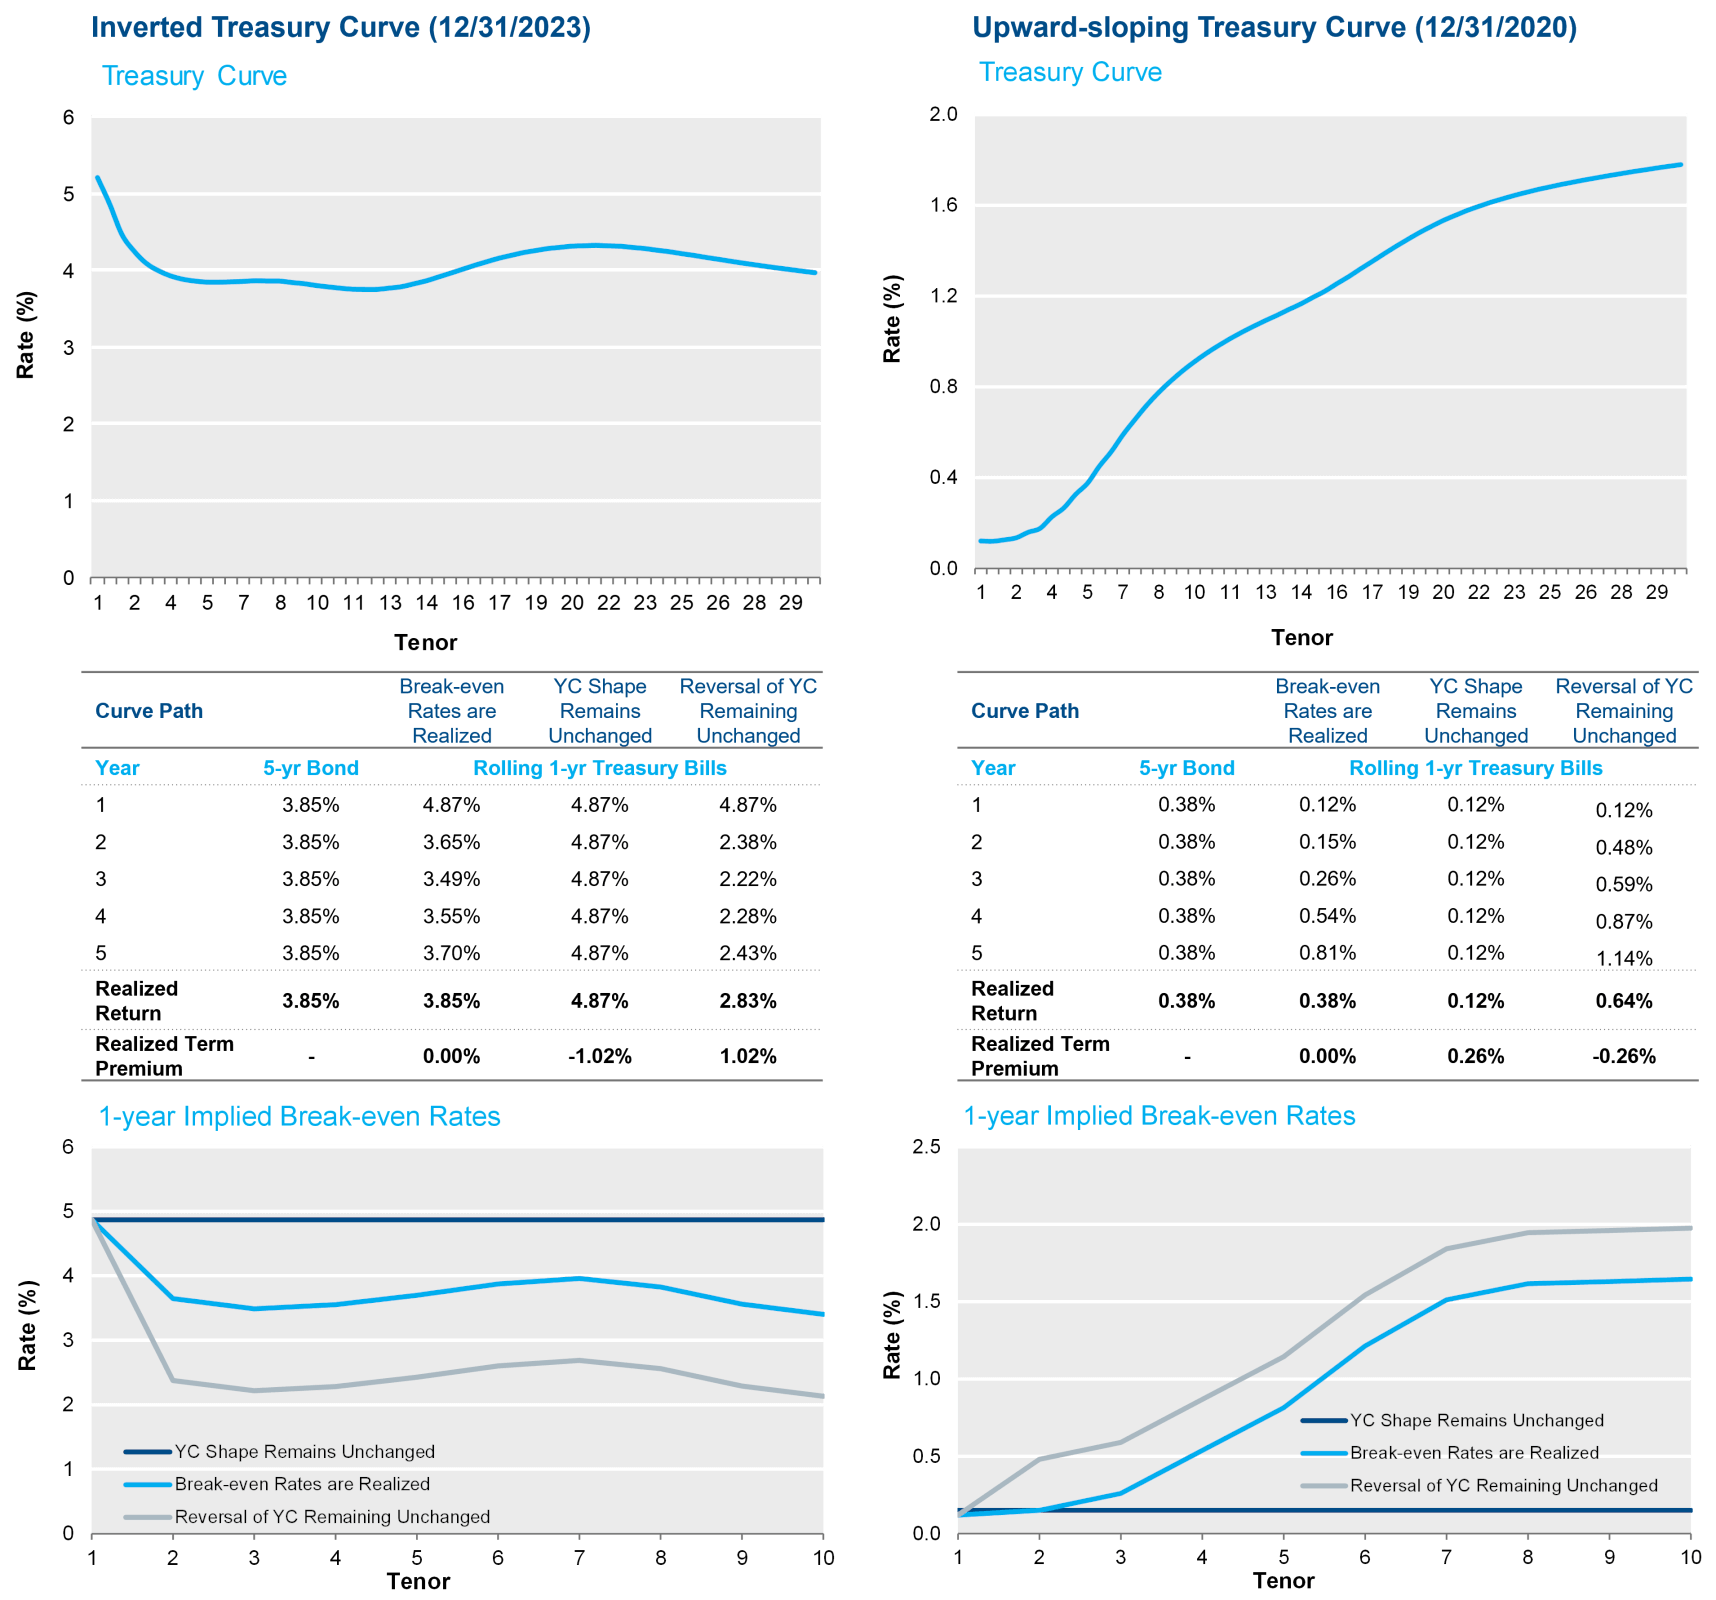
Source: NISA calculations, Bloomberg.
Intuitively, the belief in a positive term premium would suggest that the market yield on the 5-year bond in Figure 2 above will be higher than rolling 1-year T-bills for the next five years. Of course, a term premium may or may not be realized, but that is just as true for any type of risk premium. Much like the equity risk premium, the term premium is unobservable and may or may not be present in yield curves of ALL shapes and levels.
The relative attractiveness of physical versus synthetic Treasury exposure is a byproduct of any additional spread paid above a short-term financing rate. Figure 3 depicts historical spread levels for a 3-month U.S. Treasury total return swap. As an aside, while these instruments trade at a positive spread to short-term financing rates, it is materially lower than spread levels observed in the equity market. This may lead to a preference for obtaining fixed income exposure synthetically while obtaining equity exposure in the physical market.[3]
Figure 3
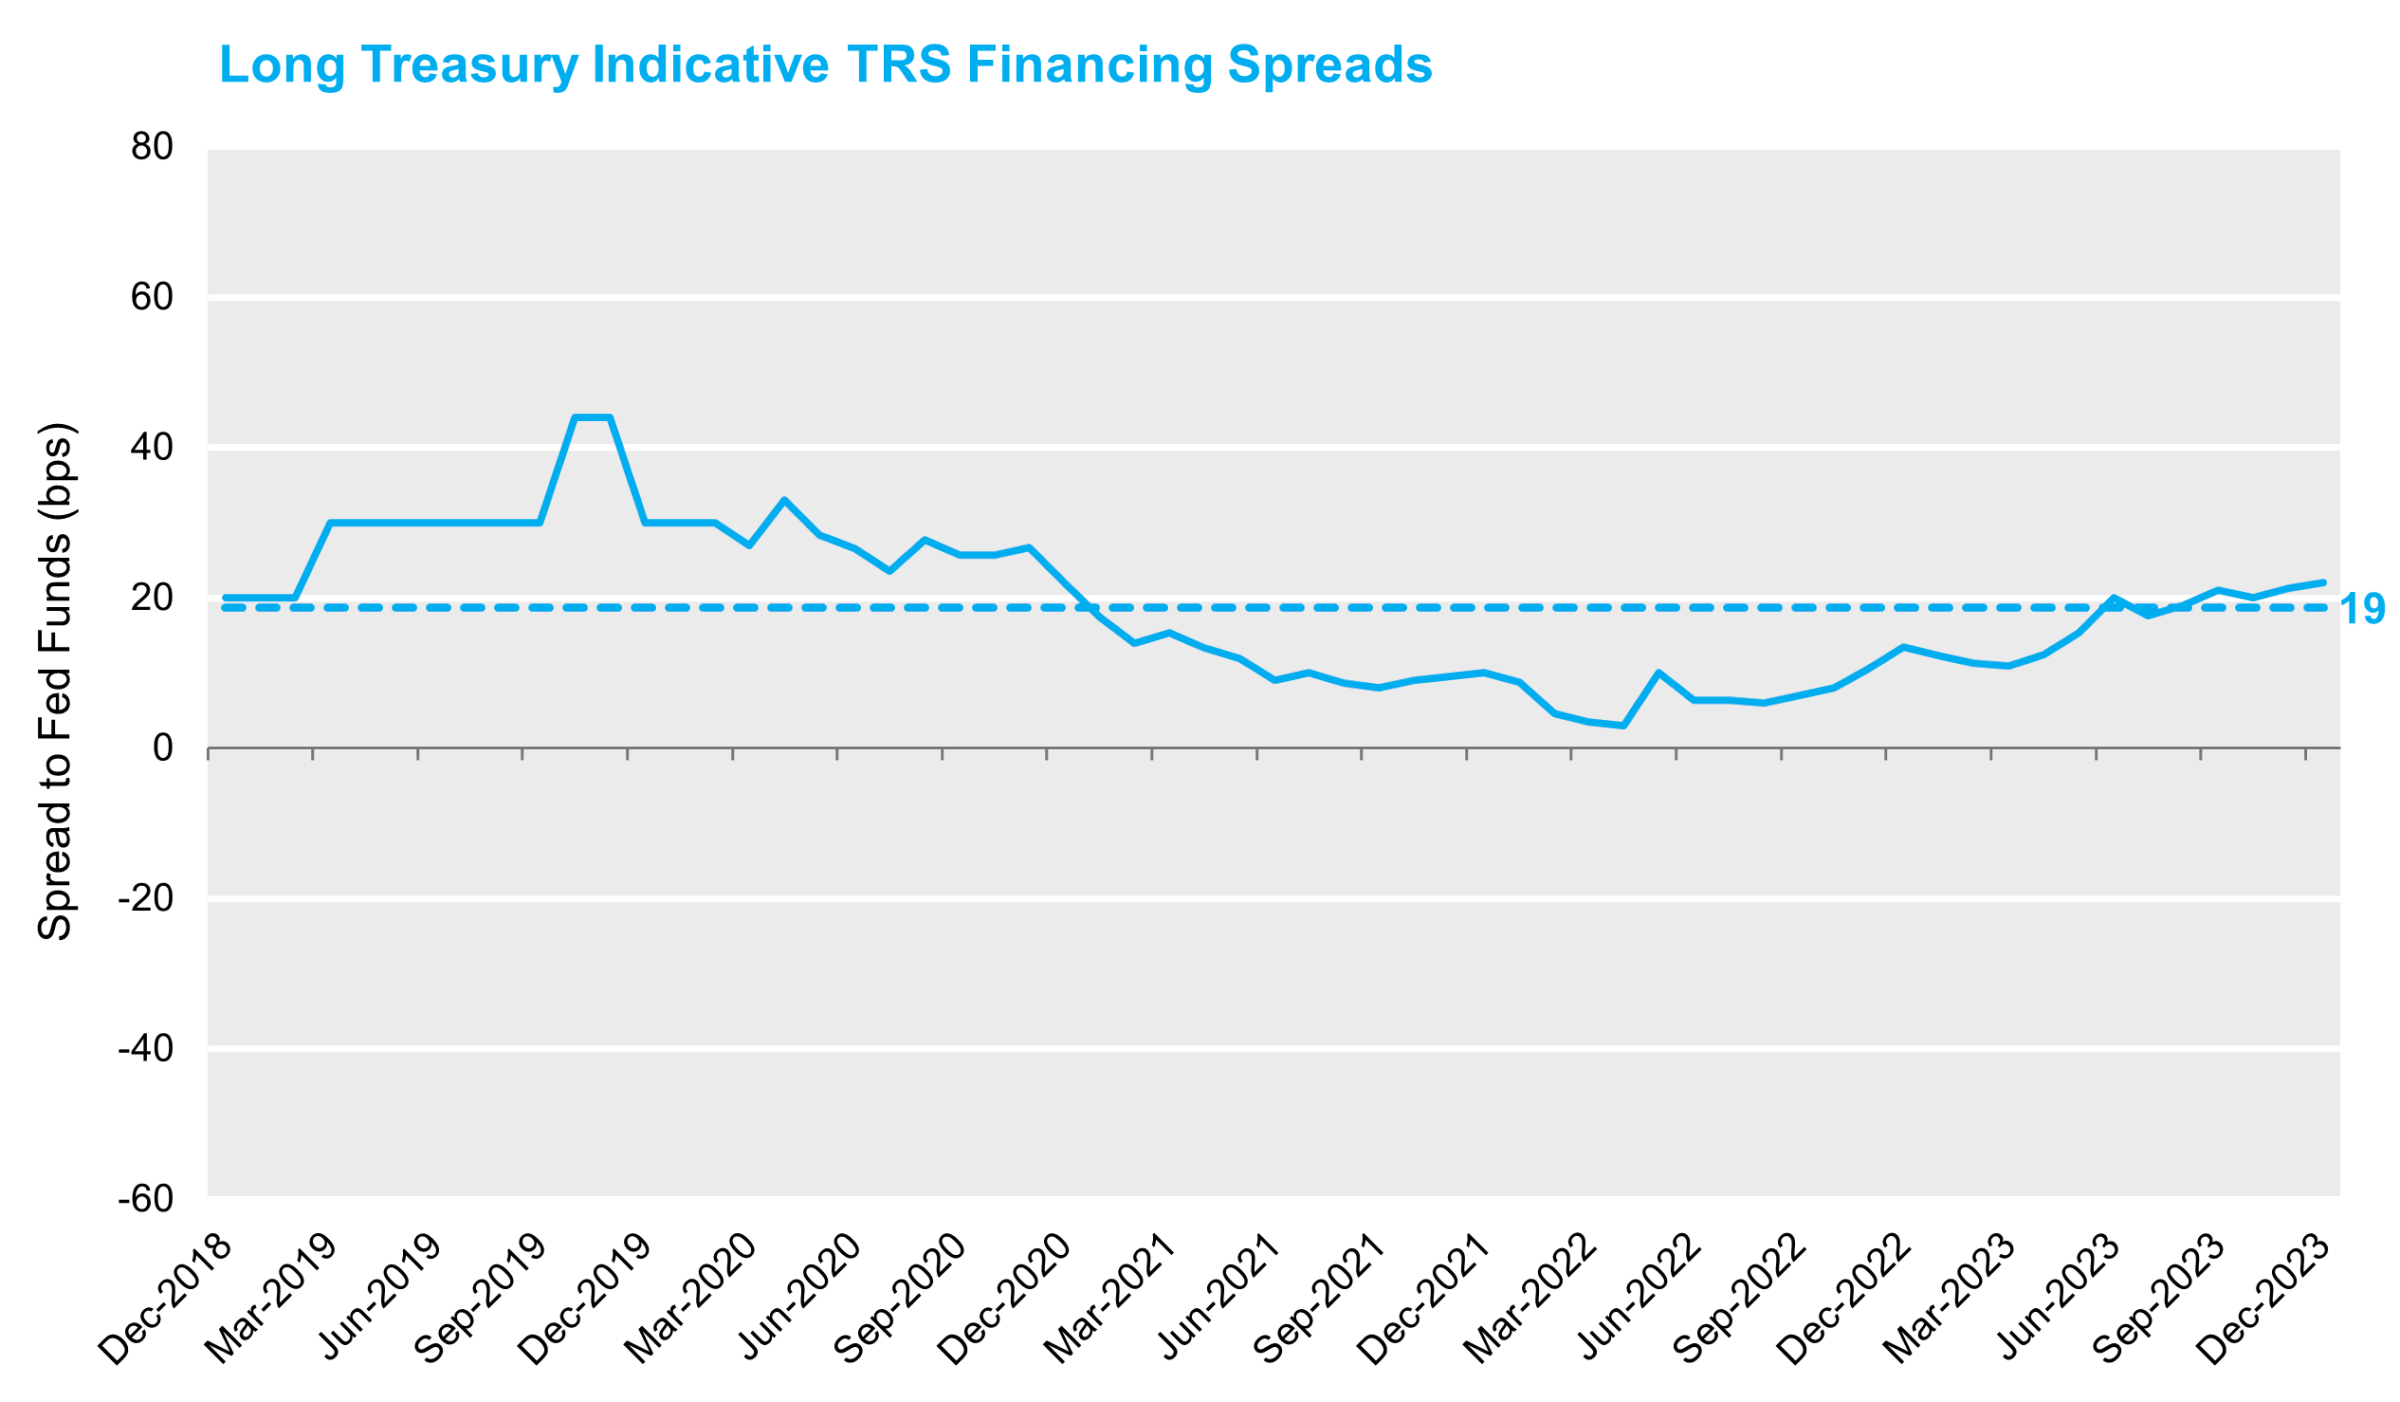
Sources: Dealer indications, NISA calculations.
Conclusion
Derivatives provide investors efficient access to market betas. When determining whether an exposure should be obtained synthetically, investors should separate the relative attractiveness of the market beta (and, by extension, any risk premium being delivered) versus the additional cost (or benefit) of achieving the exposure synthetically. Moreover, once a decision has been made regarding the desire for synthetic exposure, the selection of which market beta to obtain synthetically and what synthetic instrument to use can have meaningful impact on returns. However, what shouldn’t directly impact a decision on the use of derivatives is the level of interest rates or the shape of the yield curve today.
[1] Arbitrage conditions make this precisely true in theory, but largely true in practice. Later in this piece, we will discuss market conditions that drive deviations from a short-term financing rate.
[2] Prior to 2022, total return swaps were commonly quoted versus LIBOR, thus lowering quoted financing spreads, but NOT all-in costs. LIBOR reflected an unsecured rate which was materially different than the current secured overnight financing rate used for quoting positions.
[3] As with most decisions, this is much more complex and should take into account the net-of-fee cost between asset classes. This would include any alpha, expected securities lending returns and management fees.