Last week, we participated in the annual P&I Pension Settlements Strategies conference. We will share the full materials in an upcoming post, but I thought one exhibit was worthy of special attention. One key point in our presentation was that pensions are not inherently risky. Rather, asset allocation drives the risk profile of the pension plan. Perhaps not an earth-shattering observation—but we believe we have come up with a useful way to visualize it.
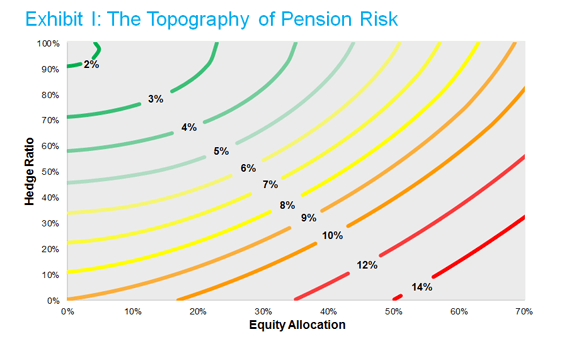
To that end, we developed the “Topography of Pension Risk,” which we share below. The graph illustrates the effect that asset allocation choices have on plan funded status volatility, with the x-axis of the graph showing various allocations to equity while the y-axis represents different hedge ratios. Moving east to west denotes a decrease in a plan’s allocation to equity—decreasing its equity risk—while moving south to north will increase its hedge ratio—thereby decreasing its interest rate risk. Accordingly, heading to the northwest (less equity and a higher hedge ratio) reduces funded status volatility while heading southeast would accomplish the opposite.
Just like any topographical map, the lines represent equal “altitudes”— in this context, equal funded status volatilities. Each line represents the multiple combinations of hedge ratios and equity allocations that result in a given funded status volatility. For example, an annualized funded status volatility of 9%—represented by the first orange line—can be achieved by a 0% hedge ratio and a 0% allocation to equity or by an almost 70% equity allocation with a 100% hedge ratio, and all of the points in between.
What should be noteworthy is both the range of potential funded status risks (e.g. <2% to >14%) and the range of allocations that can achieve a given funded status volatility.
Source: NISA calculations based on data from Bloomberg Index Services Ltd, Citigroup, and JP Morgan as of 7/31/16. Funded status volatility represents an annualized one standard deviation range. Based on illustrative plans that are 100% funded on a Citi AA basis with a liability duration of 14 years.
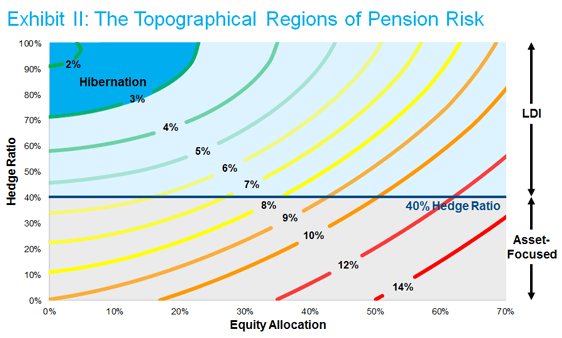
It is possible to further organize the graph by region. The southern half, below the 40% hedge ratio line, represents the “Asset-Focused” area, in which a plan’s interest rate sensitivity is significant and consequently funded status volatility is higher. The northern half, above the 40% hedge ratio, is the land of LDI solutions and less risky outcomes. Finally, the northwest corner represents the Hibernation region, with hedge ratios above 70% and equity allocations of 20% or less, resulting in funded status volatilities below 3%.
Source: NISA calculations based on data from Bloomberg Index Services Ltd, Citigroup, and JP Morgan as of 7/31/16.
One key takeaway from this graph is the potency of asset allocation decisions. Different asset allocation choices can leave a plan with significant differences in risk. Even strategies that some may consider “safe” can result in surprisingly high levels of risk. For example, a hedge ratio of 40%—which certainly falls within the LDI genre of solutions—can actually leave a plan with a material amount of risk if the equity allocation is high. Similarly, a set 40% allocation to equity can result in widely varying risk, with this specific plan going from over 12% funded status volatility all the way down to less than 5%, depending on the hedge ratio.
This graph can be useful in a variety of ways. It certainly demonstrates the most direct path to risk reduction (i.e., directly northwest). It also illustrates the way to reduce risk with the least forgone expected return. By heading due north (reducing interest rate risk), a plan can materially reduce funded status volatility while maintaining its equity allocation, which presumably has little if any impact on expected return.
The graph underscores our main point. Pensions in and of themselves are not risky; instead, it is the asset allocation decisions of the plan that fuel pension risk. Plans that remember that are poised to better control their own destinies.