NISA has consistently argued that risk assets play a useful role in end-state/hibernation portfolios, in moderation. While every hibernation portfolio needs to be designed based on its specific circumstances, a reasonable starting point to consider would be a portfolio comprised of 20% return seeking assets and 80% hedge assets – more specifically, 20% equity, 50% corporates and 30% Treasuries, designed to complete the overall interest hedge relative to the liability.
While equities are a natural first choice to anchor the return seeking asset allocation in such a portfolio due to their near ubiquitous role in institutional portfolios, the goal of this paper is to examine whether high yield can earn its way into the portfolio. Our conclusion is that a meaningful portion of equity may warrant being replaced by high yield in order to provide a superior end-game portfolio – one that has a similar expected return but with lower expected funded status volatility[1].
High Yield – Hedge Asset or Risk Asset (with Benefits)
Before we consider including high yield, it seems fitting to decide “What is it exactly?” Fixed Income? Hedge asset? Risk asset? Though this may be a case of “A rose by any other name…” it is instructive to examine high yield’s exposure profile and juxtapose its exposures to those of equity in an effort to classify it accurately.
While arguments could be made based on structure (e.g., fixed cash flows), we believe the most reliable approach is to look at high yield’s behavior and estimate its empirical durations. Durations, plural, because we simultaneously estimate high yield’s Treasury rate and spread durations by running a two-variable regression, with Treasury rate and spread changes as right-hand side, or our explanatory variables[2]. We do the same for equity and investment grade corporate bonds. As we ultimately want to make predictions about the behavior of these assets in the context of a liability hedge program, we use a high-quality, corporate spread as our proxy for spread exposure.
Table 1 provides these estimates, including a reasonable error bound around each estimate[3].
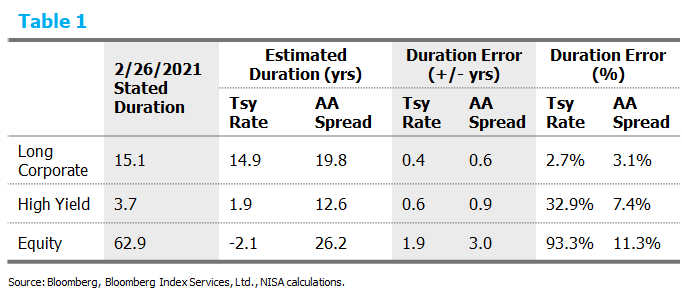
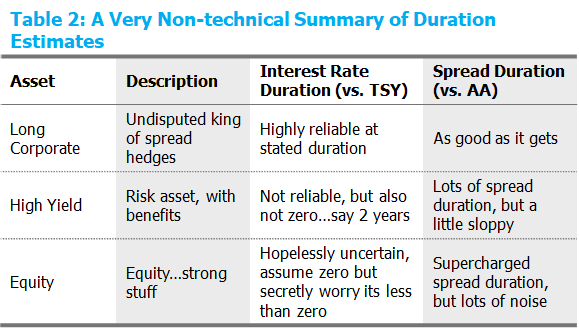
A few observations are readily apparent. In particular, the stated duration for high yield and equity is an awful indicator of Treasury rate duration, with the equity having the ignoble distinction of actually having the wrong sign on its stated duration. Table 2 summarizes our conclusion, in an uncharacteristically simple way.
This paper does not attempt to identify whether high yield represents better risk-adjusted return in an asset-only context. Perhaps we will examine high yield from that angle in a future post, but in the meantime, we assume a version of asset class market efficiency. That is, each asset class’s excess return represents appropriate compensation for its risks. For example, in a one factor world, each asset class would have an equivalent expected return on a beta-adjusted basis.[4]
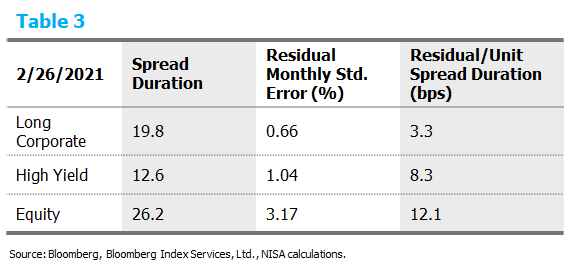
But in the case of corporate pension liabilities, a key risk measure is risk relative to liability fluctuations. Accordingly, of particular importance is the error as a percentage of the duration estimate in Table 1. Table 3 measures each of the assets’ effectiveness as a liability spread hedge by reporting the standard error of the residual from the analysis above, per unit of estimated spread duration. As the regression breaks down each asset into its corresponding exposure to Treasuries and spreads, the residual is essentially a functional form of the instrument’s tracking error when analyzing a liability hedging program[5]. So, of course, the lower this quotient is (tracking error/estimated spread duration), the better, as it normalizes the size of the “baggage” given the amount of spread hedge the particular asset delivers.
By this rough measure, high-yield bonds certainly have more attractive characteristics than equity. Based on this, we would expect to improve the funded status volatility of end-state portfolios by replacing some portion of the equity portfolio with high yield bonds. And in fact, the analysis below in Figure 1 shows that to be the case.
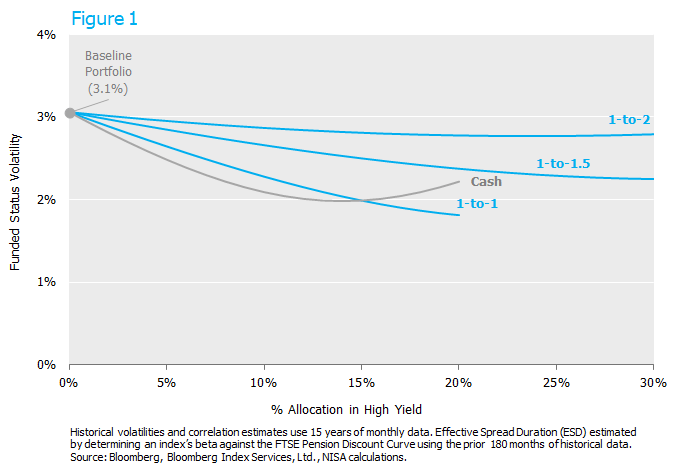
Each line in the chart above begins on the left of the graph with the Baseline Portfolio, an end-state portfolio of 20% equity, 50% corporate bonds and 30% US Treasuries. The total portfolio is matched from a duration perspective using a portion of the Treasuries as a completion portfolio. For the risk asset portfolio, high yield is assumed to have its empirical rate duration (e.g., ~1.9 years). Equities are assumed to have a rate duration of zero as the empirical estimate of equity rate duration is not statistically different than zero.
Each of the blue lines replaces the baseline portfolio’s equity allocation with some amount of high yield bonds, ranging from a one-to-one replacement ratio to as much as one-to-two equity/high yield replacement ratio.[6] In each case, the overall funded status risk falls with the inclusion of some amount of high yield. Funded status volatility even falls when the replacement rate is such that the investor can reasonably expect the new portfolio to be return neutral (e.g., 1-to-1.5 or 1-to-2 replacement ratio).
For reference, we include a grey line that represents selling equity to cash. We do this to provide a completely fair reference point for these high yield allocations. This is because our baseline, end-state portfolio is modestly long spread duration relative to the liability. We see this as a common end-state portfolio characteristic. It provides an expectation of modest outperformance vs. the liability, often in an attempt to cover all plan costs, build a slight surplus for future surprises, etc. Accordingly, if the baseline portfolio is long spread exposure, any reduction in spread exposure will naturally reduce funded status volatility. Moving from equity to high yield 1-to-1 is, of course, just such a reduction. Perhaps the most powerful argument for high yield is that it can replace equity 1-to-1 and deliver a very similar reduction in funded status volatility as moving that same equity allocation to cash. While this replacement ratio will reduce expected return, it clearly shows an attractive alternative to simply owning less equity. For example, a sponsor debating between 10% and 20% may want to seriously consider setting the equity exposure at 10% and allocating 5-10% in high yield.
Conclusion – The Equity/High Yield Cocktail
Our analysis suggests a strong case for a modest amount of high yield in typical end-state portfolios. While a strict quantitative interpretation of the presented data would argue to replace the entirety of the hibernation portfolio equity with high yield, given other very pertinent characteristics of the two markets, we would suggest more of an equity/high yield cocktail. In particular, 5-10% in high yield mixed with 10% -20% equities would provide an attractive funded status volatility vs. expected return tradeoff, in our opinion.
Appendix – Two Variable Empirical Duration Methodology
To estimate the empirical duration of each asset class, we regressed the returns of each asset (Long Corporates, High Yield and US Equities) on our measures of rate and spread exposure. For rates, we used a Treasury return series based on a typical liability cash flow pattern, multiplied by the ratio of the “stated” option-adjusted duration (OAD) of the asset over the OAD of the liability proxy. For spreads, we used an excess return series based upon a typical liability cash flow pattern and exposure to AA spreads used to discount pension liabilities, multiplied by the same ratio of OADs. The purpose of multiplying the exposure proxy by the ratio of durations is to control for the fact that we expect durations to vary dramatically over time simply due to the levels of rates. If we do not control for this fact, there will be bias in our empirical duration estimates and the residual of the regression will be inflated. Using this methodology, the interpretation of the coefficients is quite straightforward. A rate coefficient of 1.0 means the asset is expected to behave in accordance with its stated duration. Coefficients less than one suggest an asset’s effective duration is less than its stated duration. Coefficients greater than one suggests an asset’s effective duration is greater than its stated duration. For the excess return (spread duration) coefficient, we get implied beta adjustments to the AA spread exposure of the liability. For instance, a coefficient greater than one suggests the asset class responds more than the liability per unit of stated duration when AA spreads move. Stated duration for long corporates and high yield were based on durations published by Bloomberg. Stated duration for equity was set equal to 1/dividend yield.
For example, to estimate the empirical duration of high yield, the following regression was run:
Return on High Yield = A + B1 x (Long AA Corporate Treasury Component of Return x Duration of High Yield / Duration of Long AA Corporate) + B2 x (Long AA Corporate Excess Return x Duration of High Yield / Duration of Long AA Corporate) + error
The results of this analysis using monthly returns from December 31, 2010 to December 31, 2020 are as follows:
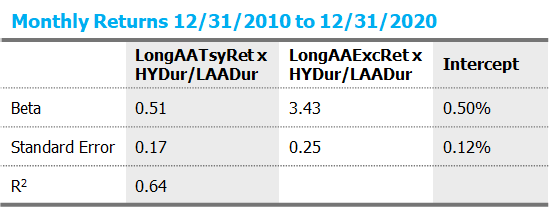
Accordingly, with the stated duration at 3.66[7], we estimate the durations as of February 26, 2021 as:
Treasury: 0.51 x 3.66 = 1.9
AA Spread: 3.43 x 3.66 = 12.6
[1]For simplicity this paper focuses on end-state (aka Hibernation) portfolios. Similar results hold for LDI portfolios more generally, with a high yield allocation commensurate with the overall size of the risk asset portfolio.
[2]See appendix for methodology details.
[3]For equity, we use 1/Dividend yield as the “Stated Duration” as this would indeed be the duration of equities if equity cash flows were fixed.
[4]Based on a simple CAPM based analysis, for every $1 of equity sold, $1.75 – $2.00 dollars of high yield must be purchased to remain beta/return neutral.
[5] One very important, but very realistic assumption is made to make this statement. Specifically, that other assets exist that can neutralize the liability’s Treasury exposure. Given the availability of Treasury securities and/or derivatives, we believe this is an easy assertion.
[6] High yield can replace equity at ratios greater than one by simply utilizing a portion of the Treasury portfolio.
[7]With respect to Bloomberg Barclays index data in this presentation – Source: Bloomberg Index Services Ltd. © 2021 Bloomberg Index Services Ltd. Used with permission. Bloomberg is a registered trademark of Bloomberg Finance L.P. and its affiliates.