Since the New Year is always a time for reflection, and we are pension geeks, we thought it would be interesting to take a look at how the biggest defined benefit corporate plan sponsors have shifted their plan allocations over the last decade. Using company filing data gathered for our Pension Surplus Risk Index, we can obtain a high-level estimate of how the 100 largest plans have adjusted their allocations over time. The results are clear: the old stereotype of defined benefit plans being resistant to change no longer holds true.
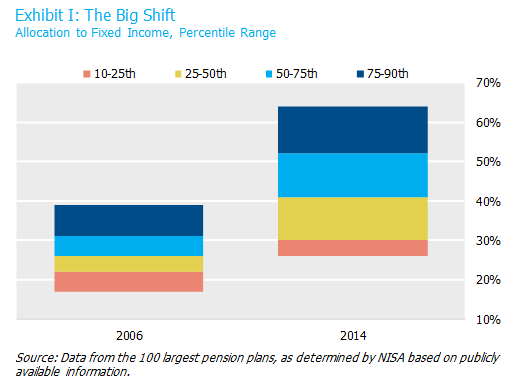
Between 2006 and 2014 (the latest year for which we have comprehensive data), we see a remarkable shift in asset allocation—both in terms of the average allocation as well as the dispersion of allocations. Over this relatively short period (by pension standards), the median allocation to fixed income increased by 15 percentage points. Additionally, the range of allocations is now almost twice as wide as before. In 2006, only 10% of plans had fixed income allocations greater than 39%. By contrast, at the end of 2014 more than half of all sponsors had fixed income allocations greater than 40%—many with 60% or more.
The drivers behind this shift are harder to pin down, but undoubtedly the Pension Protection Act of 2006, plan freezes, and the market crash of 2008 contributed to this migration toward bonds. Whatever the reason, it is evident that many sponsors have put glidepaths in place. Perhaps more importantly, they have executed those plans and made material progress in de-risking.