Very little currently could be described as “normal,” but curiously (and perhaps surprisingly) we think interest rates have made the very short list of all things normal in 2020.
In a recent Webinar, we discussed various market-based assessments of the potential future direction of interest rates. The data presented that received perhaps the most attention was the implied distribution of interest rates based on option pricing – and for good reason. The data suggest a remarkably symmetric distribution for rate movements from today’s levels.
Discussions around rate forecasts often include the very understandable sentiment of “they can only go up from here” or “there must be more upside risk in rates than downside risk.” I say understandable as that pesky zero level of rates feels very near with the 10-year Treasury and 30-year Treasury at approximately 0.75% and 1.55%, respectively. Of course, if countries like Japan and Germany have taught us anything, there is certainly nothing in markets that prevents negative rates – even as far out as 30 years on the yield curve. Nevertheless, there is something about negative rates that feels “wrong,” so why wouldn’t there be some sort of financial market force field that inherently repels rates from getting lower at some point? And since there is no reason to believe there is a similar force lurking out there on the upside[1], and certainly nothing feels wrong about a 3% long bond, for example, shouldn’t the distribution of rate moves be asymmetrically tilted to the upside? While this is an understandable feeling, it is always nice to test the evidentiary basis for this view with some data. Option prices provide us with such data.
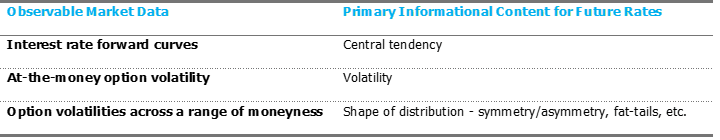
Current yield curves, and the corresponding forward rates, are useful when thinking about the central tendency of interest rate movements.[2] But they tell us nothing about the range of possible outcomes around this central tendency. We can improve our understanding of future rates by looking at the volatility assumption priced into options on interest rates, the so-called “implied volatility” of options. For example, it is common to use the volatility of at-the-money options to give a market-based standard deviation of interest rates. But if we insert these estimates in a standard model for random variables, we will tautologically get back the shape of the distribution from that model – for example, the symmetry of a normal distribution.
Fortunately, the options market has a much greater richness of data. Specifically, we can look at the volatilities of options with a wide range of strike levels around the at-the-money strike. It is seldom the case (maybe never) that all these strikes have the same implied volatility. One interpretation of this surface[3] of volatilities is that the market is embedding a view that the real-world distribution of interest rates does not adhere to the distributional assumption assumed by the option pricing model. That is, maybe rates aren’t normally (or log-normally) distributed, and this option market “skew” will confirm a very asymmetric distribution to rates.
If market participants were pricing in larger potential increases in rates relative to movements down, option prices would need to reflect this sentiment. That is, since options represent payments expressly contingent on the future levels of rates, all else equal, investors would need to pay more for options that benefit from an increase in rates than those that benefit from similar moves down. While we don’t know the market’s sentiment, we can observe the option prices themselves, and therefore their corresponding implied volatilities. We can then use this surface of option volatilities to reverse engineer the market’s implied distribution of interest rates. [4]
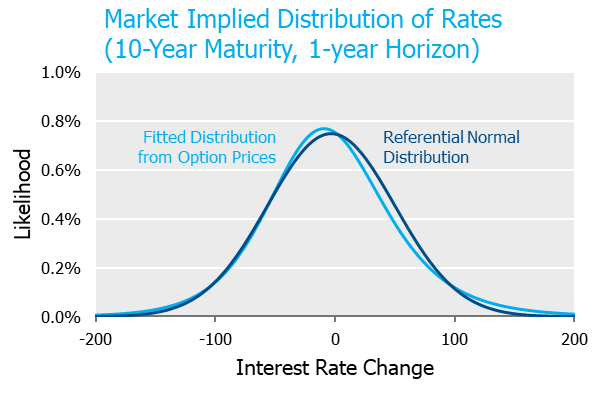
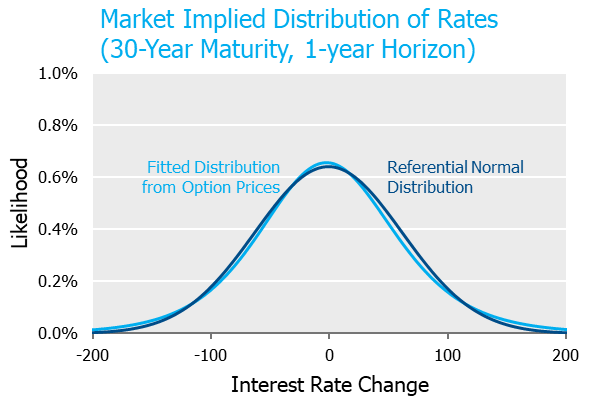
The graph below incorporates the information embedded in one-year options on 10- and 30-year maturity underlyings between 300bps of moneyness relative to current rate levels.[5] Since eyeballing curves can be dangerous, we also provide a referential normal distribution to serve as a yardstick. As is quite evident from the chart, the market is ostensibly pricing rates very close to a normal, i.e., symmetric distribution[6].
Since squinting at charts to see differences can be frustrating and frankly, probability density functions can be difficult to interpret, we convert these distributions into a few discrete outcomes below. A comparison of the likelihood of similar rate movements up vs. down shows the market has priced extraordinary symmetry into rate movements.
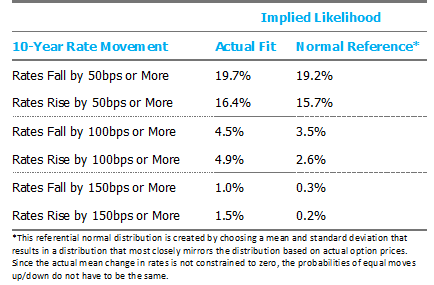
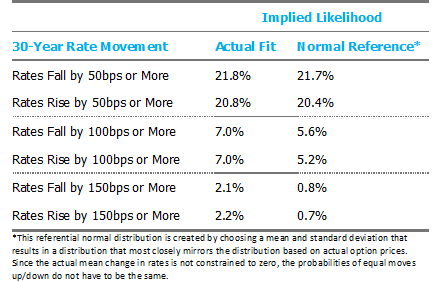
While not entirely satisfying, I suppose it is nice to know at least one thing is “normal” in 2020. And perhaps most importantly, we believe it is instructive to use implied sentiments from market pricing as a baseline when evaluating any rate views.
[1] The U.S. Federal Reserve Bank may beg to differ.
[2] This is not to say forward rates must be the central tendency. Any view on term premiums on various maturity bonds must be incorporated when calculating the expected level of rates in the future. That said, our opinion is that term premia, if any, are on a scale that is much smaller than the typical slope of the curve. Therefore, using forward rates as expectations is often a good starting point. If you ever want to see a bar fight break out at a NISA social event, this would be a good topic to raise.
[3] A surface requires three variables, in this case (x) option strike, (y) maturity of underlying, and (z) the implied volatility. Since we will look at one maturity at a time in each exhibit, think of a slice of the surface for each maturity – aka, a curve.
[4] We first fit a volatility surface based on weighted real-world pricing data and the SABR methodology of Hagan et al with parameters that permit negative rates and with a requirement that the at-the-money volatility implied by the SABR fit be equal to that of the available pricing [1]. Implied future rates probabilities are then calculated from this SABR fit based on a methodology proposed by Hagan et al which yields an approximation of the marginal probability distribution for future rates [2]. [1] Hagan, P.S., Kumar, D., Lesniewski, A., Woodward, D.E.: Managing smile risk, Wilmott Mag. (2003). [2] Hagan, P., Lesniewski, A., Woodward, D.: Probability Distribution in the SABR Model of Stochastic Volatility. Large Deviations and Asymptotic Methods in Finance. Springer, 2010.
[5] Analysis throughout the note is based on swaption prices as they represent the most liquidly traded interest rate options.
[6] Throughout this post, we largely use “normal” and symmetric interchangeably, when of course they are not. That said, the only appreciable difference in these observed distributions vs. a normal distribution is slightly fatter tails than a strict normal distribution. As the tables below point out, these fatter tails are effectively symmetric, which is the point of this post.