




The Special Financial Assistance (SFA) provisions of Sec. 9704 of the American Rescue Plan Act of 2021 (ARPA) provide a needed lifeline to many multiemployer plans facing insolvency in the coming decade. The goal of this legislation, roughly speaking, is to forestall insolvency for the next 30 years. While ARPA makes great progress toward this goal, in many cases the forbearance period may be shorter.
Eligible multiemployer plans will be able to apply for direct financial relief in the form of a single lump sum payment from the PBGC. The exact impact of these provisions will depend upon a multitude of factors, such as PBGC’s interpretation of the Act and how it will measure specific features of each plan (e.g., liability duration, current funded status, additional contributions expected over the horizon). Moreover, market returns on assets outside of the financial relief will also be key to extending the life of a plan and delaying any future potential insolvency.
In order to understand potential impacts of the program stemming from (i) how the SFA provisions are interpreted and implemented, and (ii) the use of particular market assumptions, we will examine an illustrative plan’s current liability and assets in isolation. This approach will allow us to examine the SFA Program’s potential impact on a plan’s continued ability to make benefit payments without the real-world complication of additional contributions or benefit accruals. Regardless of the underlying assumptions, the SFA will materially increase the amount of multiemployer benefits paid than would have otherwise been the case.
Liability Valuation
As an illustration, we look at the value of a 10-year duration bullet, nominal liability of $100. The table below shows a variety of potential discount rates and present values for the liability as of 3/31/21.
| Discount Methodology | Present Value | Discount Rate |
|---|---|---|
| 10-year Treasury Discount Rate | $83.8 | 1.78% |
| 10-year AA Discount Rate | $78.7 | 2.43% |
| Current Discount Rate Associated with 3rd PPA Segment Rate + 200 bps | $58.3 | 5.55% |
| Representative Discount Rate Used by Multiemployer Plans | $48.5 | 7.50% |
While we would normally share views on what is an appropriate discount rate, that discussion is largely irrelevant to our central point. Specifically, given the prescribed ARPA discount rate (and required investment strategy), how many years of benefits can be expected to be paid. Starting with a couple of common discount rates, a $100 obligation payable 10 years from now has a value close to $78.7 assuming an AA-discount rate (consistent with most single-employer pension plans) and a value of $48.5 with a discount rate of 7.5% (closer to a typical multi-employer plan discount rate1).
Relating this information to our understanding of ARPA, financial assistance will be based on the next 30 years of benefit payments2 and (in most cases) will use the 24-month average 3rd PPA segment rate + 200bps as a discount rate. At current rates (5.55%), the value of the $100 obligation is $58.3.
It remains unclear at this stage how current assets, future contributions, and other factors may be incorporated into the deterministic projections PBGC will ultimately prescribe in its final regulations or other guidance.3 We can nevertheless begin to explore whether an asset portfolio can be constructed to make the next 30 years of benefit payments.
A Simple Projection Model
NISA’s working assumptions to calculate deterministic projections for how long a plan would be able to make benefit payments under certain conditions are below.
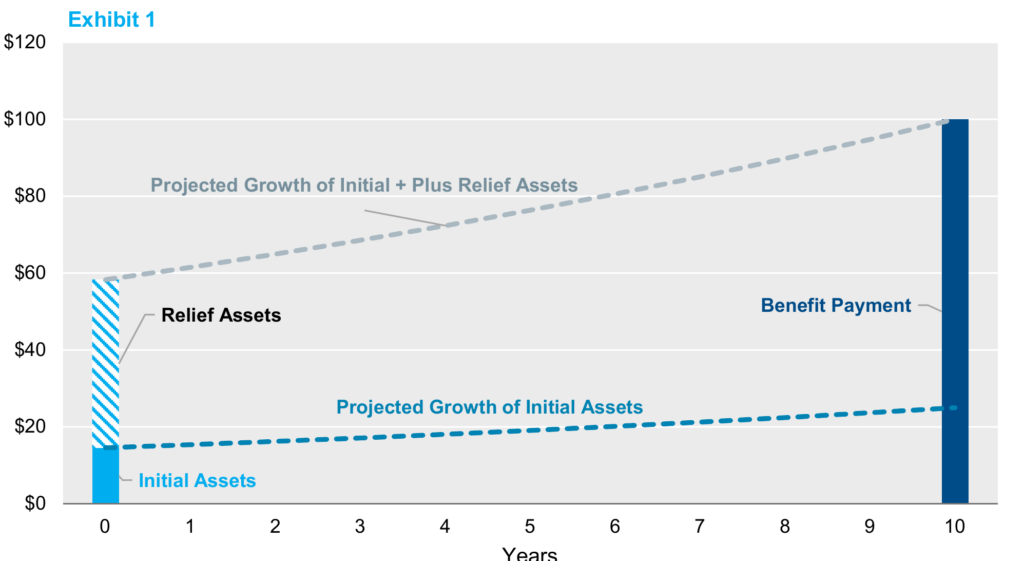
The chart below gives a simplistic illustration of the model. For a simple bullet liability of $100 in 10 years and initial funded status of 30% (based on a 7.5% discount rate), we assume the financial relief calculation will apply the 5.55% rate of return to initial assets. The SFA assets4 would then be calculated based on any portion of the 10-year obligation which is unable to be paid with current assets. As noted in the table above, $58.3 represents the initial liability at a 5.55% discount rate. With current assets of $14.6, that implies $43.7 of SFA assets.
Moving to a more realistic example of the liability, we have assumed the following:
- Illustrative Plan (Plan) assets are projected forward at the prevailing PPA rate of PPA + 200bps (5.55% for rates applicable to March 2021).5
- Any shortfall between today and 2051 is discounted at the same rate. This approach is conceptually the same as discounting the liability at 5.55% and comparing to the asset size today.
- Note: As we currently understand the potential SFA calculation, assistance will be calculated based on the lower of the 3rd PPA segment rate + 200bps or a plan’s expected return on assets. Therefore, given a typical multiemployer discount rate of 7%+, most plans will use PPA + 200bps as the interest rate for determining the size of financial assistance.6
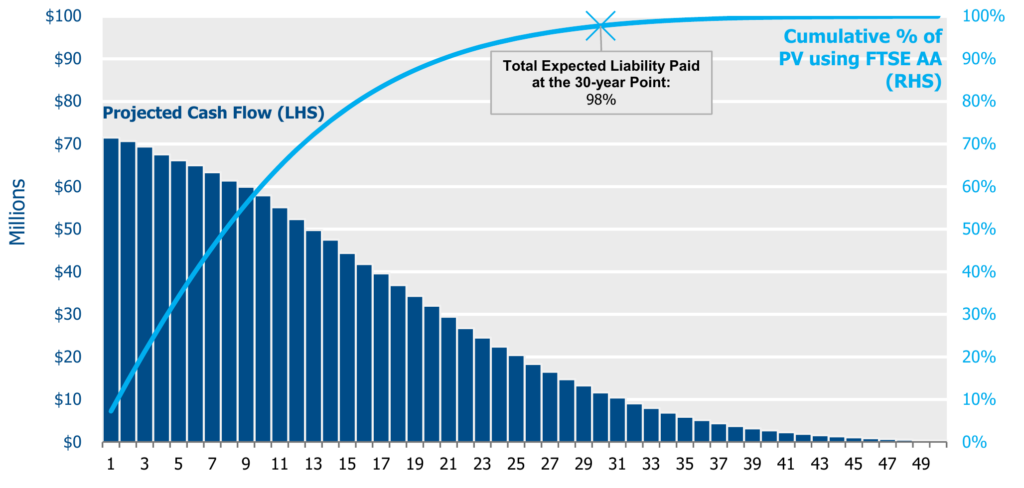
- The liability is assumed to be a 10-year duration liability with $1 billion of PV when discounted using the FTSE Pension Discount Curve. See appendix for the assumed liability cashflow profile.
- Non-SFA Assets are held in return-seeking assets (RSA). Thus, a 0%, 10%, and 40% funded plan will have 0%, 9%, and 35% in RSA respectively when measuring the portfolio size as (SFA + non-SFA assets).7
- Benefit payments and expenses are sourced from SFA assets first.
- Fixed income asset returns for a given period are projected based on expected returns for high quality corporate bonds (in this case, based on the forward curve implied by the FTSE AA Pension Discount Curve as of 3/31).
Analysis
The most dire situation is our 0% funded Plan. This is the scenario facing plans which have already depleted assets or rely exclusively on incoming contributions to make benefit payments. This 0% funded plan will earn the yield implied by the FTSE AA Pension Discount Curve with its SFA Assets and would be expected to deplete the portfolio in 14.0 years.8
Before we explore the impact of initial assets, we should recognize that it is possible to invest in investment grade bonds at credit qualities lower than what an AA-discount curve implies. A lower quality portfolio allows the plan sponsor to pursue a higher risk premium. An additional 50bps of spread buys the plan 0.9 years of additional benefit payments by increasing the yield of the fixed income portfolio. If a total additional spread of 1% is attainable, perhaps through a combination of higher yielding bonds and manager alpha, the projected depletion date increases to ~15.9 years or 1.9 years longer than a AA-portfolio.
This seems surprising given that the financial assistance was calibrated around a 30-year benefit payment horizon. Is something off?
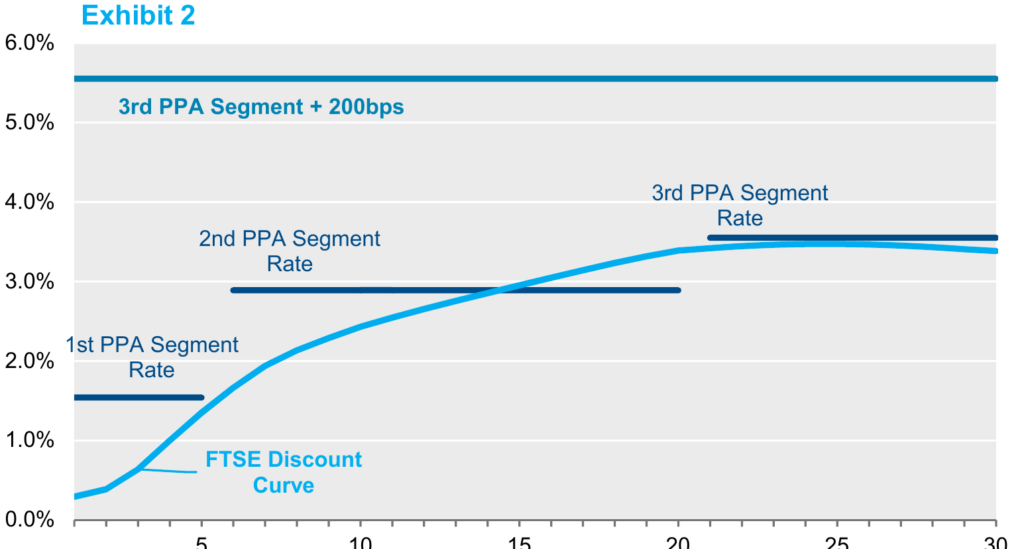
The disconnect is explained by the difference between the stated discount rate (e.g., 3rd segment PPA rate + 200bps) and current market rates. The disconnect is partially due to differences in the PPA 3rd segment rate construction methodology and partially due to the 200bps spread.9
To put this in perspective, as of 3/31 the OAS of the Long Corporate index was 125bps over Treasuries or roughly 60bps over AA-rates. By comparison, the 3rd PPA segment rate + 200bps results in spread to the 10-year Treasury of approximately 375bps. The table below depicts the various PPA segment rates and current market index rates.
Of course, plans that have initial assets at the time relief is provided will fare better. Using the liability and fixed income assumptions above as a base case (SFA Assets can earn the FTSE AA Pension Discount Curve + 100bps), partially funded plans will have the ability to invest the non-SFA portion of the portfolio in return-seeking assets (RSA). If the level of initial assets reduces the amount of financial assistance available under the final PBGC interpretation, then the added value of initial assets is simply the calculation of the wedge between expected returns of an investment grade fixed income portfolio and the return-seeking portfolio. The table below illustrates return assumptions for an RSA portfolio and the expected date of the last benefit payment covered by the combination of SFA and non-SFA assets. At a 7% RSA return, a 20% funded plan would be able to support ~20.2 years of benefit payments compared to 15.9 years for a 0% funded plan. And the present value of liabilities not covered would be 11% instead of the 19% as is the case of the 0% funded plan.
Even though a plan may deplete assets prior to the 30-year point, the liabilities that remain are substantially smaller. Even for a completely unfunded plan the remaining liability (including cashflows beyond 30 years) only represents 19% of its current size.
| Funded Status @ 7.5% DR | Years of Benefit Payments Made | % of PV Unpaid (FTSE AA) | ||||
|---|---|---|---|---|---|---|
| 6.5% | 7.0% | 7.5% | 6.5% | 7.0% | 7.5% | |
| 0% | 15.9 | 15.9 | 15.9 | 19% | 19% | 19% |
| 10% | 17.4 | 17.8 | 18.3 | 16% | 15% | 14% |
| 20% | 19.1 | 20.2 | 21.7 | 12% | 11% | 9% |
| 30% | 21.2 | 23.6 | 28.5 | 9% | 7% | 3% |
| 40% | 23.9 | 30.5 | 40+ | 6% | 2% | 0% |
From a reasonableness standpoint if we assume a 2% Treasury rate as the constant, risk-free rate over the duration of the plan, the equity risk premiums used to compute the RSA expected returns reported in the table above range from 4.5% to 5.5%.
Conclusion
Regardless of PBGC’s interpretation and implementation of ARPA, the program will substantially improve outcomes for participants and extend the life of multiemployer pension plans. At first glance however, the program seems likely to fall short of its potential goal of making all benefit payments over the next 30 years. The primary culprit of this shortfall is the disconnect between the discount rate and expected asset returns.
After understanding the size of the financial assistance and the expectation for the benefit payment horizon, the next step is determining the appropriate investment strategy. In a follow-up piece we will look at the tradeoffs between different fixed income strategies: Treasury, credit, short duration, long duration, cashflow matched, etc. and the impact on benefit coverage and certainty of outcome.
Appendix
The duration of the liability is a large driver of the ability to meet the stated objectives. Table 2 from above has been repeated for both 8- and 12-year duration liabilities. We also show how these tables look for a 10-year duration liability if PBGC interpretation of ARPA is that current assets do not offset relief.
8-year Duration (Assuming Current Assets Reduce Amount of Financial Assistance)
A shorter duration liability does shorten the date when a plan would run out of financial assistance assets to 13.7 years versus 15.9 years for a 10-year duration liability. However, the remaining value of the liability at insolvency is also smaller: 17% versus 19% as with the 10-year duration liability.
| Funded Status @ 7.5% DR | Years of Benefit Payments Made | % of PV Unpaid (FTSE AA) | ||||
|---|---|---|---|---|---|---|
| 6.5% | 7.0% | 7.5% | 6.5% | 7.0% | 7.5% | |
| 0% | 13.7 | 13.7 | 13.7 | 17% | 17% | 17% |
| 10% | 15.1 | 15.5 | 15.9 | 13% | 13% | 12% |
| 20% | 16.7 | 17.7 | 18.9 | 10% | 9% | 7% |
| 30% | 18.7 | 20.8 | 25.4 | 7% | 5% | 2% |
| 40% | 21.4 | 28.4 | 40+ | 5% | 1% | 0% |
12-year Duration (Assuming Current Assets Reduce Amount of Financial Assistance)
| Funded Status @ 7.5% DR | Years of Benefit Payments Made | % of PV Unpaid (FTSE AA) | ||||
|---|---|---|---|---|---|---|
| 6.5% | 7.0% | 7.5% | 6.5% | 7.0% | 7.5% | |
| 0% | 17.8 | 17.8 | 17.8 | 22% | 22% | 22% |
| 10% | 19.3 | 19.7 | 20.3 | 19% | 18% | 16% |
| 20% | 21.0 | 22.1 | 23.7 | 15% | 13% | 11% |
| 30% | 23.0 | 25.4 | 29.8 | 12% | 9% | 5% |
| 40% | 25.5 | 30.9 | 40+ | 8% | 4% | 0% |
10-year Duration (If Current Assets Are Not Used to Offset Relief Calculation)
Another interpretation of the rules, in which the current assets do NOT impact the amount of financial assistance, provides a more material benefit to plans that have assets. The impact on a 0% funded plan remains unchanged. For a plan with a funded status greater than 20%, all current liabilities are expected to be payable.
| Funded Status @ 7.5% DR | Years of Benefit Payments Made | % of PV Unpaid (FTSE AA) | ||||
|---|---|---|---|---|---|---|
| 6.5% | 7.0% | 7.5% | 6.5% | 7.0% | 7.5% | |
| 0% | 15.9 | 15.9 | 15.9 | 19% | 19% | 19% |
| 10% | 22.7 | 23.9 | 25.6 | 7% | 6% | 5% |
| 20% | 40+ | 40+ | 40+ | 0% | 0% | 0% |
| 30% | 40+ | 40+ | 40+ | 0% | 0% | 0% |
| 40% | 40+ | 40+ | 40+ | 0% | 0% | 0% |
For reference, the assumed 10-year duration liability cashflow profile has been included:
Notes
- Plans very close to insolvency may have lower discount rates as they have moved a significant portion of their assets to fixed income. ↩
- We are using 30 years as shorthand. The legislation allows financial assistance to be calculated based on current benefit payments through year 2051. For simplicity, benefit payments here may also include expenses considered in the relief calculation. ↩
- PBGC is to issue these within 120 days of ARPA’s passage – by early to mid-July. ↩
- Assets provided to plans as a benefit directly resulting from the financial assistance of the SFA provisions. ↩
- For simplicity we assume future contributions cover all future benefit accruals; this allows us to focus solely on the current funded position. ↩
- A Plan that is very close to reaching a 0% funded position may have a lower discount rate as it will have likely moved a significant portion of its assets to fixed income. ↩
- Funded status for asset breakout expressed using a typical Multiemployer discount rate of 7.5%. ↩
- This is based on the legislation indicating only investment grade fixed income securities will be eligible without additional approval from PBGC. ↩
- The 3rd segment rate does not reflect market rates for a variety of reasons, it is a smoothed rate based on the prior 24 months and is based on rates beyond the 20-year point of the curve and uses an extrapolation approach for estimating rates out to 60 years. The 3rd segment rate also embeds a lower credit quality than a typical AA discount curve, making the 200bps add-on amount even more challenging to achieve. ↩